≡ Menu

Week 7 NCAA SRS Ratings and the B12 lovefest may be back

Hey Bob, did you know the fate of the conference is in your hands?

Last year, the computers loved the Big 12. The first BCS Standings will be released tonight, and I suspect the B12 will again be viewed favorably by the computers. As a whole, B12 teams have just three nonconference losses, and two of them were by Kansas (to Rice and Northern Illinois). As long as the other nine teams in the conference keep crushing the Jayhawks, those losses won’t matter. The other loss came by Oklahoma State in Arizona, which looks bad in retrospect but again the damage may be limited. With the exception of a blowout over Lousiana-Lafayette, OSU simply hasn’t looked good this season, falling short of a single-game SRS score of 50 in every other game. Yesterday, OSU won by just six points in Manhattan. For the purposes of Kansas State, Oklahoma, Texas Tech and West Virginia, as long as they also beat down on Oklahoma State (and Texas has already handed them one conference loss), I suspect the computers will continue to love them. And for purposes of the BCS computers, a win over the Cowboys is all they will need (as margin of victory is not included).

On the other side, the conference doesn’t really have any landmark victories, either. Mississippi (via Texas), Louisiana-Monroe (Baylor), Tulsa and Iowa (Iowa State), and Miami (Kansas State) are the most impressive heads hanging in the conference’s living room. We might not learn a lot about the Big 12 conference teams as they relate to the rest of college football — the 10 teams have already played 29 of their 30 nonconference games this season. Fortunately for us, that last remaining game is in two weeks, when Notre Dame travels to Oklahoma. If the Sooners win that game, the computers will likely love the Big 12 for the rest of the season.

Below are the SRS Ratings after seven weeks. As always, thanks to Dr. Peter Wolfe.
[continue reading…]

{ 1 comment }

College Football BCS odds

Before today’s games, I figured we could take a second to look at the latest odds to win the BCS Championship:

[continue reading…]

{ 4 comments }

Extreme Outliers: Rookie Edition

Griffining: Playing for a coach that tries to help you.

Both Andrew Luck and Robert Griffin III have been very successful this year. Griffin ranks 2nd in Y/A, 2nd in AY/A, 4th in NY/A, and 4th in ANY/A, an incredible performance nearly across the board (he’s 23rd in sack rate) by the Redskins rookie. He also is leading the league with a 69.1% completion rate and ranks 5th in passer rating. Luck ranks only 23rd in Y/A, 22nd in AY/A, 21st in NY/A, and 18th in ANY/A, respectable numbers for a rookie but on the surface, little more than that. He does rank 7th in sack rate, which is an excellent sign, but he ranks last in the NFL in completion percentage (in the non-Mark Sanchez division) and only 25th in passer rating.

But there are some other stats out there that paint a different picture. ESPN’s Total QBR ranks Griffin 11th overall — slightly below most of his other metrics — but ranks Luck as the fourth most effective quarterback so far this season. Also, despite Griffin’s edge in most metrics, the Colts and Redskins are essentially tied in three key drive metrics — points per drive, yards per drive and drive success rate — and I don’t think that’s because Donald Brown is so awesome. As Nate Dunlevy pointed out to me, one reason for this is that Luck has accumulated a large number of rushing first downs: Luck is tied for the league lead with Arian Foster on third down rushes that resulted in a first down. And once you account for strength of schedule, Luck vaults to #1 on the QBR list.

But let’s put aside effectiveness for right now. Some advanced metrics show you that they’ve been skinning cats in very different ways:

  • According to Advanced NFL Stats, Luck has thrown a pass 15 yards past the line of scrimmage on 24.3% of his throws, the 5th highest rate in the league. Griffin ranks 32nd with a deep rate of just 12.2%, ahead of only Matt Hasselbeck.
  • If you completely removed Yards After the Catch from the equation, Luck would rank in the top 10 at 4.5 yards per attempt while Griffin would rank 25th with just 3.5 yards per attempt.
  • Griffin ranks third behind just Christian Ponder and Philip Rivers when it comes to percentage of passing yards that are due to YAC, at 58.7%; Luck ranks 32nd, ahead of only John Skelton and Mark Sanchez, with only 33.4% of his yards coming on yards after the catch by his receivers.
  • According to Footballguys.com’s subscriber content, the Colts have targeted their wide receivers on 72.1% of their passes, the second highest rate in the league behind the Rams. The Colts are also last in the league with only 6.4% of their passes aimed at running backs (this also jives with the numbers from Mike Clay of Pro Football Focus.). The Redskins are more middle of the road in these metrics, but Andrew Luck is being forced to rely on his wide receivers with no real receiving threat in the backfield to help him out. As a result, it’s probably not too surprising that his completion percentage is so low.

Luck has also excelled in the two-minute drill and no-huddle situations early this year, although Griffin has been no slouch in those departments, either. But it’s clear that the Colts — rightly or wrongly — aren’t treating Luck with kid gloves. In fact, one could argue that they’re treating him no differently than they did Peyton Manning. Luck is averaging 44.3 pass attempts per game so far this season, second behind only Drew Brees. With a mediocre defense and a bad running game, the Colts are basically putting each game in the hands of Luck to win. Griffin is averaging only 27.8 pass attempts per game right now, and the Redskins have done a fantastic job molding the offense to to suit Griffin’s strengths.

Griffin’s numbers are better right now — ESPN excluded, of course — but that may be a reflection that the Shanaclan is more nurturing than Bruce Arians. Griffin’s success is outstanding, but Luck has been doing just as well under much more challenging conditions.

Update: Jeff Bennett, one of the creators behind ESPN’s Total QB, e-mailed me some notes this morning:

We break rushing out into two categories, scrambles and designed rushes. The quarterback receives more credit for scrambles then designed rushes – the reason being designed rushes are, well, designed to help the quarterback get more yards on the rush. Scrambles are not. Whatever positive or negative that comes from those is mostly on the quarterback.

So back to Luck. He has nine first down rushes this season on scrambles, most in the NFL. Seven of the nine have come on 3rd down, which generally is more important since the alternative to not picking up a 1st down is likely a punt instead of 2nd or 3rd down. No one else in the league has more than three 1st down rushes on scrambles.

Luck’s average pass is traveling 9.8 yards downfield this season. That is the third longest average pass distance in the league (behind Joe Flacco and Jay Cutler). Griffin averages 7.2 yards, a full yard below league average.

The average quarterback this season is getting 56% of their passing yards via “air yards” (meaning 44% of yards are coming after the catch). Griffin has 43% of his yards through the air. Luck has 68%.

{ 3 comments }

Week 5 Power Rankings

Cameron Wake does not need to leave the ground to sack the quarterback.

I agree with Aaron Schatz and Brian Burke: the 49ers are the best team in the league, not that such a designation holds any meaning. Last week, I had Houston as my only 13-win team, and the Texans aren’t dropping from that pedestal (and Jason Lisk still has Houston at #1).

But the big mover this week is Miami, who look to be one of the six best teams in the AFC. Disagree? Quick, name another good team in the AFC outside of Houston, New England, Baltimore, Pittsburgh, and Denver. As I wrote in this week’s Fifth Down post, the AFC is clearly the inferior conference in the NFL today. Well, Miami legitimately appears to be a playoff contender in the watered down conference. Note that all of Miami’s three losses have come to either Houston or in overtime in games in which Miami looked to be the superior team.

One reason for Miami’s success is the dominant play of outside linebacker-turned-defensive end Cameron Wake. Miami’s defensive line is dominating the run and Wake is leading the league in combined sacks, hits, and hurries. This offseason, the media gushed about the Bills and wouldn’t stop talking about the Jets, but so far this season, Miami has been the second best team in the division.

[As always, the number of wins I’m projecting each team to finish the season with is in column 3. The fourth column – PWIN – shows how many wins I projected last week, and the difference column represents how many wins I added or subtracted this week. The “RSOS” column stands for the remaining SOS for the team, based on the number of projected wins I’m giving to each of their opponents. The “RHG” column stands for remaining home games.]


{ 1 comment }

NYT Fifth Down: Post-week 5

This week at the New York Times, I took a look at the large shift in the NFL’s conference wars:

Consider that from 2002 to 2010, the A.F.C. won 56 percent of games against the National Football Conference, with an average score of 23.0 to 20.2. The percentage in favor of the A.F.C. from 2004 to 2010  was 57, an edge that is equivalent to what you would expect for a home team in a game against evenly matched squads.

The dominance of the A.F.C. was also obvious when examining the elite teams. According to Pro-Football-Reference.com’s Simple Rating System, the top six teams in the A.F.C. in each year from 2002 to 2010 had an average rating of +7.7, indicating that they were 7.7 points above average. The top N.F.C. teams were only 4.6 points better than average. This difference became particularly glaring in the Super Bowl;  the A.F.C. champion has been the favorite in 9 of the 10 Super Bowls since realignment.

But things have changed. Last year was the first since 2002 that the N.F.C. won the interconference battle, albeit by the razor-thin margin of 33-31. That was just the appetizer. Entering last weekend, the N.F.C. was 10-4 against the A.F.C.

Then, in seven interconference games in Week 5, the N.F.C. won five more games. The Vikings beat the Titans, the Giants handled Cleveland, the Bears overpowered the Jaguars, the Saints defeated the Chargers, and the 49ers crushed the Bills. If not for last-minute comeback wins in Pittsburgh and Indianapolis, it would have been a horrific football weekend for the A.F.C.

The N.F.C.’s record this year is now a sparkling 15-6 in interconference games, with the average game margin being over 10 points.

The N.F.C. has also won the last three Super Bowls, although the Saints and the Giants were underdogs entering Super Bowls XLIV and XLVI. So why has the balance of power shifted in the N.F.L.?

As you might suspect, the league’s most important position provides a clue. In the East, North and South divisions, all 12 N.F.C. teams have found their answers at quarterback, or at least are no longer searching for their quarterback of the future.

Last year, Detroit’s Matthew Stafford was the third player to  throw for 40 touchdowns and 5,000 yards in a season, and he wasn’t even selected to fill one of the conference’s three Pro Bowl quarterback slots — or chosen as an alternate, thanks to great seasons by Aaron Rodgers, Drew Brees, Eli Manning and Cam Newton.

And while the N.F.C. West is short on talented quarterbacks (Alex Smith-excluded, as he leads the league in passer rating and is second in Adjusted Net Yards per Attempt), it is very long on great defense, and is 4-0 against the A.F.C this year.

Meanwhile, the Bills, the Jets, the Dolphins, the Browns, the Titans, the Jaguars, the Raiders and the Chiefs all have question marks at quarterback. Uncertainty at quarterback is a sure way to shift the balance of power.

You can read the rest of the article here.

{ 0 comments }

www.notacompiler.com.

Career statistics can be very misleading, since a player can hang around for a bunch of meaningless years but really pad his totals. Six years ago, Doug came up with a system that only counted the receiving yards a player recorded after his first 1,000 receiving yards each season.

I’m going to do something similar for running backs, but instead will focus on individual game performances. I have game logs for every running back (post-season included) for every game since 1960. What I did was zero out all rushing yards in games where a player had 50 or fewer rushing yards; in the remaining games, I only gave those runners credit for the rushing yards they gained after their first 50 rushing yards. The “RYov50” column shows the running back’s career rushing yards after removing the first 50 rushing yards he had in every game; the next column shows each player’s career rushing yards (since 1960, including post-season), and the first “Perc%” column shows the ratio of the “RYov50” column to the career rushing yards. A higher percentage means the player spent most of his time as the lead back for his team, while a lower percentage indicates that the player spent significant time in a committee and/or stuck around for several years past his prime. Obviously for still active players, the percentage column could be misleading as they may not have entered the decline portion of their careers just yet.

The #50YG column shows how many games the player had over 50 rushing yards, and the next column shows what percentage of games the running back gained over 50 yards. For players like Jim Brown, this study only includes his seasons starting in 1960, and for active players, 2012 data is *not* included:
[continue reading…]

{ 11 comments }

And then Tom said to his offense, “Bama Left”

Belichick is watching you.

One thing I’d like to do more of here at Football Perspective is to point you in the direction of some great content you can find at other sites. You can scroll down and on the right side column I have a “Friends of FP” list, linking to great sites like Pro-Football-Reference.com, Footballguys.com, Smart Football, my old comrade Jason Lisk at The Big Lead, Football Outsiders, and Brian Burke’s Advanced NFL Stats. In addition, I also frequent Bill Barnwell at Grantland, Mike Tanier at Sports on Earth, Scott Kacsmar, and Pro Football Focus. And yes, Matt Hinton, who also moonlights at CBS and Football Outsiders, remains the best college football writer out there. And then there are my tireless Footballguys co-Staffers like Sigmund Bloom, Matt Waldman, Jene Bramel, and Cecil Lammey, who somehow simultaneously never stop talking football and maintain a consistently excellent quality of production. There are more great writers out there — this is probably why I have always gotten distracted whenever I try to link to some of the excellent content out there.

But Greg Bedard has delivered a fascinating look into how Chip Kelly (and Paul Brown) have helped Bill Belichick further refine his incredible offense. The entire article is worth a read, and I won’t quote it all, but here are some particularly interesting points:

[continue reading…]

{ 2 comments }

We don’t know anything and we never will

Five weeks in, you start to hear NFL experts trade their preseason overconfidence for regular season overconfidence. It’s tempting to fall into the trap thinking that with over a quarter of the season in the books, now we have an idea of how the rest of the regular season will unfold.

It’s tempting, but it’s not really true. The best way to measure whether someone knows what they’re talking about is to see if their predictions come true. Fortunately for us historians, each game a group of experts predict what will happen every week — it’s called the point spread.

Assuming we actually learn something each week, then the point spreads should reflect the actual results as the leaves change colors. But do they?

I looked at the point spread for all regular season games from 1988 to 2011. Now the question becomes how do we measure if a point spread was “right”? If the Texans are favored by 7 to beat the Bengals, and they win by 10, is that a “good” projection?

The simplest way to test this is to see the difference between the actual result and the projected result. The line that was most “off” in the database came two years ago. Likely due to the genius of Josh McDaniels, the Raiders were 7-point underdogs in Denver in 2010, but won the game 59-14. So in that game, the line was off by 52 points. Last year, the 49ers were 3-point favorites at home against Tampa Bay, but won by 45 points; that line was “off” by 42 points.

One interesting sidenote: you might think that big lines are more likely to be off by bigger margins than small lines. But that’s not really the case. The standard deviation of “how much a line is off by” is roughly 8 points regardless of the spread. It’s not exact, of course, but for our purposes, we can work under the assumption that lines are generally equally likely to be off by the same amount regardless of the spread.

Anyway, back to the point of the post. How accurate are lines early in the year? In week 1, the spreads are generally a little tighter than they are the rest of the way; perhaps the oddsmakers are just as unsure as the rest of us. But no matter what week it is, the lines are always off by about 10 points per week. Take a look. The table below shows how much the lines were off by, on average, in weeks 1 through 17 from 1988 to 2011. In the last column, I’ve shown the percentage of games where the line was within 10 points of the actual result.

It’s tempting to think we know more once we see more, but that’s unfortunately not the case. Of course, if it was, it would be easy to make money gambling on football.

For those curious, week 12 of the 2003 season was as close as Vegas has ever come to perfection. Look at how close these lines were to the actual results (as always, the boxscores are clickable):

What about the other side of the coin? Vegas was really, really, really off in week 17 of the 1993 season. Just so you know, 1993 was the year the NFL tried the double-bye week approach resulting in an 18-game season, so this was really like a week 16 most years:

{ 8 comments }

How predictive is 4th quarter play?

Last week, Neil had a fascinating post on how each team’s win probability has varied by quarter over the last 35 years. The 2004 Pittsburgh Steelers were the poster child for wins added during the 4th quarter and overtime. Pittsburgh went 15-1, which means they exceeded the league average by 7 wins (the average team, of course, goes 8-8). So how did Pittsburgh go about getting those extra 7 wins?

The table below lists all 16 regular season games for the Steelers. The fifth column shows the point spread before the game, and the sixth column assumes that the home team has a 57.9% chance of winning every game. Of course, that’s going to be modified by the actual point spread, so the next column shows the win probability added based on the Vegas line. This is neutral of the home field WP, and the “wpa bg” column shows the total win probability of the team before the game. So when the Steelers hosted the Raiders in week 1, they were a 3.5-point home favorite, which meant they had a 60% chance of winning. The next four columns show how much win probability was added by the end of each quarter.

For a 15-1 team, the Steelers were rarely heavy favorites; in fact, based on the point-spread in each game, Vegas would have expected Pittsburgh to win only 8.8 games. And while the Steelers played well in the first half, the main reason they achieved their lofty record was their 4th quarter performance. In fact, over half of their wins over average could be attributed to their great 4th quarter play. To put it another way, if you turned off every Pittsburgh game in 2004 right at the end of the 4th quarter, you would have guessed that the Steelers would win only 11.8 games.

That may not mean much in the abstract, but let’s compare the Steelers to the other teams with 15+ wins in NFL history:
[continue reading…]

{ 2 comments }

.

Buffalo's defense probably would have been better yesterday if Bruce Smith played. Even at age 49.

For a seven-year stretch beginning in 1988, the San Francisco 49ers or Buffalo Bills were in each Super Bowl. And every year for an even longer stretch, Chris Berman would predict that the 49ers and Bills would meet in that year’s Super Bowl.

The teams never met in a Super Bowl, but it was a historic performance by San Francisco when the teams met on Sunday. The 49ers passed for 310 yards and rushed for 311 yards, becoming the first team in NFL history to top the 300-yard mark both through the air and on the ground.

In fact, before this season, only 46 teams had ever hit 250 rushing yards and passing yards in the same game, with the 2010 Eagles being the most recent team. The first two teams to set this mark were in the AAFC, and it wasn’t until 1948 that an NFL team crossed those thresholds. Three times in the playoffs, including one Super Bowl, a team gained at least 250 yards passing and rushing.

The table below lists all such games, and has linkable boxscores in the “Date” column.

{ 1 comment }

NCAA SRS Ratings: Week 6

We're 1 spot away from being in Chase's top six!

For the last couple of weeks, I noted that the SEC East was inching its way back towards respectability. In 2009, the West went 12-7 against the East; in 2010, the dominance was much more pronounced, with the West going 16-3, and Ole Miss being responsible for two of the three losses. Last year, the SEC West went 13-6 against the East, with Ole Miss and MSU being responsible for five of the losses. In all three years, the West was the clear dominant division: any uncertainly was eliminated in the SEC Championship Game, as the West won the three games by a combined 130-40.

But with Florida’s victory over LSU this weekend, the plate tectonics in the Southeastern Conference appear to have shifted. The Gators also beat Texas A&M, leaving the East Division 2-1 so far this season against the mighty West, with Mississippi State’s win over Kentucky being the West’s first interdivision win of 2012. But more importantly, according to the SRS, three of the best five teams in the conference reside in the East, along with two of the three highest ranked teams in all the polls. The two worst teams have been Auburn and Arkansas, both West members. Alabama may be the class of the conference, but we may not find out much more until the SEC Championship Game. In 2012, the Crimson Tide only face Tennessee and Missouri from the East, which may make it difficult to judge the conference’s elite until December. Florida already won both of its two interdivision games, leaving South Carolina’s trip to LSU being perhaps the last referendum on the top of the two divisions until the championship game (USC’s other East opponent is Arkansas).

Anyway, here are the SRS Ratings after six weeks. As always, thanks to Dr. Peter Wolfe.
[continue reading…]

{ 2 comments }

Yet another thought experiment

I’ve decided to add a new category to Football Perspective, as this thought experiment idea is here to stay. Here’s today’s thought experiment:

It’s 4th and 1, at the 50-yard line, with 1:30 to go. You’re the defensive coordinator and your team is trailing by 1 and out of timeouts. The other team looks like they’re going to go for it — they had 3 WRs, 1 TE and 1 RB in the huddle, and now all 5 players are split out wide (with 3 on the wide side of the field). The quarterback is under center, not in shotgun.

What type of players do you want on the field (i.e., number of defensive tackles, ends, inside/outside linebackers, corners/safeties)?

Assume as DC you can control the minds of each of your defensive plays. How do you align them pre-snap? What do you coach your players to do?

{ 4 comments }

In August, I wrote this article examining Drew Brees’ pursuit of Johnny Unitas’ streak of 47 consecutive games with a touchdown pass. Brees tied the record last weekend and is set to break the tie Sunday night. If you missed this article the first time, or just wanted to re-read as we approach the record-setting day, here’s the link.

{ 0 comments }

The shutout effect

This picture is unrelated to the content of this post.

Do teams play better after getting shut out? There is a certain added level of embarrassment when a team fails to score in a game. If you lose 34-3, you spend the week hearing about how terribly you played. If you lose 34-0, you spend the week hear about how terribly you played and how you couldn’t even score!

This made me wonder: do teams perform better in the week after a shutout than after a similar blowout? Perhaps the added embarrassment encourages a team to go back to the drawing board and really focus on what went wrong. That was just a theory, though. So I looked at all games since 1960 where a team (a) lost by at least 20 points and (b) had scored 0 points entering the 4th quarter. There were 593 such games, and the team was shutout in 379 times.

Sixty-five of those games of those games occurred in a team’s last game of the season, so I eliminated those games. Of the remaining 528 games, how did the teams that failed to score fare the next week relative to the non-shutout teams? The table below lists the points scored and allowed by each group of teams, along with how many points they scored and allowed in their next game (and their winning percentage in that game):

As you can see, there seems to be nothing to the shutout effect. Teams score and win at roughly the same rates regardless of whether they get a meaningless late score or not. So why am I making this a post? Because a “no effect” answer is often just as meaningful as any other type of answer.

{ 3 comments }

A couple of weeks ago, I wrote about a method of calculating a team’s win probability at the end of any given quarter, given the pregame Vegas line and the score margin of the game after the quarter in question. Today, I want to break down those numbers in more detail by looking at which teams (and quarterbacks) added the most Win Probability in each stage of the game.

To compute Win Probability Added (WPA) for the purposes of this post, you look at how much the team’s chances of winning changed from one quarter to the next. For instance, here’s how I’d deconstruct Monday night’s game for the winning Bears:

WPA_loc and WPA_vegas are the two components that make up the pregame win expectancy. Chicago was on the road here, which typically deducts about 8% from a team’s base 50% WP right from the get-go (or roughly 2.5-3.0 points of spread), and on top of that they were 3.5-point underdogs, which put their pregame WP another 2.1% lower than you’d expect from an evenly-matched road team. All told, before the opening kickoff, they were already down about 10% in terms of WP.

Then both teams had a scoreless first quarter, which added 1.3% to Chicago’s total under the WPA_1st banner. This happened because, even though they were still tied, there was less time remaining in the game during which Dallas could exert their theoretical talent advantage (the variance of the future was likely to be higher, which always favors the underdog).

Chicago took a 10-7 lead in the 2nd quarter, which tacked on 13.7% of WP, as seen under WPA_2nd. By this point, they had erased their early 10% deficit and were actually favored to win with a WP of 55.1%. A 14-3 3rd period was the killer, though, adding 42% of WP in the WPA_3rd column. Going into the final quarter with a 24-10 lead, the Bears had a 97.1% chance of winning; when they didn’t relinquish that lead, the remaining 2.9% of WP were added under WPA_4th, since the game was over.

And as is the case with every winning team ever, their WPA_tot for the game was +0.500.

See how it works? By using WPA in this manner, we can detect when in the course of the game a team adds or subtracts the most from its chances of victory. We can also add these WPA numbers up across games at the season level, or even for entire careers.

[continue reading…]

{ 13 comments }

Week 4 Power Rankings

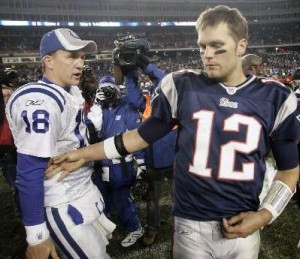
Brady and Manning square off for the 13th time this weekend.

Just like last week, my #1 and #32 teams remain in the same slots. The Houston Texans continue to dominate, while the Browns are still looking for their first win. Suddenly it all makes sense, until next week.

As a reminder, after the team name column, I have listed each team’s record in the second column and the number of wins I’m projecting each team to finish the season with in column 3. The fourth column – PWIN – shows how many wins I projected for that team last week, and the difference column represents how many wins I added or subtracted this week. The “RSOS” column stands for the remaining SOS for the team, based on the number of projected wins I’m giving to each of their opponents. The “RHG” column stands for remaining home games. Lastly, my witty and insightful comments remain in the final column.

The Denver-New England game is easily the most anticipated matchup of the weekend, but it is also one of the most important. Both teams are in weak divisions, which means their main goal should really be beating out the other team and the AFC North winner for the conference’s second bye. In that vein, the loser of this matchup is going to have an uphill road to get a bye. And obviously in the event that these teams meet in the playoffs, Sunday’s game could determine home field.


{ 1 comment }

NYT Fifth Down: Post-week 4

This week at the New York Times Fifth Down Blog I selected my quarter-season MVP:

If The Associated Press named a most valuable player of the first quarter of the season, Atlanta Falcons quarterback Matt Ryan would be the likely selection. He is leading an offense that has been as good as any in the N.F.L. The Falcons lead the N.F.C. in points scored and have the conference’s best record (4-0) despite a less than stellar defense, thanks in large part to Ryan’s league-leading 112.1 passer rating. He has thrown 11 touchdowns and just 2 interceptions; no other quarterback has a positive differential of more than six in contrasting those categories. Ryan is averaging 7.9 yards per attempt as part of a ruthlessly efficient Atlanta offense.

On Sunday, the Falcons trailed, 28-27, with the ball at their 1-yard line and only 59 seconds remaining. On the first play, Ryan faked a handoff and threw a deep pass along the left sideline to Roddy White for 59 yards. A few plays later, Matt Bryant kicked the game-winning 40-yard field goal. According to Scott Kacsmar, a statistician who goes by Captain Comeback, that was Ryan’s third game-winning drive that started with less than one minute remaining, trailing only Dan Marino and Mark Sanchez (four each) for most one-minute game-winning drives since 1981.

But don’t give Ryan all the credit: he’s playing with one of the best supporting casts in the league. Roddy White has been an elite wide receiver for years but has not received the level of national attention befitting that status. With 6,835 receiving yards, White leads the N.F.L. in that statistic since 2007. Over that span, only Wes Welker has more receptions. White also has the most receiving yards since 2008 and since 2009. With 413 receiving yards already in 2012, White looks ready to have another monster season.

As good as White is, many view him as only the Falcons’ second best wide receiver. Second-year star Julio Jones is one of the game’s best young players, although his numbers have yet to reflect his ability so far in 2012. After a 108-yard, 2-touchdown performance in Week 1, Jones has had diminished production, in part because of a hand injury, but he is still giving defensive coordinators nightmares. Jones drew a pass interference flag on the Falcons’ final drive and nearly connected on a deep pass from Ryan earlier in the game; significant statistical production won’t be far behind.

Then there’s Tony Gonzalez, the future Hall of Fame tight end. He leads all tight ends in 2012 in receptions and trails only Philadelphia’s Brent Celek in receiving yards. Earlier this year, Gonzalez moved into second place in N.F.L. history in career receptions behind Jerry Rice. If he can get to 93 receptions, he will set the record for receptions by a player 36 years or older (held, of course, by Rice). Gonzalez already has more receptions than any tight end at his age, a mark he set in Week 3.

Gonzalez isn’t the only geezer (in N.F.L. years) producing for Atlanta. Many were ready to write off running back Michael Turner, but the 30-year-old back rushed 13 times for 103 yards against the Panthers. But that’s just the side story: the 10-year veteran caught a short pass and turned it into a 60-yard touchdown, the first receiving touchdown of his career. Entering the game, Turner trailed only George Rogers, Gerald Riggs and Earl Campbell in career carries and career yards from scrimmage by a player with zero receiving touchdowns.

You can read the rest of the article here.

{ 0 comments }

Yesterday, I took a comprehensive look at offensive fumbles and the associated fumble rates. Let me first say that going through eleven years of play-by-play logs is an impossible one-man task, which means you need to write a lot of code to sort your way through the hundreds of thousands of plays.

Its pretty easy to do that for offensive fumbles; coding is not nearly as effective or efficient when it comes to unique fumbles. I’ve done my best to be both exhaustive and accurate, but am not particularly confident that I met either such goal. I’d love to hear from others who have studied fumbles by defensive and special teams players and compare notes — just drop a note in the comments or shoot me an e-mail. With that said….

Defensive Fumbles

According to my database, there were 115 interceptions where the defender fumbled on the ensuing return. The passing team wound up get the ball back 52 times (45.2%). The most memorable of these was when Marlon McCree intercepted a Tom Brady pass in a playoff game following the 2006 season; on the return, Troy Brown forced a fumble and Reche Caldwell recovered, keeping New England’s hopes alive. This, of course, means that 63 times (54.8%) the intercepting and fumbling team would retain possession after the turnover.

As you might imagine, trying to locate plays where a team recovered a fumble and then the recovering player fumbled is not one that was particularly easy to identify. Without spending an inordinate amount of time on this, I did look at all rushing and passing plays that appeared to have two fumbles. I surely missed some, but I found 37 examples. Only nine times (24%) did the team on offense get the ball back.

Kickoffs

If anyone could point me to a study on fumbles on special teams plays, I’d appreciate it. Parsing through the data was not easy, so I’m not going to pretend that I am 100% confident that I did this correctly. Note that I excluded all onside kicks and kickoffs where the receiving team was executing laterals.

There were 940 kickoffs that resulted in fumbles or muffs. The kickoff team recovered the ball 305 times, while the receiving team retained possession 635 times (67.6%). There were a total of 30,230 kickoffs, which means that roughly 3.1% of all kickoffs resulted in fumbles, and roughly 1% of the time the kicking team ended up gaining possession.

Punt returns

There were 30,777 punts in my database, and 1,085 punts where the returning team muffed or fumbled the punt return. Usually, the punt returning team would keep the ball — 731 times or 67.4% of the time to be exact. That leaves 354 times where the punting team would retain possession, or on 1.15% of all punts.

Punts/Kicks

My database shows only 45 field goal attempts (or possibly fakes) that were nixed due to fumbles (out of over 11,000 attempts; obviously not all field goal attempts that went awry were labeled as fumbles in the game recaps.). It’s true that 35 times the kicking team recovered the fumble, but it was always a short-lived victory. In each of those cases, the kicking team did not gain enough yards to pick up a first down. In fact, Tony Romo had the best single play following a fumbled field goal attempt, by rushing for 7 yards. And people say he’s not clutch! The other 22% of the time the defensive team recovered, and three times they scored a touchdown on that play.

My database shows only 35 fumbles by punters before punting — again, no doubt that some punts have been excluded from the sample. In any event, 70% of the time the punter or punting team recovered. Again, the important thing here is that regardless of who recovers, it would be extremely rare for the punting team to actually get a first down (only three in my database).

Note: There is a small miscellaneous category — things like fumbles on onside kicks, fumbles following blocked field goals, fumbles on laterals on the last play of the game, — that my brain begged itself to ignore.

{ 7 comments }

The definitive analysis of offensive fumbles

This post is intended to be more exhaustive than groundbreaking, more like an encyclopedia than a fiction novel. If you’re at this website, you’re probably into advanced statistics, and if you’re into advanced stats, you probably know that turnover rates are generally pretty inconsistent from time period to time period. But I wanted to get more granular than that, and to break down turnover rates into three specific components. The all-encompassing word ‘turnovers’ in itself is not helpful, because there are three types of turnovers:

— Interceptions
— Offensive fumbles
— Special teams/defensive fumbles

The word turnovers makes sense from an explanatory standpoint. If a team has three turnovers, it doesn’t matter all that much how they occurred. An interception returned for a touchdown is the same as a fumble returned for a touchdown. But when it comes to analyzing turnovers from a predictive standpoint, the word itself only serves to confuse. I’m going to put interceptions to the side for now — I wrote about them last Monday — and today focus on offensive fumbles.

The six types of offensive fumbles

We’ve known for awhile that fumbles are pretty random for year to year, particularly on the defensive side of the ball (see this article by Jim Armstrong showing that forcing fumbles was almost entirely a function of luck and not skill). Even the word “fumbles” is too broad from a predictive standpoint, as there are many different types of fumbles. On offense alone, I grouped all fumbles from 2000 to 2011 into one of six types:

— Quarterback/center exchange fumbles

— Quarterback sack fumbles

— Quarterback fumbles on running plays

— Quarterback fumbles on non-sack plays behind the line of scrimmage (this could be on bad handoffs, simply dropping the ball, etc.)

— Fumbles on running plays (non-QB)

— Fumbles following completed passes

In addition, there are four possibilities following a fumble. The ball could harmless go out of bounds [1]Technically, it could go harmfully go out of bounds, too. There were a few examples where the ball went out of bounds for a safety, or a team driving for a touchdown fumbled out of the other … Continue reading, it could be recovered by the fumbler, it could be recovered by one of the other ten players on offense, or it could be recovered by the defense. And as you might expect, the recovery rates are different depending on the type of fumble. I’ve done all the heavy lifting for you. The graph below shows the recovery rates associated with each of the six different types of offensive fumbles. The stacked columns are color coded: yellow represents fumbles that go out of bounds, blue is for fumbles recovered by the fumbler (“RBF”), blue is for plays where a different offensive player recovered, and red shows when the defense gained possession.

I like to see things in graphs, but for the more numbers-oriented folks out there:

As an example, look at the second to last row which shows fumbles following completed pass plays. This tells us that 21% of all offensive fumbles come on these types of plays. A good chunk of them go out of bounds (17%), and one in ten are recovered by the fumbler. The far right column tells us that of the remaining fumbles that are recovered but not by the fumbler — Fumbles In Play — 82% of them are recovered by the defense.

Again, this isn’t meant to be “shocking” as it is to be informative. The goal here is to understand how fumbles generally operate to better understand how likely specific events are to be predictive. A receiver fumbling downfield who then has a teammate recover the fumble is a lot luckier than a quarterback who fumbles the snap and then recovers it. To me, knowing exactly how much luckier is valuable information.

For example, there were 5 offensive fumbles in the Chargers-Chiefs game yesterday. We can analyze them using the above info:

  • In the first quarter, Jamaal Charles fumbled on a run, and San Diego’s Shaun Phillips recovered. So San Diego recovered 1.0 fumbles, instead of the 0.60 fumbles usually recovered by the defense on a rushing play.
  • Early in the second quarter, Phillips sacked Matt Cassel, but Cassel recovered. The quarterback only recovers the fumble on 14% of sacks, so this was atypical of most fumbles. The defense recovers the fumble 51% of the time, and San Diego recovered 0.0 fumbles instead of the expected 0.51 fumbles.
  • On Kansas City’s next drive, Charles fumbled again on a run, and Corey Liuget recovered. Again, San Diego gets credit for 1.0 fumbles instead of the expected 0.60 fumbles. On these three Kansas City fumbles, San Diego recovered 2.0 fumbles when we would expect them to recover 1.71 fumbles in these situations. So we could argue that they were lucky to recover an extra 0.29 fumbles.
  • On the next play, Philip Rivers had an aborted snap and fumbled out of bounds (assuming the game book is accurate) — a very rare play (2.6% of the time). But in general, we would expect San Diego to retain possession on 76% of aborted snaps, so they are +0.24 fumbles on this play, and +0.53 on the day.
  • The last fumble came in the fourth quarter, when Shaun Draughn fumbled and Atari Bigby of the Chargers recovered. Again, this is another +0.40 fumble situation for the Chargers.

In total, San Diego recovered four of the five offensive fumbles on the day, and that represents 0.93 more fumbles than we would expect. That’s an example of how I envision people using the above table.

References

References
1 Technically, it could go harmfully go out of bounds, too. There were a few examples where the ball went out of bounds for a safety, or a team driving for a touchdown fumbled out of the other team’s end zone for a touchback.
{ 16 comments }
Next Posts