≡ Menu

Larry Fitzgerald, innocent bystander

In the preseason, I wrote a post showing what percentage of each receiver’s receiving yards came from each of their quarterbacks. Using that same methodology, here’s an updated look at the quarterbacks responsible for Larry Fitzgerald’s career numbers entering week 14. The second receiving yards column (and second games column) shows the percentage of Fitzgerald’s receiving yards came (and games) that came from that quarterback: [1]Note: To determine quarterback games, I gave each quarterback credit for his number of pass attempts in each game divided by the team’s total number of attempts in the game.

QBRec YdsRec YdGGYd/G
Kurt Warner457244%53.539%85.5
John Skelton125812%15.611%80.6
Josh McCown121512%19.715%61.6
Kevin Kolb100810%12.99%78.4
Matt Leinart99810%14.110%70.6
Derek Anderson6096%9.57%64.2
Max Hall1521%2.12%71.7
Shaun King1121%1.81%61.4
Richard Bartel991%1.11%90.3
Tim Rattay871%0.91%97.1
Ryan Lindley621%2.72%22.7
John Navarre611%1.61%38.7

Fitzgerald ran away when he heard who his quarterback was going to be.

On Sunday, the Cardinals went into Seattle and played the type of game that leads people to wonder if a college football team could beat the worst NFL team. Coming into the game, Larry Fitzgerald had recorded a reception in 129 consecutive games, the second longest streak in football behind Tony Gonzalez. Against the Seahawks, Fitzgerald was kept off the stat sheet until seven minutes remained, and, when trailing 51-0, Ryan Lindley completed a two-yard pass to Fitzgerald to keep the streak alive. Fitzgerald, perhaps the best wide receiver of his era, has now recorded one catch in three of his last four games.

In 13 games this season, Fitzgerald has just 652 yards, an average of 50.1 yards per game. Entering week 14, Fitzgerald ranked 40th in receiving yards, and we can safely assume he is no longer ranked in the top forty.

How rare is it for an elite receiver to have such a miserable season at the age of 29? First we need to define what ‘elite’ means without asking ESPN. I came up with a quick and dirty system where I gave a receiver credit for his receiving yards over the Nth ranked receiver, where N represents the number of teams in the league in that season. For example, in 2011 Calvin Johnson receives credit for 794 yards, since he gained 1,681 yards and the 32nd receiver gained 887 yards. If you gained fewer yards than the Nth best receiver, you get zero yards for that season. The table below shows the career leaders using this formula (excluding 2012), and the column on the right pro-rates the data for non-16-game seasons.
[continue reading…]

References

References
1 Note: To determine quarterback games, I gave each quarterback credit for his number of pass attempts in each game divided by the team’s total number of attempts in the game.
{ 7 comments }

Checkdowns: Some Bo Jackson stats

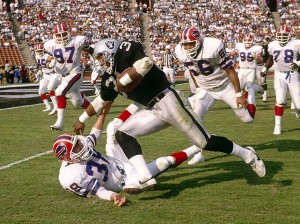
The Bills get to know Bo.

Tonight ESPN aired You Don’t Know Bo, another excellent documentary in its 30 for 30 series. It’s often said that Bo Jackson’s greatness can’t be captured by statistics. While that’s undoubtedly true, there are still some ways to use Jackson’s numbers to give a glimpse into the type of player he was. A few years ago, Jason Lisk talked about Bo in this podcast and noted that Bo had the longest rush in the NFL in three of the four seasons he played. Jackson and O.J. Simpson remain the only two players to record the league’s longest rush in three different NFL seasons.

There are other ways to capture what Bo did in his brief career. Because he was busy being a baseball player, Bo missed the first third of the season each year. If we look at the data starting in week 7, from 1988 to 1990, Bo compares pretty favorably to the elite running backs of his day. Over that span he ranked third in rushing yards while averaging over five yards per carry:

Rank Player From To Tm G Att Yds Y/A TD
1 Eric Dickerson* 1988 1990 CLT 30 606 2536 4.18 19
2 Thurman Thomas* 1988 1990 BUF 30 519 2221 4.28 16
3 Bo Jackson 1988 1990 RAI 30 423 2143 5.07 11
4 James Brooks 1988 1990 CIN 30 383 2082 5.44 16
5 John Stephens 1988 1990 NWE 31 523 1989 3.80 10
6 Herschel Walker 1988 1990 TOT 30 494 1985 4.02 13
7 Barry Sanders* 1989 1990 DET 20 370 1968 5.32 19
8 Neal Anderson 1988 1990 CHI 29 455 1951 4.29 14
9 Roger Craig 1988 1990 SFO 27 445 1874 4.21 12
10 Earnest Byner 1988 1990 TOT 31 438 1697 3.87 14

[continue reading…]

{ 9 comments }

Week 15 College Football SRS Ratings

I didn’t publish my college football SRS ratings last week, but with the conclusion of yesterday’s Army-Navy game, the college football regular season is over. But before we turn our attention to the Bowls, here is a look at the final regular season SRS ratings.

RkTeamConfConf RkGMOVSOSSRSREC
1OregonP1211223.741.465.111-1
2AlabamaSEC11322.841.364.112-1
3Texas A&MSEC21218.242.460.610-2
4Kansas StB1211216.543.259.711-1
5FloridaSEC31213.144.457.511-1
6Notre DameIND--1214.742.857.512-0
7GeorgiaSEC41315.841.557.311-2
8OklahomaB1221213.543.757.310-2
9StanfordP122131045.455.411-2
10South CarolinaSEC51212.541.954.410-2
11LSUSEC61211.442.854.110-2
12Oregon StP123129.64453.69-3
13Oklahoma StB1231211.142.553.67-5
14Southern CalP124127.944.552.47-5
15Florida StACC11319.332.65211-2
16Ohio StateB1011213.738.351.912-0
17BaylorB124125.145.9517-5
18TexasB125126.144.550.68-4
19WisconsinB102139.940.750.68-5
20ClemsonACC21215.135.550.610-2
21Arizona StP125129.241.350.57-5
22UCLAP126137.942.650.59-4
23Utah StWAC11217.732.149.810-2
24MichiganB10312940.349.28-4
25Fresno StMWC1121633.249.29-3
26Brigham YoungIND--1211.736.147.87-5
27ArizonaP127122.444.6477-5
28NebraskaB104137.339.546.910-3
29Texas TechB126124.442.246.67-5
30TCUB127124.941.446.47-5
31Penn StateB105128.737.546.28-4
32San José StWAC21212.733.446.110-2
33VanderbiltSEC7129.336.645.98-4
34West VirginiaB128122.343.545.87-5
35Boise StMWC21213.831.845.710-2
36Northern IllinoisMAC11318.52745.512-1
37NorthwesternB106127.637.4459-3
38Iowa StB129120.844.144.96-6
39MississippiSEC8121.243.744.96-6
40Mississippi StSEC912638.344.38-4
41Michigan StB10712341.344.36-6
42WashingtonP128120.543.644.17-5
43CincinnatiBgE11212.331.243.59-3
44MissouriSEC1012-3.346.743.45-7
45Louisiana TechWAC31211.831.343.19-3
46Central FloridaCUS11311.431.542.99-4
47San Diego StMWC3129.832.642.49-3
48North CarolinaACC3121131.342.48-4
49UtahP1291204241.95-7
50SyracuseBgE2123.53841.57-5
51TulsaCUS2139.33241.310-3
52Arkansas StSun1129.731.441.19-3
53Miami FLACC4121.639.340.97-5
54TennesseeSEC1112-0.440.740.45-7
55PittsburghBgE3126.333.840.16-6
56LouisvilleBgE4127.132.94010-2
57Georgia TechACC5132.936.939.86-7
58RutgersBgE5128.131.639.79-3
59Louisiana-MonroeSun2127.232.239.48-4
60Louisiana-LafayetteSun3127.33239.38-4
61Kent StMAC21310.129.239.311-2
62PurdueB10812038.438.36-6
63ArkansasSEC1212-5.944.138.24-8
64North Carolina StACC6123.234.537.77-5
65CaliforniaP121012-9.146.437.33-9
66Virginia TechACC7120.836.437.26-6
67Ball StMAC3124.931.836.79-3
68IowaB10912-440.536.54-8
69ToledoMAC4125.530.936.49-3
70SMUCUS312234.1366-6
71MinnesotaB101012-2.737.534.86-6
72NevadaMWC4123.331.234.47-5
73Western KentuckySun4122.731.3347-5
74NavyIND--122.731.233.98-4
75AuburnSEC1312-9.643.333.63-9
76DukeACC812-336.233.36-6
77Bowling GreenMAC5127.625.533.18-4
78IndianaB101112-4.337.3334-8
79Middle Tennessee StSun5120.531.832.28-4
80TroySun612-0.332.3325-7
81East CarolinaCUS4121.430.531.98-4
82Washington StP121112-11.843.531.73-9
83VirginiaACC912-6.137.331.24-8
84KansasB121012-16.147.131.11-11
85South FloridaBgE612-737.9313-9
86KentuckySEC1412-12.443.3312-10
87RiceCUS5120.230.630.76-6
88ConnecticutBgE712-2.532.830.35-7
89Ohio U.MAC6125.224.729.98-4
90Air ForceMWC5120.429.429.86-6
91MarylandACC1012-6.435.929.44-8
92TempleBgE811-6.735.528.84-7
93Boston CollegeACC1112-9.438.228.82-10
94HoustonCUS612-3.53228.55-7
95MarshallCUS712-2.430.327.95-7
96Texas St-San MarcosWAC412-431.927.94-8
97WyomingMWC612-6.834.427.64-8
98Western MichiganMAC712-1.829.227.44-8
99Colorado StMWC712-8.635.526.94-8
100UTEPCUS812-7.834.426.63-9
101Florida Int'lSun712-6.833.326.53-9
102Florida AtlanticSun812-8.735.126.43-9
103North TexasSun912-6.332.726.44-8
104New MexicoMWC813-4.830.525.64-9
105Wake ForestACC1212-11.537.125.65-7
106Central MichiganMAC812-3.528.625.16-6
107IllinoisB101212-14.739.324.62-10
108BuffaloMAC912-731.124.14-8
109MemphisCUS912-629.923.94-8
110Texas-San AntonioWAC5122.62123.58-4
111Alabama-BirminghamCUS1012-8.63223.43-9
112UNLVMWC913-10.633.823.22-11
113Miami OHMAC1012-9.832.322.54-8
114ColoradoP121212-22.944.621.81-11
115Hawai`iMWC1012-12.333.921.63-9
116ArmyIND--12-11.633.121.52-10
117South AlabamaSun1013-10.830.519.62-11
118AkronMAC1112-1029.419.41-11
119Eastern MichiganMAC1212-14.63419.42-10
120TulaneCUS1112-15.533.818.32-10
121Southern MissCUS1212-17.834.216.40-12
122IdahoWAC612-21.636.715.11-11
123New Mexico StWAC712-18.532.513.91-11
124MassachusettsMAC1312-22.332.19.91-11

I’ve also updated the NCAA Games page, which displays every game in major college football this season.

The table below lists the Bowl matchups along with some SRS data squeezed in: the last four columns show the SRS rating of the favorite and the underdog, along with the difference between the two ratings (i.e., a projected point spread) and the average of the two ratings (essentially a ranking of how good the game is).
[continue reading…]

{ 7 comments }

Checkdowns: Most Game Winning Drives in First 12 games

Scott Kacsmar, friend of Football Perspective and the leading writer on quarterback comebacks, noted that Andrew Luck has 5 game-winning drives in his first 12 games. Where does that rank historically?

To be clear, game-winning drives are not an official statistic, and while Kacsmar has gone through thousands of games to record data on the subject, we can’t confirm that the below list in 100% complete. With that disclaimer out of the way, the table below displays all quarterbacks with at least 3 game-winning drives in their first 12 NFL games:

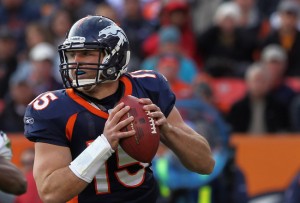
Tim Tebow led a game-winning drive in half of his first twelve starts.

If we look just at quarterbacks in their first 12 starts, well, a different name vaults to the top of the list. Tim Tebow launched a phenomenon known as Tebow-mania last year, thanks to his dramatic comebacks seemingly every week last November and December.

Luck’s career trajectory looks to be on a much better path than Tebow, Jay Schroeder or John Skelton, but hey, I don’t make the trivia, I just present it.

The table below shows how many game-winning drives were led by quarterbacks in their first 12 starts. Thanks to Scott Kacsmar and Pro-Football-Reference.com for the data.
[continue reading…]

{ 6 comments }

Every hand in the Jets passing game is to blame

Not Don Coryell.

It’s a special edition of Saturday rant day at Football Perspective.

I’m no Mark Sanchez apologist. But that doesn’t mean he’s the only one to blame for the Jets’ passing game struggles.

The Supporting Cast

Jeremy Kerley, Dustin Keller, Chaz Schilens, Stephen Hill, and Jeff Cumberland are the team’s leading receivers. Clyde Gates has started two games at wide receiver. Kerley would be a great #3 receiver, but he’s the Jets #1. Schillens and Gates are best left as fifth receivers, while Stephen Hill is incredibly raw and has struggled most of the year. Keller would be a good tight end on a good passing offense, but is overmatched as the team’s #2 target. I don’t think anyone would disagree that the Jets’ receivers (including stone-hands Shonn Greene) rank in the bottom five of the league.

Mike Tannenbaum

Tannenbaum has come under heavy criticism from Jets fans of late. While I think much of that is probably unfair, there are several areas to point the finger at Tannenbaum — starting with drafting Sanchez in the first place. The Jets general manager listens to eternal optimist Ryan too much when it comes to personnel decisions, which led the Jets to start Wayne Hunter at right tackle last year and enter the pre-season with him, somehow, still entrenched at the spot. The Vlad Ducasse pick has been a bust, leaving Matt Slauson to cover at left guard (you know, when he’s not being rotated out of the game). Trades for Braylon Edwards and Santonio Holmes yielded immediate dividends, but have only added to the disruption in the locker room without helping the 2012 version of the team. Sanchez is playing with one of the worst supporting casts in the league, so the man who picks the talent certainly bears some of the blame.

Rex Ryan

There are very few head coaches who are excellent on both sides of the ball, but Rex Ryan is one of the most specialized head coaches in the NFL. He’s a defensive mastermind — no doubt about that — but he’s as helpless on offense as he is strong on defense. He vowed this year to get more involved in the offense, which should start sending red flags to begin with since 2012 is his fourth season as head coach of the team. To the extent that he has been more hands on in 2012, the results aren’t any better.

Perhaps Ryan is the mirror image of a Gary Kubiak, who took awhile to find the right man to run the other half of his team. But from the standpoint of developing a quarterback, Ryan may even be counterproductive. The red light-yellow light-green light system he gave Sanchez in his rookie season was Ryan’s first attempt to right the ship and a sign of what the coach expects out of the quarterback position. The bottom line is Ryan is focused on playing good defense and running the ball, and as long as his quarterback doesn’t mess up, he thinks his team will win. That’s not the ideal environment for a young quarterback to blossom in, and we learned exactly what Rex thinks about his quarterback when this off-season he chose to hire as his offensive coordinator…

Tony Sparano (hat tip, Brian Schottenheimer)
[continue reading…]

{ 3 comments }

So you're telling me they were 1-15 last year?

An old friend of mine was always mildly irked at the praise thrown at Bill Parcells for turning around moribund franchises. In reality, making a team with a terrible record respectable isn’t all that challenging. Where Parcells added value was in making his good teams great, not in making terrible teams mediocre.

In 1992, one year B.P., the New England Patriots were 2-14, in part thanks to a 1-5 record in one-score games. Throw in some regression to the mean and the first pick in every round of the ’93 draft, and going 5-11 in 1993 wasn’t so much of an accomplishment as it was pre-ordained.

In 1996, one year B.P., the Jets went 1-15. New York was a horrific 0-7 in one-score games. Throw in the #1 pick in every round, and they were an attractive target. Parcells did do a masterful job cleaning up the mess left by Rich Kotite, but getting them to 9-7 looked very impressive in large part thanks to the poor fortunes of the team the prior year.

The Big Tuna again went after the low-hanging fruit again when he took over as the Executive Vice President of Football Operations in Miami (it is here my old friend would get particularly annoyed, noting that Parcells found a way to have his cake and eat it too. If the Dolphins succeeded, Parcells would have “done it again.” Had they failed, well, he wasn’t the coach.) He took over a 1-15 team that was bad but not 1-15 bad; they had faced one of the harder schedules in the league and gone 1-6 in close games. Enter Jake Long, Chad Pennington, and the Wildcat, and the Dolphins went 11-5. Parcells did it again!

In any event, that’s just background. The 2013 Panthers are the real topic today — and they are the lowest hanging fruit any potential coach has seen in decades. Consider:

  • The Panthers are currently 3-9, and little is expected of them going forward. They are now just 9-19 in the Cam Newton era.
  • Despite that, Carolina ranks 4th in Brian Burke’s Advanced NFL Stats efficiency ratings. Now maybe they aren’t the 4th best team in the league, but Brian’s system is purely predictive and minimizes events that shape our views but are unlikely to impact future records. I have no doubt that they’re closer to the 4th best team in the league than the 4th worst, which is where they are by record.
  • Football Outsiders ranks Carolina 18th — which, by the way, still means they’re much better than their record — but even that is misleading. Schatz ranks Carolina 32nd in special teams — a unit that Burke ignores — but instead has them 15th in offensive DVOA and 14th in defensive DVOA. That means excluding special teams the Panthers are above average, and special teams performance is notoriously fickle.
  • So why are the Panthers 3-9? Carolina is currently 0-7 in one-score games.

There’s an even simpler way to show how the Panthers are massively underachieving this year. Net yards per attempt isn’t the only stat in the world, but it’s one of the most important indicators of an offense’s effectiveness. Net yards per attempt is just as important on defense; NY/A differential, the difference between how many net yards you gain per offensive attempt and how many you allow per defensive attempt, is a simple shorthand to highlight the best in the league. Here are the results through 13 weeks (i.e., not counting last night’s game):
[continue reading…]

{ 11 comments }

Running back success rate

Grading running backs can be tricky; rushing yards tell much of the story but remain a function of opportunity (itself an indicator of talent). Yards per carry sounds nice but often is more misleading than revealing. Last year at Smartfootball.com I analyzed team rushing games using rush success rate, and I will do the same today. Success rate has been around for awhile – The Hidden Game of Football wrote about it in the late ’80s and Football Outsiders has been tracking it for close to a decade. Everyone has their own unique definition, it seems; here is mine.

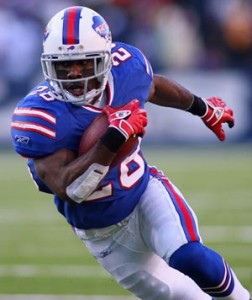
C.J. Spiller is a success.

  • I started with every play from scrimmage where a running back was credited with a carry. I then removed all instances of 3rd or 4th down carries where the back needed to gain more than 5 yards for a first down, since the primary goal in these situations usually isn’t to get the first down. However, on the rare occasions where a running back did convert for the first down, those plays were kept in the data set. This has only happened 20 times this season.
  • On 3rd and 4th down, a success is a rush that gains a first down (or touchdown). A failure is every carry that does not result in a first down.
  • On 2nd down, a success is achieved when the player gains at least 50% of the yards needed for the first down. This means that 2nd-and-8 runs are failures unless they pick up 4 yards; on 2nd-and-7, the running back must also gain at least 4 yards. A rush for one yard on 2nd-and-3 is a failure, and so on.
  • On 1st down, a running back is credited with a successful carry if he gains at least 40% of the yards needed; therefore, four yards are required on 1st-and-10 before the running back is given credit. On 1st and goal from the 5, a two-yard gain would be considered a success.

The league average success rate by these rules is 49.8%. The table below lists all running backs with at least 50 carries, along with their number of rushes (which excludes the excluded carries), number of successful runs, and their success rate. The table is sorted by the far right column, which shows how many successes over 50% of their runs the player had. In the event of a tie, the player with more carries was ranked higher.
[continue reading…]

{ 19 comments }

Week 13 Power Rankings

Unlike Alex Smith, Colin Kaepernick's team won't kiss its sister.

We’re 75% of the way through the regular season. We know the Patriots, Broncos, and Texans are elite teams in the AFC, the Ravens and Colts aren’t as good as their gaudy records, and the Bengals and Steelers will consistently be inconsistent. In the NFC, the Giants remain the benchmark for consistent inconsistency. But if December plays out as another Groundhog’s Day for Daniel Snyder and Jerry Jones, the NFC East will again go to New York. The Falcons are going to grab the #1 seed and the NFC North will likely come down to the winner of the Green Bay-Chicago matchup in week 15. The last wildcard is up for grabs — the first is reserved for the NFC North runner-up — but unfortunately the likely prize is just a road game against one of the last two Super Bowl champions.

So let’s take a moment and look at how the 49ers tie against the Rams could impact playoff seeding. In retrospect, that tie was no better than a loss for San Francisco. As an initial matter, the team is battling Seattle for the NFC West crown. San Francisco plays in Seattle in week 16; if the Seahawks win, they have a legitimate shot at the division. Right now they’re 1.5 games behind the 49ers, and the rest of the Seahawks schedule (ARI, @BUF, STL) is manageable; meanwhile, San Francisco also has to go to New England. If the Seahawks run the table and the Patriots beat the 49ers, the Seahawks win the NFC West.

Had the 49ers defeated the Rams, even losing to Seattle and New England in the last two weeks wouldn’t cost them the division. That’s because Seattle already lost in Arizona, St. Louis, and San Francisco, so the 49ers would have won the tiebreaker. A win would have been helpful, while that tie against the Rams comes out as no more helpful than a loss — in either case, San Francisco would have 10 wins to Seattle’s 11. Since they would have had the tiebreaker, the difference between a win and a tie was much larger than the difference between a tie and a loss (which was essentially nothing).

But perhaps the more important race is against the Packers for the #2 seed. San Francisco is unlikely to lose to both Seattle and New England while the Seahawks run the table, so I think 49ers fans are more concerned about securing that bye. Right now, the 49ers are just a half-game ahead of Green Bay. Since the 49ers defeated the Packers, they would have held the tiebreaker if the two teams finished with the same record. Therefore, just like in the case of the Seahawks, “salvaging” a tie against the Rams will end up having been meaningless.

With that, perhaps it is time to turn our attention to the bottom of the list. We can skip from the top to the bottom after this short break

The Jets, the Eagles, Rex Ryan, the Chargers, Tim Tebow, Andy Reid, Mark Sanchez, Norv Turner

Now that that’s covered, the race for the #1 draft pick is on. Jason Lisk did a nice job handicapping the race, placing the Chiefs in the pole position but giving both the Raiders and Jaguars a better than 20% chance of the top pick. Football Outsiders sees things slightly different, giving both Kansas City and Jacksonville a two-in-five chance of shouting “We’re #1″… in April.

TeamRecWinsPrvWinDiffRemSOSRemHGComment
Atlanta Falcons11-1141310.422214-2 but with a Matt Ryan-sized monkey on their backs.
Houston Texans11-1131300.5942The game of the regular season takes place in New England on Monday Night.
Denver Broncos9-3131300.3592From 2-3 to 13-3? The Broncos will be streaking towards the playoffs and Peyton Manning is the favorite to earn his 5th MVP award
New England Patriots9-3121200.5393A win in Houston gives the Patriots a chance for the 1 seed; a loss means they may have to beat Pittsburgh and win in Denver and Houston to get to New Orleans.
San Francisco 49ers8-3-111.512.5-10.5312Hey, at least they didn't tie the Rams!
Green Bay Packers8-4111100.4382At 2-3, who would have guessed that Green Bay could still end up with a first round bye? They're only a half-game behind San Francisco.
Baltimore Ravens9-3111100.6092Stage 1 of regression to the mean happened last week.
Chicago Bears8-4111100.4221That was a tough loss to Seattle, but the Bears still control their own destiny in the NFC North with one game left against each rival.
Indianapolis Colts8-4101000.5472The difference between the 5 and 6 seed in the AFC is enormous, because it's a tall order asking Andrew Luck to win at Denver/NE/Houston.
Pittsburgh Steelers7-510910.4383Ben Roethlisberger may be back this weekend; the Steelers still have enormous upside but rarely flash it.
Seattle Seahawks7-510910.4843Russell Wilson is climbing up the Rookie of the Year charts. He doesn't have to do as much as Luck or Robert Griffin III but he's been excellent.
New York Giants7-5910-10.5632After week 8, I had them at 11 wins. Early in the season I had them at 9. The lesson: don't get confused by what happens to the Giants in the middle of the year.
Cincinnati Bengals7-59810.5162Starting to come around on the Bengals, although that may just be because the bar known as the rest of the conference keeps falling.
Tampa Bay Buccaneers6-689-10.5082Close losses against the Falcons and Broncosshow how far the team has come but are likely season killers.
Dallas Cowboys6-68800.5312It's December - can Tony Romo rewrite history?
Washington Redskins6-68800.4382Own the tiebreaker over the Giants and a much easier schedule.
St. Louis Rams5-6-17.56.510.4841Being able to go toe-to-toe with the 49ers should be a huge confidence booster for a young team.
New Orleans Saints5-778-10.4692Playing out the string in a disappointing season. Saints should consider giving some younger players playing time.
Miami Dolphins5-77700.5232Losing a close game to the Patriots doesn't drop your win total.
New York Jets5-77610.3441Anything between 5-9 and 9-7 is possible. But I doubt Mark Sanchez, Tim Tebow, or Greg McElroy quarterback the next Jets team that makes the playoffs.
Buffalo Bills5-77610.4923Another below-average but not terrible year for the Bills. At least they have a great running game.
Minnesota Vikings6-667-10.6642Percy Harvin out for the year is the final nail in the coffin for the Vikings' playoff hopes.
Tennessee Titans4-86600.4842Figuring out how to turn Jake Locker into the quarterback of the future should be the only goal for the rest of the year.
San Diego Chargers4-86600.4062This team started 2-0 but hasn't beaten anyone but the Chiefs since then.
Detroit Lions4-856-10.6412Calvin Johnson's pursuit of Jerry Rice is the only drama left in Lions land.
Carolina Panthers3-956-10.4842It's hard to reconcile this team with their record. Cam Newton still leads the league in yards per attempt.
Arizona Cardinals4-856-10.5862Kevin Kolb looks like Joe Montana compared to Ryan Lindley. The Cardinals were 0-15 on third down against the Jets.
Cleveland Browns4-85410.5312Cleveland is 3-2 in their last five games, which would inspire more confidence if this wasn't a lost season under a dead-end regime.
Oakland Raiders3-945-10.4222A good candidate to steal the #1 pick from KC and Jacksonville due to their weak SOS.
Philadelphia Eagles3-94400.5312Will the Eagles be able to win one last game under Andy Reid? At this point, I'm not counting on anything.
Jacksonville Jaguars2-103300.5002Best case scenario is Chad Henne plays well enough to convince the team to move on from Blaine Gabbert but not so well as to convince them in Henne himself.
Kansas City Chiefs2-103210.5001A tragic week in Kansas City. Thoughts and prayers go out to those impacted by the horrific events.

{ 5 comments }

Game Scripts, Part III – 2012 results

Last week, I introduced the concept of Game Scripts in Part I and Part II of this series. The short explanation is that a team’s Game Script score is simply the average score during each second of every game. Today, we’re going to look at some data from the 2012 season, although I have not yet included the data from this past weekend (week 13).

Let’s start with a look at the game scripts for each team this season.

TeamGScript
Patriots118.3
Texans114.8
49ers114.8
Bengals113.9
Bears113.8
Falcons113.6
Chargers113.3
Giants112.8
Buccaneers112.5
Ravens112.3
Redskins112.1
Packers112.1
Seahawks111.7
Steelers111.4
Vikings110.8
Broncos110.5
Saints110.2
Dolphins11-0.1
Colts11-1
Panthers11-1.6
Bills11-1.9
Cardinals11-2
Rams11-2
Browns11-2.1
Lions11-2.2
Cowboys11-3.4
Titans11-4
Jets11-4
Jaguars11-4
Eagles11-5.1
Raiders11-7.4
Chiefs11-7.6

There aren’t too many surprises on there. The Patriots are 8-3 (in this data set) with a record-setting offense; they have had a number of blowout victories and their three losses came by a combined four points. The Texans and 49ers also have impressive Game Script scores, and many would consider those three the three best teams in the league. Cincinnati might be a little surprising up at the top, but the Bengals were 10th in points differential through eleven games and third in points differential in the first half. Remember, the Game Script score is designed to be descriptive, not predictive; it’s not saying that Cincinnati is the 4th best team, it’s simply revealing the fact that the Bengals have, on average, led by 3.9 points in each second of every game they’ve played this year. That’s mostly because Cincinnati has been a great first half team.
[continue reading…]

{ 7 comments }

NYT Fifth Down: Post-week 13

This week at the New York Times, I blush when discussing Andrew Luck, praise the great Calvin Johnson as he tries to surpass Jerry Rice (but with a caveat), and take a look at some other random stats (including some absurd numbers from Adrian Peterson). Trivia: Brandon Marshall has gained over 1,000 yards on both the Bears and Broncos in seasons in which Jay Cutler was his primary quarterback both seasons. Can you name the only two other wide receivers to gain 1,000 yards with multiple teams but the same passer?

It’s not supposed to be this easy.

Sure, Steve Young and Aaron Rodgers followed Joe Montana and Brett Favre and excelled, but the fact that those examples are so memorable shows that they are the exception to the rule.

You’re not supposed to be able to replace a Hall of Fame quarterback with another star. In Indianapolis, the Colts got a taste of what life is often like for a team in the first year after a franchise quarterback’s exit: Curtis Painter, Dan Orlovsky and Kerry Collins earned every bit of their combined 2-14 record in 2011. But after the Colts bottomed out, Indianapolis’s fortunes changed dramatically. With the first pick in the 2012 draft, the team selected Stanford’s Andrew Luck, and the Colts appear set to be an annual contender for the next decade. Again.

Luck ranks fourth in passing yards this season, and he has shouldered the load for a Colts team that is below average in rushing, stopping the run and stopping the pass. Luck ranks “only” 19th in Adjusted Net Yards per Attempt and 14th in Net Yards per Attempt, unimpressive numbers only outside of the context of a rookie quarterback playing for what was the worst team in the N.F.L. a year ago. Luck passes the eye test and at least one advanced metric (before last night’s game, Luck ranked 6th in ESPN’s Total QBR), but part of what’s impressive about him is that even when he isn’t playing well, he remains capable of carrying his team to victory. Luck struggled for much of the game against Detroit on Sunday but still managed to pull out a most improbable victory.

In the first 56 minutes of the game, Luck was 17 for 39 for 279 yards with three interceptions. His team trailed the Lions, 33-21, with under three minutes remaining. At that point, Advanced NFL Stats calculated Indianapolis’s odds of winning at 2 percent.

But Luck led them on two scoring drives, and the Colts became just the seventh team to win a game despite trailing by 12 or more points with so little time remaining since 2000. Two of the other instances involved Peyton Manning with the Colts. In 2003, Manning led the Colts on a marvelous comeback against the Buccaneers on “Monday Night Football.” Six years later, Indianapolis trailed New England, 34-21, with 2:30 remaining. A Colts touchdown was followed by three Patriots plays that gained 8 yards, setting up Bill Belichick’s infamous 4th-and-2 decision.

It will be a long time before Luck could be considered anywhere near Manning’s class in terms of body of work, but his performance against the Lions is now alongside many of Manning’s memories in the annals of great Colts moments. Luck’s game-winning touchdown to Donnie Avery was just the 13th game-winning touchdown pass in the final seconds of a game since 2000.

Statistically, Andrew Luck may not be having the best year, but he has played an enormous part in the Colts’ magical run. At 8-4, the Colts are almost certainly going to make the playoffs; if they do, they will join the 2008 Miami Dolphins and 1982 Patriots on the list of N.F.L. teams to make the playoffs a year after going 2-14 or worse.

Luck will also set a couple of rookie records. With the game-winning drive he led against the Lions, he tied Ben Roethlisberger and Vince Young for the most fourth-quarter game-winning drives (five) by a rookie quarterback. By defeating Detroit and earning his eighth win, he broke a tie with Sam Bradford and now has the most wins among rookie quarterbacks selected first over all since 1950. Luck’s next victory will give him nine wins this season, tying him with Chris Chandler for the franchise record for wins by a rookie quarterback.

Calvin Johnson and the Lions’ Passing Game

Calvin Johnson led the league with 1,681 receiving yards last season and was named a first-team All-Pro by The Associated Press for the first time in his career. His encore performance may be even better.

He has gained a mind-boggling 1,428 receiving yards this season, joining Elroy Hirsch (1,495 yards in 1951) on the short list of N.F.L. players to top the 1,400-yard mark in a team’s first 12 games (in the A.F.L., Charley Hennigan and Lance Alworth each reached that mark once as well).

You can read the full post (and the answer to the trivia question) here.

{ 1 comment }

My college football playoff system

We need a playoff system to see more games between great teams like Alabama and LSU.

If Friday (or sometimes Thursday) is rant day at Football Perspective, then perhaps the first Tuesday in December can be fantasy day. Since everyone else does it, allow me to describe to you my preferred college playoff system.

  • A modified 8-team playoff that’s actually a 10-team playoff with a four-team “play-in” round. A playoff system should not undermine the regular season, and my system places significant emphasis on success in the regular season: the most-accomplished teams get to clear the lowest hurdles due to byes, home-field, and weaker opponents.
  • Notre Dame and the conference champions from the SEC, B12, P12, B10, and ACC earn automatic berths to the playoffs but only if they finish in the top 14.
  • A selection committee (or a BCS-style ranking system) is used to select the remaining teams. There is a limit of 4 teams per conference. The “play-in” round and the first round of the playoffs are held at the higher seed’s location the week after the conference championship games (i.e., next weekend).

Therefore, Alabama (#2 in the BCS), Kansas State (#5), Stanford (#6), and Florida State (#12) would be guaranteed spots by virtue of being conference champions. Notre Dame (#1) is also guaranteed a slot.

That leaves five at-large selections:

— Florida (#3)
— Oregon (#4)
— two of Georgia (#7), LSU (#8), Texas A&M (#9), and South Carolina (#10)
— Oklahoma (#11)

Basically the only teams that could complain about this system are the leftover SEC teams, but I’m okay with that since they would be considered the 5th and 6th best teams from their conference. I suppose 12-1 MAC Champion Northern Illinois might be bothered, but they lost to Iowa and had a cupcake schedule. Had Nebraska defeated Wisconsin, or had Ohio State been eligible, Oklahoma or a 4th SEC team would have been left out.

For purposes of this post, I will say Georgia and A&M would be the committee’s picks.

Here’s how the playoff system would work. The three highest-ranked conference champions (Alabama, K-State, Stanford) get byes along with the next three highest-ranked teams — Notre Dame, Florida, and Oregon. The other four teams play at the site of the higher ranked team [1]I would have the committee involved in this step of the process as well and instruct them to avoid rematches if possible. This year it is not an issue. this Saturday (December 8th). So we would have:

Play-in round

#13 Florida State @ #7 Georgia
#11 Oklahoma @ #9 Texas A&M

— Had UGA beaten Alabama, the Bulldogs would have earned a bye followed by a home playoff game. By losing, they have to play a play-in game and then win a road playoff game. So the SEC Championship was a critical game — and there’s a good chance the committee would have simply selected LSU instead because of the loss.
— Had Florida State beaten Florida, they would have had likely received a bye and possibly a home playoff game. Now they have to win two road games. Of course, the ACC Championship Game, which no one cared about on Saturday night, would have been significantly more relevant.
— Ditto the Big 10 Championship Game, well, at least for the first half. Meanwhile, Oklahoma would have known they would have needed to run the table to get in after losing to Notre Dame. Instead of the season essentially being meaningless, think how much more exciting the Sooners last-second wins over West Virginia and Oklahoma State would have been?
— And of course, think how much more exciting the rest of the season for A&M and Johnny Manziel would have been if they had a chance to make the playoffs?

First round of the playoffs:

The three conference winners and the top-seeded at large receive home playoff games, which would be played on Saturday, December 15th:

#1 Notre Dame hosts the worst remaining seed (either FSU or the A&M/Oklahoma winner)
#2 Alabama hosts the 2nd worst seed remaining (Georgia or the A&M/Oklahoma winner).
#5 Kansas State hosts the 3rd worst seed remaining (Florida)
#6 Stanford hosts the 4th worst seed remaining (Oregon)

[Note: If you want to have the committee switch the bottom two games so that Stanford does not “have to beat Oregon again” I am fine with that. KSU-Oregon and Stanford-Florida are just as acceptable to me, and I am willing to do the same to avoid a UGA or A&M rematch with Alabama if events unfolded that way.]

Notre Dame and Alabama had the best two regular seasons, and look at their rewards: they get a bye, they get a home game, and they play a team coming off a play-in game.

KSU and Stanford both won their conferences, so they are rewarded with byes and home playoff games. Florida State won their conference but their lackluster regular season did not merit the same reward. Wisconsin won the Big 10 and got nothing. So the regular season remains vitally important. Oregon and Florida had great regular seasons, and thanks to a second bite at the apple (which is instead only reserved for Alabama this year), their seasons weren’t meaningless after one loss. And the lowest two seeds played their win into the playoff.

This playoff format makes the regular season much more meaningful for many more teams, while only slightly taking away from the value of certain games (admittedly, the Kansas State and Oregon upsets on November 17th would have been less meaningful in this format; I’m okay with that — the perfect should not be the enemy of the good.)

The Final Four

We now break until the first weekend of January. At this point, we have four very deserving teams. They would play in a four-team playoff, rotated among the bowl sites, as currently envisioned. We might see Notre Dame and Oregon in the Rose Bowl and Alabama and Kansas State in the Sugar Bowl. Or perhaps A&M and Oregon in the Cotton Bowl and Florida and Notre Dame in the Orange Bowl. Who knows. The good news is that unless there are 11 deserving teams, everyone gets a shot (and even if all 5 autobids finish in the top 14, 4 non-conference champs are still eligible; no worthy undefeated team should get left out in this system).

References

References
1 I would have the committee involved in this step of the process as well and instruct them to avoid rematches if possible. This year it is not an issue.
{ 14 comments }

Scott Kacsmar has been keeping track of 4th quarter comebacks and game-winning drives for some time. As a technical matter, Greg McElroy earned both a 4th quarter comeback and led a game-winning drive in his first game ever yesterday. How rare is that?

The table below shows all the quarterbacks to lead 4th quarter comebacks and game-winning drives. Some of these, like Brian St. Pierre’scomeback win” — and to a large extent, McElroy’s 4QC/GWD — are far from laudable. Still, here is the list:

YearNameTmOppWeekFinal Score
2012Greg McElroyNYJARI137-6
2005Ryan FitzpatrickSTLHOU1233-27
2004Brian St. PierrePITBUF1729-24
2001A.J. FeeleyPHITAM1717-13
1998Ryan LeafSDGBUF116-14
1997Jim DruckenmillerSFOSTL215-12
1987Mike KelleySDGCIN310-9
1987Brian McClureBUFNYG56-3
1985Dieter BrockRAMDEN120-16
1985Bernie KosarCLENWE524-20
1985Steve YoungTAMDET1219-16
1981Turk SchonertCINSEA127-21
1977Jerry GolsteynNYGWAS120-17
1974Clint LongleyDALWAS1224-23
1971Archie ManningNORRAM124-20
1961Sam EtcheverrySTLNYG121-10
1961Warren RabbBUFHOU522-12
1960Bob WatersSFOBAL930-22
{ 1 comment }

Profiling Pat Studstill

Lions wide receiver present.

On Sunday, Calvin Johnson became just the second player in NFL history to gain at least 125 receiving yards in five consecutive games. He’s also the second Lion to hit those marks.

As you’ve probably figured it out by the title, the only player with 125+ receiving yards in five straight games prior to Johnson was Patrick Lewis Studstill Jr., who had an 11-year career with the Lions, Rams, and Patriots. Studstill was a first-team All-Pro wide receiver in 1966, when he led the NFL in receiving yards. Beginning in week 5 of that season, Studstill topped 115 receiving yards in six straight weeks. Those were six highest single-game yardage totals of his career.

Studstill was a receiver and punter at the University of Houston in the late ’50s, but his senior season was a disaster. Head coach Hal Lahar was your typical coach of the era when it came to rules, and Studstill violated a major one — by getting married. Lahar benched Studstill for his entire senior year, and as a result, Studstill went undrafted. One of the Cougars assistant coaches, Red Conkright, was a former NFL player who would later become the last head coach of the Oakland Raiders before Al Davis. Conkright vouched for Studstill, who received a tryout in Detroit. Because of his versatility and speed, he was able to make the Lions roster in 1961.

Studstill didn’t see the field much during his rookie season, but did manage a 100-yard kickoff return touchdown against the Bears. An injury to Terry Barr in 1962 opened the door for Studstill to begin making a contribution on offense. In the last 9 games of the season, Sutdstill caught 31 passes for 446 yards, second on the team in both categories to Pro Bowler Gail Cogdill.
[continue reading…]

{ 12 comments }

Trivia of the Day – Sunday, December 2nd

Matt Stafford won the ESPY for most double chins in a leading role

In case you haven’t noticed, Detroit’s Matt Stafford is throwing the ball a lot this year. He’s thrown the second most passes of any quarterback through 11 games in league history.

In 2011, Stafford led the NFL with 663 pass attempts, the third most in NFL history. In my preview of the 2012 Lions, I threw some cold water on Stafford’s outlook, noting that while he threw for 5,000 yards, his 13th-place finish in Y/A was more telling. This season Stafford is throwing even more frequently — he’s up three pass attempts per game — and is on pace to break the record for pass attempts in a season. And while Stafford may again hit the 5,000-yard mark, he currently ranks just 21st in yards per attempt, which is less forgivable in connection with a 4-7 record than a 10-6 mark.

I suspect that most fans of Football Perspective are pretty good at trivia, so I’m not going to let you off easy. You probably know which quarterback holds the record for pass attempts in a season:

Click 'Show' for the Answer Show


The more challenging question is this: which team holds the record for most team pass attempts in a season? Right now, Detroit is on pace for 729 pass attempts this season (Shaun Hill threw 13 passes), which would break the record.

Trivia hint 1 Show


Trivia hint 2 Show


Trivia hint 3 Show


Click 'Show' for the Answer Show

{ 5 comments }

Under Raheem Morris, the Tampa Bay rush defense was always… what is the polite way to put this… accommodating to opposing running backs. Over Morris’ three-year tenure, the Buccaneers joined the Bills as either 31st or 32nd in all three major rush defense categories: rushing yards allowed, rushing yards per carry allowed, and rushing touchdowns allowed.

This was the case despite the organization’s best efforts to find players that could stop the run. The Buccaneers’ second selection in the 2009 draft was used on defensive tackle Roy Miller.  That season, Tampa Bay finished last in both rushing yards and rushing yards per carry allowed.   The following April, the Bucs used the third pick in the draft on Gerald McCoy and the 35th selection on Brian Price, making them the rare team to take multiple interior defensive linemen with top-40 picks.  That season was the one successful year of Morris’ tenure, but Tampa Bay still finished 28th in rushing yards allowed and 31st in yards per rush allowed.

Linebacker Lavonte David has been a monster for Tampa Bay.

So Tampa continued to focus on the defensive line in the 2011 draft, this time taking Iowa’s Adrian Clayborn and Clemson’s Da’Quan Bowers with their first and second round picks and middle linebacker Mason Foster in the third round. In 2011, Tampa finished the year 32nd in rushing yards allowed, 32nd in rushing touchdowns allowed, and 31st in yards per carry allowed.

Enter Greg Schiano and defensive coordinator Bill Sheridan.  With a horrible run defense for three consecutive years, the Bucs couldn’t ignore the problem just because they had failed in prior attempts to plug the leak.  With the seventh pick, the team selected Alabama’s Mark Barron, an in-the-box safety who was considered one of the safest picks in the draft.

Schiano, Barron, McCoy, and second round pick Lavonte David (who was just named the NFC defensive rookie of the month for November) have completely reformed the Tampa rush defense. The team currently ranks first in both rushing yards and yards per rush allowed. That’s unbelievable. Nothing more could be said about the magnitude of a leap from 32nd to 1st, so let me close with a look at the biggest jumps in rushing yards allowed and rushing yards per carry allowed in NFL history.
[continue reading…]

{ 4 comments }
Next Posts