≡ Menu

Did you just grab my torch?

Did you just grab my torch?

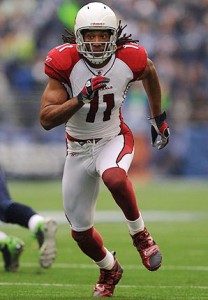
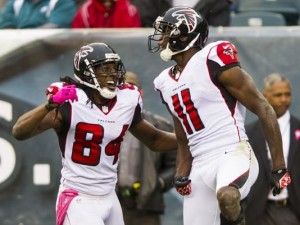
Randy Moss and Cris Carter. Torry Holt and Isaac Bruce. Reggie Wayne and Marvin Harrison. From time to time, a franchise with a star wide receiver manages to draft another one. At that point, we just wait and see how long it takes the young pup to steal the spotlight. Everyone succumbs to age, and eventually, the torch will be passed to the younger receiver. Even the GOAT wasn’t immune to Father Time (well, at least while he was in SF), as Terrell Owens eventually surpassed Jerry Rice as the 49ers top wideout.

Last year, Julio Jones and Roddy White both finished in the top 12 in fantasy points scored by wide receivers (using the formula 0.5 point per reception, 0.1 points per yard, and 6 points per touchdown). Since 1970, there have been 20 different pairs of wide receivers who met the following criteria:

  • Each wide receiver finished in the top 12 in fantasy points (using a 0.5 PPR scoring system)
  • The receivers were at least four years apart in age; and
  • The younger receiver was 26 year old or younger.

2012 FalconsJulio Jones (23) and Roddy White (31) (Matt Ryan)

Let’s start with the most recent entry.  At just 23 years old, Jones has established himself as one of the game’s best wide receivers.  White is presumably on the downside of his career, but he’s had a remarkable run.  Wide receiver numbers must be adjusted for era, but here’s a fun stat: White has topped 80 catches, 1100 yards, and 6 touchdowns in six straight seasons (2007-2012), a feat previously accomplished by only Marvin Harrison and Jerry Rice.
[continue reading…]

{ 7 comments }

The Best Passing Games of 2012 (NFL)

Even Watt couldn't slow down Rodgers and... Henne.

Even Watt couldn't slow down Rodgers and... Henne.

Yesterday, I presented my Rearview ANY/A ratings for quarterbacks and defenses in 2012. Strength of schedule adjustments are important — without it, Peyton Manning‘s numbers were tops in the league, but after the adjustments, Tom Brady moved into the number one slot. To create the season rankings, I had to come up with rankings for each quarterback and each defense in every game last season, so I figured I should present those results as well.

Using the same principles from yesterday’s post, the table below shows all games where a quarterback produced over 100 Adjusted Net Yards above average. You’re probably surprised to see that Chad Henne’s performance in Houston ranks as the single best passing game of 2012. There were only 64 pass plays of 60+ yards last season, but three of them came by Henne against the Texans. That game narrowly edged out Brady’s Thanksgiving Night performance against the Jets (overshadowed by Le Buttfumble), and a separate shredding of the Texans secondary, this time courtesy of Aaron Rodgers. You can click on the boxscore below to see the full PFR boxscore of each game. As always, the table is fully searchable and sortable, and you can click the arrows at the bottom to see more rows.
[continue reading…]

{ 6 comments }

Every year at Footballguys.com, I publish an article called Rearview QB, which adjusts quarterback (and defense) fantasy numbers for strength of schedule. I’ve also done the same thing using ANY/A instead of fantasy points, and today I revive that concept for the 2012 season.

Let’s start with the basics. Adjusted Net Yards per Attempt is defined as (Passing Yards + 20 * Passing Touchdowns – 45 * Interceptions – Sack Yards Lost) divided by (Pass Attempts plus Sacks). ANY/A is my favorite explanatory passing statistic — it is very good at telling you the amount of value provided (or not provided) by a passer in a given game, season, or career.

Let’s start with some basic information. The league average ANY/A in 2012 was 5.93. Peyton Manning averaged 7.89 ANY/A last year, the highest rate in the league among the 39 passers with at least 75 attempts. Since the Broncos star had 583 pass attempts and 21 sacks in 2012, that means he was producing 1.96 ANY/A over league average on 604 dropbacks. That means Manning is credited with 1,185 Adjusted Net Yards above average, a metric I simply call “VALUE” in the table below. Manning led the league in that category, with Tom Brady, Drew Brees, Aaron Rodgers, and Matt Ryan rounding out the top five. Remember, the ANY/A and VALUE results aren’t supposed to surprise you, so it makes sense that the best quarterbacks finish near the top in this category every year.
[continue reading…]

{ 21 comments }

An interesting tweet from Adam Schefter today: Matt Ryan has 56 regular season wins in his first five seasons, the most in NFL history. Ryan has started 78 games, one of only three quarterbacks (Peyton Manning, Joe Flacco) to start at least 75 games in their first five seasons.

I thought it would be interesting to take a look at not just quarterback wins, but quarterback winning percentage (minimum: 15 wins) and wins minus losses (as a compromise between winning percentage and wins). As it turns out, Ryan ranks 1st in wins, 7th in winning percentage, and 1st in wins over losses (or wins over .500) among all quarterbacks to enter the league since 1960.

Quarterback1st YrWinLossTieStartsWin %W-LWin RkWin % RkW-L Rk
Daryle Lamonica19631710180.94416119116
Roger Staubach19692350280.8211871211
Ken Stabler19712051260.7881595319
Tom Brady200148140620.77434441
Jim McMahon198234120460.739222457
Ben Roethlisberger200451200710.71831363
Matt Ryan200856220780.71834171
Kurt Warner199935140490.7142120810
Dan Marino198348210690.69627495
Pat Haden197630131440.69317421013
Tony Romo200627120390.69215561119
Mike Tomczak19862090290.6911951232
Stan Humphries199031140450.68917351313
Philip Rivers200633150480.68818281411
Jay Fiedler199922100320.68812821429
Jack Kemp196029131430.68616481616
John Elway198346211680.684256176
Mark Rypien198842200620.677228187
Joe Flacco200854260800.675282194
Donovan McNabb199943210640.672227207
Doug Flutie19861680240.66781262143
Dave Krieg198119100290.65591032235
Brad Johnson19961580230.65271312350
David Woodley198030161470.64914422422
Jay Schroeder198531170480.64614352522
Elvis Grbac19951690250.6471262650
Vince Ferragamo19791690250.6471262650
Neil O'Donnell199139220610.63917142813
Vince Young200630170470.63813422925
Rex Grossman200319110300.63381033043
Terry Bradshaw197032190510.62713323125
Bernie Kosar198539231630.62716143216
Jim Harbaugh198823140370.6229713335
Michael Vick200131191510.61812353429
Steve Grogan197541260670.61215123519
Joe Namath196537234640.60914173622
Brett Favre199237240610.60713173725
Greg Landry196825162430.6059633835
Marc Bulger200236240600.612193929
Bert Jones197333220550.611283932
Ken Anderson197134230570.59611244132
Jake Delhomme199929200490.5929484235
Steve McNair199529200490.5929484235
Eli Manning200442290710.5921384425
Tony Eason198326180440.5918594543
Chad Pennington200220140340.5886954654
Mark Brunell199531220530.5859354735
Andy Dalton201118130310.58151134857
Eric Hipple198118130310.58151134857
Bobby Hebert198529210500.588485043
Randall Cunningham198530221530.5758425143
Joe Montana197928210490.5717535250
Jim Hart196724183450.5676665354
Boomer Esiason198435270620.5658205443
Jim Kelly198640310710.5639135535
Charley Johnson196226203490.5616595654
Drew Bledsoe199342330750.56985735
Troy Aikman198938300680.5598165843
John Hadl196223184450.5565715957
Virgil Carter196816130290.55231266064
Steve Beuerlein198818150330.54531136164
Gary Danielson197718150330.54531136164
Steve Walsh198919160350.54331036364
Kordell Stewart199723200430.5353716464
Ken O'Brien198431271590.5344356560
Mark Sanchez200933290620.5324286660
Jim Everett198634300640.5314246760
Joe Kapp196724213480.5313666764
Aaron Rodgers200817150320.53121196772
Scott Mitchell199317150320.53121196772
Brian Griese199927240510.5293567164
Quincy Carter200118160340.52921137172
Scott Hunter197117153350.52921197372
Roman Gabriel196219171370.52721037472
Matt Hasselbeck200120180380.5262957572
Mike Phipps197019172380.52621037572
Peyton Manning199842380800.525487760
Kyle Orton200532290610.5253327864
Byron Leftwich200324220460.5222667972
Drew Brees200230280580.5172428072
Bob Griese196729273590.5172488172
Ron Jaworski197517160330.51511198282
Aaron Brooks200035340690.5071208382
Jay Cutler200634340680.50248484
Doug Williams197833331670.50288484
Neil Lomax198130301610.50428484
Jon Kitna199724240480.50668484
Bill Kenney198023230460.50718484
Brian Sipe197422220440.50828484
Jeff Garcia199935360710.493-1209090
Carson Palmer200432330650.492-1329190
Joe Ferguson197331320630.492-1359290
Daunte Culpepper200028290570.491-1539390
Bob Avellini197523240470.489-1719490
Tommy Kramer197722240460.478-2829595
Kyle Boller200320220420.476-2959695
Trent Dilfer199431350660.47-4359799
Don Majkowski198721241460.467-3899897
Bubby Brister198621240450.467-3899997
Kerry Collins199526300560.464-45910099
Phil Simms197923270500.46-47110199
Tom Flores196023282530.453-571102103
Rodney Peete198921260470.447-589103103
David Whitehurst197716201370.446-412610499
Steve Bartkowski197522280500.44-682105106
Trent Green199822290510.431-782106107
Josh Freeman200924320560.429-866107111
Steve Fuller197915200350.429-5131107103
Dave M. Brown199420270470.426-795109107
Gus Frerotte199419261460.424-7103110107
Jason Campbell200627370640.422-1056111113
Derek Anderson200618250430.419-7113112107
Charlie Batch199819270460.413-8103113111
Tony Banks199625360610.41-1163114115
Jeff Blake199421310520.404-1089115113
Jim Zorn197628440720.389-1653116124
Dan Pastorini197121330540.389-1289116118
Warren Moon198426420680.382-1659118124
Alex Smith200519310500.38-12103119118
Jake Plummer199725410660.379-1663120124
Matthew Stafford200917280450.378-11119121115
Jim Plunkett197123380610.377-1571122121
Fran Tarkenton196123393650.377-1671123124
Tim Couch199922370590.373-1582124121
Rick Mirer199320340540.37-1495125120
Sam Bradford201015261420.369-11131126115
Richard Todd197619340530.358-15103127121
Chris Miller198720360560.357-1695128124
Joey Harrington200223430660.348-2071129130
Mike Pagel198215311470.33-16131130124
Vinny Testaverde198719390580.328-20103131130
Jeff George199021440650.323-2389132132
Norm Snead196117413610.303-24119133133
David Carr200222530750.293-3182134135
Archie Manning197115433610.27-28131135134

Of course, having a good (or bad) winning percentage early in a quarterback’s career doesn’t tell us how much of a “winner” that quarterback will be in the future.

{ 1 comment }

The one constant in the Cardinals passing game

The one constant in the Cardinals passing game.

When Tom Brady takes the field as the Patriots starting quarterback in week 1, it will be his 12th consecutive appearance as New England’s opening-week starter. That’s the longest streak in the league, with Eli Manning (9 in 2013), Drew Brees (8), Philip Rivers (8), Tony Romo (7), and Matt Schaub (7) being the only other quarterbacks to start for the same team in each week one since 2007.

On the other hand, the Cardinals will be trotting out their fifth different week 1 starter in as many seasons. Arizona fans hope Carson Palmer will be the right man to finally replace Kurt Warner, after Derek Anderson (2010), Kevin Kolb (2011), and John Skelton (2012) failed. If Chad Henne starts the opener for Jacksonville, that will make it four different quarterbacks in four straight years for the Jaguars (following Blaine Gabbert, Luke McCown, and David Garrard). Palmer’s old team, the Raiders, is the only other team with three different starters the last three years (Matt Flynn, Palmer, and Jason Campbell).

The longest streak of consecutive week one starters is a tie between a pair of Class of ’83 teammates. John Elway started in week 1 every season of his sixteen year career, while Dan Marino started every week 1 from 1984 until 1999. Our games started data only goes back to 1960, but I doubt we would find a sorrier pre-1960 streak than the Chicago Bears from 1998 to 2006. Over a nine-year period, Chicago never had the same quarterback start in week 1 in consecutive years. The full list, beginning in ’98: Erik Kramer, Shane Matthews, Cade McNown, Matthews again, Jim Miller, Kordell Stewart, Rex Grossman, Kyle Orton, and Grossman again. The Ravens, from ’97 to ’03, had seven different week-one starters: Vinny Testaverde, Jim Harbaugh, Scott Mitchell, Tony Banks, Elvis Grbac, Chris Redman, and Kyle Boller, and that doesn’t include Trent Dilfer.

Brandon Weeden is bringing some stability to the Browns quarterback position: if by some chance Jason Campbell steals the job in preseason, he would be Cleveland’s seventh week one starting quarterback in seven years (Charlie Frye in 2007, Derek Anderson, Brady Quinn, Jake Delhomme, Colt McCoy, Weeden, and Campbell). The table below shows each team’s week 1 starters in each of the last ten seasons, along with the projected starter in 2013 according to Footballguys.com (with EJ Manuel (Buffalo), Chad Henne (Jacksonville), Nick Foles (Philadelphia) and Mark Sanchez (New York, for the fifth straight year) projected to win the four open camp jobs.)
[continue reading…]

{ 5 comments }

Why did I have to play with Matt  Moore?

Why did I have to play with Matt Moore?

While reading the always excellent Football Outsiders Almanac, I was reminded that Brandon Marshall has had 1,000-yard seasons playing with Jay Cutler, Kyle Orton, Chad Henne, and Matt Moore (and, of course, Cutler again in Chicago). That’s pretty impressive for a player in his twenties, although regular readers know that I’m a big fan of Marshall.

Two other active players have gained 1,000 yards with four different quarterbacks. For the remainder of this post, I’ll be defining a receiver’s “quarterback” as the quarterback on his team each season who threw for the most passing yards. One of them is pretty obvious: the annually great Tony Gonzalez hit the 1,000-yard mark with Elvis Grbac, Trent Green, Damon Huard, and Tyler Thigpen (but not Matt Ryan). The third player might be a bit more difficult to guess:
[continue reading…]

{ 4 comments }

Manning's worst statistical performance.

Manning's worst statistical performance.

Scott Kacsmar recently wrote about how Daunte Culpepper had the worst performance of his career in his biggest game. In his only NFC Championship Game appearance, Culpepper went 13-of-28 for 78 yards with three interceptions and four sacks. Which made me wonder: how many other great quarterbacks have had their worst game in the playoffs?

I’ll define worst game using the methodology from my Greatest QB of All-Time series [1]For pre-2008, I will be using estimated sack data based on the following formula: Team Sacks allowed X (QB pass attempts / team pass attempts). This means I will calculate each quarterback’s ANY/A [2]I will also include rushing touchdowns and count them the same as passing touchdowns, but will not include any other rushing data. and compare it to league average for that season.

For example, Peyton Manning‘s worst game came in November 2007 against the Chargers. He threw for 328 yards and 2 touchdowns, but that came on 58 dropbacks and with six interceptions. He averaged 1.44 ANY/A that game, in a season where the league average was 5.52 ANY/A. That means Manning was 4.08 ANY/A below average on 58 pass plays, which gave him 239 Adjusted Net Yards below average. The table below shows some of the top quarterbacks in NFL history and which games were their worst. For quarterbacks like Johnny Unitas and Bart Starr, the records are incomplete, as our individual games database only goes back to 1960. The “VALUE” column shows how many Adjusted Net Yards each quarterback was below average.
[continue reading…]

References

References
1 For pre-2008, I will be using estimated sack data based on the following formula: Team Sacks allowed X (QB pass attempts / team pass attempts).
2 I will also include rushing touchdowns and count them the same as passing touchdowns, but will not include any other rushing data.
{ 1 comment }

Is there a harder award to predict in football? It would have been impossible to predict who would win the award this time last year, as eventual winner Bruce Arians wasn’t even a head coach until October. Of course, that doesn’t excuse my terrible selection. As I said last year, predicting in the pre-season which coach will ultimately win the award is so difficult that Vegas doesn’t even offer odds on the event. For reference, below is a look at every coach to ever be selected by the Associated Press as NFL Head Coach of the Year: for what it’s worth, Arians saw the biggest increase in winning percentage of any COTY winner. Arians also broke a tenure deadlock: until last season, both 1st and 2nd-year coaches had won the award 15 times, but now first-year head coaches are in the lead having won the award 16 out of 57 times (28%).

[continue reading…]

{ 2 comments }

Not doing a squirrel dance.

Not doing a squirrel dance.

Last year, I wrote about how rare and impressive it was to see Ray Lewis and London Fletcher still playing at high levels. Lewis did not have a great 2012 season, but managed to walk away from the game as a defending Super Bowl champ. Fletcher was even better, and was named a second-team All-Pro by the Associated Press.

Pro-Football-Reference.com’s Approximate Value system goes back to 1950. Only five times since then has an inside linebacker recorded 10 points of AV at age 36 or older: London Fletcher and Sam Mills are each responsible for two of them, with Bill Pellington (’64 Colts) rounding out the group.

Fletcher has never missed a game in his career, a remarkable accomplishment for the 15-year veteran. Consider that only three linebackers have appeared in more games than Fletcher (240): Bill Romanowski (243), Junior Seau (268), and Clay Matthews, Jr. (278). And all three of those players were outside linebackers, giving Fletcher more games than any inside linebacker in NFL history.

Which is pretty incredible for a player who received no awards or postseason recognition until turning 34. If all you knew about Fletcher was his performance from age 34+, you would assume he was a first ballot Hall of Famer. In 2009, he made his first Pro Bowl, and Fletcher was sent again in 2010 and 2011. The last two years, he’s been a second-team All-Pro, giving him some recognition in each of the last four years. Fletcher is on the short list (with Mills and Lewis) for the title of most successful inside linebacker from age 34+.

On the opposite end of the spectrum is Patrick Willis, who has now made the Pro Bowl in each of his first six seasons. The only other defensive players to do that: Derrick Thomas, Lawrence Taylor, Joe Greene, Dick Butkus, and Merlin Olsen. That’s mighty fine company, but it’s hard to find any flaws in Willis’ game. Not a fan of Pro Bowls? Since 1970, Lawrence Taylor, Reggie White, and Willis are the only defensive players with five first-team All-Pro honors in their first six seasons.
[continue reading…]

{ 8 comments }

Scott Kacsmar recently wrote about Robert Griffin III’s struggles on third downs last season. Despite Griffin’s otherworldly rate stats, that was one area where he really struggled in 2012. I thought it would be interesting to take a look at how all quarterbacks fared on “third downs” last season. I put that in quotes because I’m including fourth down data, but don’t want to write third and fourth down throughout this post. Regular readers may recall I did something similar last November, but now we can work with full 2012 season numbers.

To grade third down performance, I included sacks but threw out all rushing data (not for any moral reason, just in the interest of time). The first step in evaluating third down performance is to calculate the league average conversion rate on third downs for each distance. Next, I came up with a best-fit smoothed line based on the data, which is based off the following formula:

Conversion Rate = -0.0001 * Distance^2 – 0.0224 * Distance + 0.5301

Take a look at the table below. For example, there were 309 passes (i.e., pass attempts or sacks — scrambles are not included) and the league-wide conversion rate was 51.1%. Using the best-fit formula, the smoothed rate is 50.8%. There is nothing groundbreaking here — the conversion rates drop as the “to go” number increases, but it helps to quantify what we already know.

To GoPassesFirst DownsRateSmoothed Rate
130915851.1%50.8%
241520850.1%48.5%
348720742.5%46.2%
451222744.3%43.9%
555922640.4%41.6%
654122842.1%39.2%
752118134.7%36.8%
842614333.6%34.5%
936511631.8%32%
1072822030.2%29.6%
112137133.3%27.2%
121533925.5%24.7%
131352417.8%22.2%
141072220.6%19.7%
151432215.4%17.2%
166258.1%14.6%
17681217.6%12%
185036%9.5%
195335.7%6.8%
204836.3%5%

[continue reading…]

{ 23 comments }

Last week, I wrote about how the 2012 Redskins were powered by a pair of rookies in Robert Griffin III and Alfred Morris. The only team whose rookies had more passing/rushing/receiving yards in NFL history was the 2012 Colts, while the only non-expansion team with a higher percentage of yards from rookies was the ’55 Colts.

In the comments, Shattenjager pointed out that the list I presented was pretty quarterback-heavy. So I thought a fun thing to do would be to use PFR’s Approximate Value (AV) system instead of yards, and re-run the numbers.

The table below shows all non-expansion teams since 1950 that had at least 25% of their AV come from rookies. For each team, I’ve listed their record and winning percentage, total team AV, their rookie AV, and the percentage compiled by rookies. Then I listed their top four rookies in terms of AV.
[continue reading…]

{ 3 comments }

For eleven straight years, I’ve written an article called “Defensive Team By Committee.” This year’s version is up at Footballguys.com (subscriber only).

Fantasy defenses are inconsistent from year to year, making it difficult to predict which defenses and special teams (D/STs) will excel. And, at least in theory, the teams available at the ends of your drafts should provide less rewards. So how do you get great production out of the position while saving your most important draft picks?

We spend countless hours analyzing team offenses, and relatively few thinking about team defenses. But an average defense against a bad offense will do just as well as a great defense against an average offense. The key to the DTBC system is to find two teams available late in your draft whose combined schedule features predominantly weak offenses. By starting your defense based on matchups, your D/ST will generally face a weak offense, meaning your D/ST position will score lots of fantasy points.

You can read my two picks, along with a ranking of all 496 combinations, here.

For you iPad users our there, I’ll also recommend the $4.99 Footballguys Fantasy Football Magazine Draft Kit, an awesome resource at a super cheap cost. That includes the Draft GM Kit, which you can separately order if (like me) you don’t have an iPad but do have an iPhone. Both products will also be available on Android very soon, if not already by the time you read this. You can receive all Footballguys updates by signing up on the Free Footballguys Daily E-mail list.

{ 0 comments }

Last week, I wrote about why I was not concerned with Trent Richardson’s yards per carry average last season. I like using rushing yards because rush attempts themselves are indicators of quality, although it’s not like I think yards per carry is useless — just overrated. One problem with YPC is that it’s not very stable from year to year. In an article on regression to the mean, I highlighted how yards per carry was particularly vulnerable to this concept. Here’s that chart again — the blue line represents yards per carry in Year N, and the red line shows YPC in Year N+1. As you can see, there’s a significant pull towards the mean for all YPC averages.

regression ypc

I decided to take another stab at examining YPC averages today.  I looked at all running backs since 1970 who recorded at least 50 carries for the same team in consecutive years. Using yards per carry in Year N as my input, I ran a regression to determine the best-fit estimate of yards per carry in Year N+1. The R^2 was just 0.11, and the best fit equation was:

2.61 + 0.34 * Year_N_YPC

So a player who averages 4.00 yards per carry in Year N should be expected to average 3.96 YPC in Year N+1, while a 5.00 YPC runner is only projected at 4.30 the following year.

What if we increase the minimums to 100 carries in both years? Nothing really changes: the R^2 remains at 0.11, and the best-fit formula becomes:

2.63 + 0.34 * Year_N_YPC

150 carries? The R^2 is 0.13, and the best-fit formula becomes:

2.54 + 0.37 * Year_N_YPC

200 carries? The R^2 stays at 0.13, and the best-fit formula becomes:

2.61 + 0.36 * Year_N_YPC

Even at a minimum of 250 carries in both years, little changes. The R^2 is still stuck on 0.13, and the best-fit formula is:

2.68 + 0.37 * Year_N_YPC

O.J. Simpson typifies some of the issues. It’s easy to think of him as a great running back, but starting in 1972, his YPC went from 4.3 to 6.0 to 4.2 to 5.5 to 5.2 to 4.4. Barry Sanders had a similar stretch from ’93 to ’98, bouncing around from 4.6 to 5.7 to 4.8 to 5.1 to 6.1 and then finally 4.3. Kevan Barlow averaged 5.1 YPC in 2003 and then 3.4 YPC in 2004, while Christian Okoye jumped from 3.3 to 4.6 from 1990 to 1991.
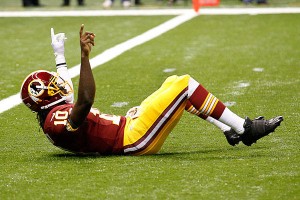
This guy knows about leading the league

This guy knows about leading the league.

Those are isolated examples, but that’s the point of running the regression. In general, yards per carry is not a very sticky metric. At least, it’s not nearly as sticky as you might think.

That was going to be the full post, but then I wondered how sticky other metrics are.  What about our favorite basic measure of passing efficiency, Net Yards per Attempt? For purposes of this post, an Attempt is defined as either a pass attempt or a sack.

I looked at all quarterbacks since 1970 who recorded at least 100 Attempts for the same team in consecutive years. Using NY/A in Year N as my input, I ran a regression to determine the best-fit estimate of NY/A in Year N+1. The R^2 was 0.24, and the best fit equation was:

3.03 + 0.49 * Year_N_NY/A

This means that a quarterback who averages 6.00 Net Yards per Attempt in Year N should be expected to average 5.97 YPC in Year N+1, while a 7.00 NY/A QB is projected at 6.45 in Year N+1.

What if we increase the minimums to 200 attempts in both years? It has a minor effect, bringing the R^2 up to 0.27, and producing the following equation:

2.94 + 0.51 * Year_N_NY/A

300 Attempts? The R^2 becomes 0.28, and the best-fit formula is now:

2.94 + 0.53 * Year_N_NY/A

400 Attempts? An R^2 of 0.26 and a best-fit formula of:

3.18 + 0.50 * Year_N_NY/A

After that, the sample size becomes too small, but the takeaway is pretty clear: for every additional yard a quarterback produces in Year N, he should be expected to produce another half-yard in NY/A the following year.

So does this mean NY/A is sticky and YPC is not? I’m not so sure what to make of the results here. I have some more thoughts, but first, please leave your ideas and takeaways in the comments.

{ 9 comments }

NFL Futures

I’m in Las Vegas, and thought I would solicit suggestions before placing bets.

20130719-195702.jpg 20130719-195733.jpg 20130719-195723.jpg 20130719-195742.jpg
{ 6 comments }

Football Outsiders Almanac

If you’re reading this blog, chances are you already know all about our friends at Football Outsiders and the terrific analysis they provide every year. However, if by some chance you don’t know of them, or maybe you haven’t heard about their outstanding annual book, they now have copies of the 2013 Football Outsiders Almanac available for purchase. The book is jam-packed with their signature data (including game-charting stats), plus their usual stat-geeky essays, team and player perviews, and 2013 projections. And it’s not just the NFL, as Football Outsiders has some pretty sharp minds (Matt Hinton, Bill Connelly, Brian Fremeau) covering the college game, too.

The end of the Almanac includes an Acknowledgments section. For years, Football Outsiders has been nice enough to group me with Doug Drinen and Neil Paine as FO’s “comrades” in the statistical revolution. But this year, they’ve left me out of the Acknowledgments section. Entirely.

That’s because I’ve moved over to the Contributors section. I wrote team essays for the Giants, Eagles, and Jets, along with player comments for the majority of players on those teams. If you enjoy my work here, you’ll probably enjoy reading what I wrote about those three teams.

Football Outsiders has been a supporter of Chase Stuart for a while and Football Perspective from the beginning. But don’t confuse this for charity post: the FOA is a great guide, and I’m sure anyone who buys it will be very happy.

{ 2 comments }

(I originally posted this at the S-R Blog, but I thought it would be very appropriate here as well.)

Here is a google doc containing every team-season in our database since 1957, including the Head Coach and offensive & defensive coordinators. It also specifies those coaches’ preferred offensive or defensive schemes (depending on which side of the ball they specialize in), and attempts to figure out the general offensive family (i.e. Air Coryell, Erhardt-Perkins, etc) each team-season fell into.

THIS IS BY NO MEANS COMPLETE. In fact, it’s very much incomplete at this stage — and that’s where you come in. In the comments of this post, or in an email, we’d love to hear corrections and/or additions to the data, if you see an entry about which you know more than we do (and it’s a good bet you do). Thanks in advance for your help, and hopefully we can assemble a more complete listing of teams’ systems/schemes, which will let us do things like compute splits vs. a certain type of offense or defense, analyze whether 4-3 or 3-4 defenses were better in a given season, etc.

So let those corrections/additions pour in!

{ 4 comments }

The guy on the right was a loser until he wasn't.

The guy on the right was a loser until he wasn't.

Longtime readers of this blog know that I’m not a big fan of Matt Stafford. Last year, when most people were praising his breakout 2011 season, I questioned whether he was as good as his backers claimed. And, of course, his 2012 performance only raised more questions.

Stafford has a 17-28 career record, which in light of his recent contract extension, has caused people to criticize the Lions for giving big money to a player who is not a “winner.” There are legitimate reasons to criticize Stafford, so why would people fall back on statements like this? I’m sure Lions fans wish the team had won more games under Stafford, but that’s in the past. The real question — and the one faced by Lions management before giving him the extension — is whether his current career record has any predictive value when it comes to his future record.

Since 1960, there have been 77 quarterbacks [1]Because their first seasons as starters came after age 25, I decided to eliminate Jeff Garcia, Trent Green, Warren Moon, Kurt Warner, Ed Brown, Tony Romo, Mark Rypien, and Jim Kelly from this … Continue reading who started at least 25 games in their first four seasons and then 25 more games in years five through eight. There’s some survivor bias in the sample — if you stick around for 25+ starts in years five through eight, you’re probably a pretty good quarterback — but there’s not much we can do about that. If you run a regression using winning percentage through four years as your input and winning percentage in years five through eight as your output, you get the following best-fit equation:

0.450 + 0.20 * Old Win %

The correlation coefficient is a tiny 0.04, and the p-value on the “Old Win %” variable is 0.09. Putting aside the questions of statistical significance, there is no practical effect. Stafford has a 0.377 winning percentage, which means this formula would predict him to win 52.6% of his games from 2013 to 2016. Joe Flacco won 68.75% of his games in his first four seasons; this would say he should be expected to win 58.7% of his games in years five through eight. In other words, someone with a great winning percentage should be expected to win only one more game per season than someone with a terrible winning percentage. And that’s even assuming the results are statistically significant, which many would say they are not. [2]And, of course, it doesn’t mean that that one extra win is because of the quarterback. Presumably, like in the case of Flacco, those quarterbacks who win games early are on good teams, and … Continue reading
[continue reading…]

References

References
1 Because their first seasons as starters came after age 25, I decided to eliminate Jeff Garcia, Trent Green, Warren Moon, Kurt Warner, Ed Brown, Tony Romo, Mark Rypien, and Jim Kelly from this study.
2 And, of course, it doesn’t mean that that one extra win is because of the quarterback. Presumably, like in the case of Flacco, those quarterbacks who win games early are on good teams, and those teams are more likely to stay good than the bad teams.
{ 8 comments }

Long-time commenter Richie has been kind enough to create an Elo Ranking System where users can rank each of the 32 teams in the NFL. He’s hosting it on his site, but has come up with a Football Perspective-sounding url for us:

http://footballperspective.tooshay.us/teamrate.php

You can read more about how Elo Rankings work here, but the beauty is in its simplicity. All you need to do is answer one question: is Team A or Team B going to be better in 2013?

Vote early and often. The more results, the better. And please share with your friends. It will be fun to see what the wisdom of crowds tells us about team strength as we gear up for the 2013 season.

And a big thanks again to Richie for doing all the legwork!

{ 16 comments }

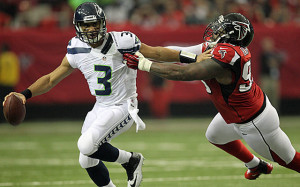
Wilson scrambles and gets credit for it.

Wilson scrambles and gets credit for it.

I hate passer rating. So do you. Everyone does, except for Kerry Byrne. Passer rating is stupid because it gives a 20-yard bonus for each completion, a 100-yard penalty for each interception, and an 80-yard bonus for each touchdown. In reality, there should be no (or a very small) weight on completions, a 45-yard weight on interceptions, and a 20-yard weight on touchdowns.

But let’s ignore those issues today. Reading Mike Tanier’s recent article inspired me to make see what passer rating would look like if we make three tweaks. I’m not going to change any of the weights in the formula, but just redefine the variables.

1) There’s no reason to exclude sack data from passer rating. I’ve stopped writing about how sacks are just as much (if not more) on the quarterback than other passing metrics, because I think that horse has been pretty well beaten by Jason Lisk and me.

2) Scrambles should be treated like completed passes. If Russell Wilson is about to be sacked, but escapes and run for 7 yards, why should that be treated any differently than if Peyton Manning is about to be sacked, but throws a seven-yard pass at the last second?

3) Lost Fumbles should be counted with interceptions. One could make a few advanced arguments here — we should use all fumbles instead of lost fumbles, or fumbles should be given an even stronger weight than interceptions (although consider that in light of this post), or that we should limit ourselves to just fumbles lost on passing plays. I’m going to play the simple card here, and just use lost fumbles data on the season level.

Passer rating consists of four metrics, all weighted equally: completions per attempt, yards per attempt, touchdowns per attempt, and interceptions per attempt. I will use the same formula with the same weights and the same variables, but redefine what those variables are. Here are the new definitions, with the additions in blue.

Completion percentage is now (Completions plus Scrambles) / (Pass Attempts plus Sacks plus Scrambles)

Yards per Attempt is now (Passing Yards plus Yards on Scrambles minus Sack Yards Lost) / (Pass Attempts plus Sacks plus Scrambles)

Touchdown Rate is now (Passing Touchdowns plus Touchdowns on Scrambles) / (Pass Attempts plus Sacks plus Scrambles)

Turnover Rate will replace Interception Rate in the formula, and is calculated as (Interceptions plus Fumbles Lost) / (Pass Attempts plus Sacks plus Scrambles)

The table below lists all of those metrics for the 32 quarterbacks who had enough pass attempts to qualify for the passer rating crown, along with Alex Smith and Colin Kaepernick, who just missed qualifying. Let’s look at the Robert Griffin III line.

He completed 258 of 393 pass attempts for 3200 yards, with 20 touchdowns and five interceptions. Those are the standard stats that make up passer rating, but he also took 30 sacks and lost 217 yards on those sacks. That makes Griffin’s numbers worse, but he also had 38 scrambles for 302 yards (which gets recorded as 38 completed passes for 302 yards), with no scramble touchdowns. Finally, he lost two fumbles. His new completion percentage is 64.2%, his new yards per attempt is 7.13, his new touchdown rate is 4.3%, and his turnover rate (which includes fumbles) is 1.5%. The final two columns show each quarterback’s passer rating under the normal system and their passer rating using these metrics, which I’ll call the FPPR for short.
[continue reading…]

{ 14 comments }

Last week, I examined the Chargers hiring of former Broncos offensive coordinator Mike McCoy. What I found was that, on average, teams that go outside the organization to hire offensive coordinators saw no uptick in offensive production in the new coach’s first season. And in general, the list consisted of a lot of uninspiring names.  The history of hiring defensive coordinators is a little more successful, at least according to the eyeball test. Chuck Pagano, Rex Ryan, Mike Smith, and Mike Tomlin are some of the more recent hires, and of course Bill Belichick’s work as defensive coordinator under Bill Parcells was the launch pad for two head coaching jobs.

This year, the only team that hired a defensive coordinator was Jacksonville, who tapped Gus Bradley as the Jaguars newest head coach. There’s an entirely new regime in Jacksonville (led by owner Shad Khan and general manager David Caldwell), but it’s hard not to view the Bradley selection in light of the team’s previous hire. In 2012, the Jaguars chose “hotshot” offensive coordinator Mike Mularkey, who was coming off a successful season as the coordinator of the great Falcons offense. A year later, the Jags are picking the defensive coordinator for the league’s top defense in 2012, at least as measured by points allowed.

The table below shows all of the instances I’ve identified since 1990 where a team hired a new head coach who had been a defensive coordinator for a different team in the prior year. Here is how the Bradley line reads. In 2012, Bradley was the Defensive Coordinator for Seattle; after the season, he was hired to become the head coach of the Jaguars. With the Seahawks, Bradley’s defense ranked 1st in points allowed, 4th in yards allowed, and 7th in PFR’s EPA allowed.
[continue reading…]

{ 3 comments }
Year QBrec Cmp Att Cmp% Yards TD TD% Int Int% Y/A Y/C PRate ESPN QBR Sk Yds NY/A ANY/A Sk%
2004 1-6-0 95 197 48.2 1043 6 3.0 9 4.6 5.3 11.0 55.4 13 83 4.57 3.21 6.2
2005 11-5-0 294 557 52.8 3762 24 4.3 17 3.1 6.8 12.8 75.9 28 184 6.12 5.63 4.8
2006 8-8-0 301 522 57.7 3244 24 4.6 18 3.4 6.2 10.8 77.0 25 186 5.59 4.99 4.6
2007 10-6-0 297 529 56.1 3336 23 4.3 20 3.8 6.3 11.2 73.9 27 217 5.61 4.82 4.9
2008* 12-4-0 289 479 60.3 3238 21 4.4 10 2.1 6.8 11.2 86.4 62.56 27 174 6.06 6.00 5.3
2009 8-8-0 317 509 62.3 4021 27 5.3 14 2.8 7.9 12.7 93.1 69.75 30 216 7.06 6.89 5.6
2010 10-6-0 339 539 62.9 4002 31 5.8 25 4.6 7.4 11.8 85.3 65.88 16 117 7.00 6.09 2.9
2011* 9-7-0 359 589 61.0 4933 29 4.9 16 2.7 8.4 13.7 92.9 59.39 28 199 7.67 7.45 4.5
2012* 9-7-0 321 536 59.9 3948 26 4.9 15 2.8 7.4 12.3 87.2 67.39 19 136 6.87 6.59 3.4
Career 78-57-0 2612 4457 58.6 31527 211 4.7 144 3.2 7.1 12.1 82.7 213 1512 6.43 5.94 4.6

In 2011, Eli Manning threw for 4,933 yards and won the Super Bowl. Last year, he threw for 3948 yards and missed the playoffs. It’s tempting to think that something was “wrong” with Manning last year. Another narrative would be that 2011 was a career year far out of line with anything else he’s done, which would make 2012 was the real Manning. I’m not sure I buy either of those explanations.

Let’s start by comparing Manning’s numbers in 2011 and 2012. Yes, his passing yards dropped, but that’s a meaningless metric on its own. He threw 53 fewer passes in 2012, a partial explanation for why his yards declined. And while his yards per attempt did drop from 8.4 to 7.4, about 20% of that dip was mitigated by the fact that he took fewer sacks (his Net Yards per Attempt dropped from 7.7 to 6.9). In addition to improving his sack rate, Manning’s touchdown and interception rates were virtually identical, which means his decline was limited to pass attempts and yards per attempt.

We can break down the numbers on why his yards per attempt declined thanks to some additional data courtesy of NFLGSIS. In 2011, Manning averaged 8.4 yards per attempt. That was a result of three things: a 61.0% completion rate, 5.82 yards after the catch (per completion), and 7.92 Air Yards per Completed Pass. In 2012, Manning averaged 7.4 yards per attempt, with a 59.9% completion rate, 4.33 average YAC, and 7.97 Air Yards per Completed Pass.

The tiny drop in completion percentage is more than offset by the better sack rate, and if Manning was throwing incomplete passes instead of taking sacks, that’s a good thing. As for what happens when he completed a pass, his entire decline was in the form of yards after the catch. In 2011, he ranked 3rd in Air Yards per Completed Pass and 6th in YAC per completion; in 2012, he ranked 2nd in AY/CP and 30th in YAC per completion.

Now there’s some evidence to indicate YAC might be more on the quarterback than Air Yards. Other studies, and what I think is popular opinion, is that YAC is more about the receiver than the quarterback. But let’s further investigate why the Giants dipped in YAC. The table below shows a more precise breakdown. For both 2011 (in blue) and 2012 (in red), you can see the number of Receptions, Air Yards per Reception, YAC per reception, and Yards per Reception. The rows show each of the Giants top three receivers, top tight end, and top running back, along with the other players at wide receiver, tight end, and running back.
[continue reading…]

{ 8 comments }

Fantasy Football: Expected VBD (FBG)

[Note: For the rest of the year, content over at Footballguys.com is subscriber-only.]

Over at Footballguys.com, I build upon Joe Bryant’s VBD and create the idea of Expected VBD. While VBD is a great way to understand the value of players, Expected VBD explains how we draft. This concept is why even though you may expect some kickers and fantasy defenses to perform well, you don’t take them early in the draft because they have low Expected VBDs. So what is Expected VBD?

Instead of drafting according to strict VBD, you should be drafting to something I’ll call Expected VBD, which is best defined by an example. Suppose Russell Wilson has three equally possible outcomes this year: he has a one-in-three chance of scoring 425 fantasy points, 325 fantasy points, and 225 fantasy points. Further, let’s assume that the baseline number of fantasy points at the quarterback position is 300 fantasy points.

We would project Wilson to score 325 points, which would be the weighted average of his possible outcomes. This means VBD would tell you that he is worth 25 points, because 325 is 25 points above the baseline. Expected VBD works like this: If Wilson scores 425 points, he’ll produce 125 points of VBD. If he scores only 325 points, he’ll be worth +25, and if he scores only 225 points, he’s going to have -125 points of VBD. In real life, players with negative VBD scores can be released or put on your bench. So if Wilson scores 225 points (probably due to injury), you’ll start another quarterback, roughly a quarterback who can give you baseline production.

So when Wilson scores 225 fantasy points, his VBD is 0, not -75. That means his Expected VBD would be (125+25+0)/3, or 50. Wilson’s VBD according to our projections may be only 25, but his Expected VBD is twice as large because Expected VBD does not provide an extra penalty for sub-baseline performances. Not surprisingly, different positions have different amounts of Expected VBD associated with them.

Below is the summary graph — it has quickly become one of my all-time favorite graphs — which shows the Expected VBD by each position according to Average Draft Position.

ExpectedVBDADP

I go into much more detail in the full article.

{ 10 comments }

Wes Welker and playing with two HOF QBs

Last summer, I wrote a post on the percentage of each player’s receiver yards that came from each quarterback. Aaron Schatz asked the following trivia question yesterday that made me think of that old post.

Wes Welker will become the fourth player to catch passes from both Tom Brady and Peyton Manning. Can you name the first three?

Click Show for the Answer Show


That got me to thinking about other players who have played with Hall of Fame quarterbacks. There are 23 modern era quarterbacks in the Hall of Fame. Brett Favre, Kurt Warner, Manning, Brady, and Drew Brees are Hall of Famers in spirit, and Aaron Rodgers isn’t far behind those guys. That’s 29: I threw in Ken Anderson to get us to an even 30.

I then checked to see how many players caught touchdown passes from more than one of those players. The most common pairings were from quarterbacks on the same team: Joe Montana and Steve Young (9), Norm Van Brocklin and Bob Waterfield (8), Sonny Jurgensen and Van Brocklin (6), and Favre and Rodgers (6).

But there were some pretty interesting ones on the list, too. Assuming Warner makes the Hall of Fame, Amp Lee will be the only player in NFL history to catch touchdowns from four Hall of Fame quarterbacks (Warner, Montana, Young, and Warren Moon). Currently, Lee is one of five players to catch passes from three quarterbacks in the Hall of Fame:
[continue reading…]

{ 3 comments }

The Redskins relied on rookies more than most

The Redskins relied on rookies more than most.

The Washington Redskins were powered by a pair of rookie stars in 2012. We all know about Robert Griffin III, but sixth round pick Alfred Morris finished second in the league in rushing. Griffin’s efficiency numbers were unmatched — he led the NFL in both yards per pass and yards per run — en route to 3200 passing yards and 815 rushing yards. Morris gained1,690 yards from scrimmage; add in Kirk Cousins‘ 466 passing yards and 22 rushing yards, and Washington rookies produced 6,193 “yards” in 2012. I put that in quotes because it’s not customary to sum players’ passing, rushing, and receiving yards, but I think that’s the right idea for the point of this post: figuring out which teams have most relied on rookies.

That 6,193 figure is the second most amount of “yards” produced by a group of rookies in NFL history. The leader in the clubhouse? The 2012 Indianapolis Colts, behind Andrew Luck, Vick Ballard, T.Y. Hilton, Dwayne Allen, Coby Fleener, LaVon Brazill and Dominique Jones. The third place spot belongs to the 2012 Cleveland Browns: Brandon Weeden, Trent Richardson, Josh Gordon, Travis Benjamin, Josh Cooper, and Brad Smelley combined for over 6000 yards.

What if we instead look at percentage of team yards (defining yards as the sum of all passing, rushing, and receiving yards)? Expansion teams would begin to dominate the list — some AFL teams in 1960, the ’68 Bengals, and the ’02 Texans, for example. But what if we look at only non-expansion teams since 1950?

In that case, the 2012 Colts come in second, behind another Colts team.
[continue reading…]

{ 4 comments }

How to Improve the NFL Network’s Top 100

For three straight years, NFL Network has produced a list of the Top 100 Players of 20xx. Many people have criticized the results, and this summary from Bill Barnwell hits on some of the main issues. But my issue isn’t with the mistakes the players may be making in the voting booth, but the mistakes made in tabulating the votes. I want to suggest to the fine folks at NFL Network an alternative method for deriving a list of the top 100 players. This method has three big advantages over the current process:

(1) It will take players only a few minutes — or as long as they like — to participate.

(2) More players will be part of the judging, since the time commitment will be lessened.

(3) The results will be more accurate.

Instead of asking players to write down a bunch of names from memory, my suggested method would involve asking them a bunch of simple and straightforward questions. Imagine a player sitting in front of a computer screen, and asked to pick an answer to each of the following:

That’s a lot better than the current system, described below by Mike Florio of Pro Football Talk:
[continue reading…]

{ 18 comments }

An ordinary hit

An ordinary hit.

Just about every article about Trent Richardson references his unimpressive 3.6 yards per carry average from last season. That stat is pretty meaningless, in my opinion. I suppose if you took a random running back from NFL history, and his YPC average in one random season was 3.6, and I knew nothing else about the player, I suppose I would probably assume that the running back was not (or was not going to become) a star. But Richardson isn’t a random running back from a database, because…

  • His 3.6 YPC average came on 267 carries, which represented 77% of all carries by Cleveland running backs
  • He was a rookie last year
  • He was a high first round pick

Since 1970, only 13 first round rookies have recorded 70% of all running back carries by their team. Two of those players were Richardson and Tampa Bay’s Doug Martin last year. Of that group, Richardson did post the lowest YPC average, but he was within 0.1 YPC of LaDainian Tomlinson. The next two lowest averages belong to Robert Edwards and Emmitt Smith; the former suffered a career-debilitating injury in a beach football game after his rookie season, while the latter ran for the most yards in NFL history.

Yeah, Richardson’s yards per carry average was well below average. But the universe of first round running backs who became workhorses right away as rookies and had a low YPC average consists of a HOF running back, a future HOF running back, and a player who suffered the flukiest of injuries. Richardson has something else in common with Emmitt Smith: after both of their rookie seasons, Norv Turner came on board as offensive coordinator.

But let’s say you don’t want to give Richardson any credit for his draft status. And you’re not in the mood to give him a pass just because he was a rookie. OK. Since 1990, 48 running backs have averaged fewer than 3.8 yards per carry while recording at least 70% of all running back carries for their team. Twenty-six of those players were at least 27 years old, and on the back half of their careers. Here are the other 22 running backs:
[continue reading…]

{ 22 comments }

Britt smoked the Eagles secondary

Britt smoked the Eagles secondary.

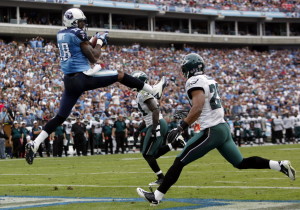
Kenny Britt’s story is hardly a secret. As a freshman at Rutgers in 2006, his 64-yard catch turned the tide in the biggest win in school history. The next year, he was part of a dynamic offense: Ray Rice rushed for 2,012 yards, Tiquan Underwood caught 65 passes for 1100 yards and 7 touchdowns, and Britt was the big play threat, gaining 1,232 yards and 8 touchdowns on 62 catches. In 2008, Britt caught 87 passes for 1,371 yards and 7 touchdowns. After his junior year, the dynamic college receiver made the obvious move and declared for the NFL Draft. He then watched his hometown Giants take Hakeem Nicks one pick before the Titans made Britt the first Rutgers player ever to be selected in the first round.

Before analyzing his NFL career, I think it’s important to remember that Britt is young for his class year: he played in his first NFL game before he was old enough to legally drink. Despite the young age, Britt didn’t disappoint, producing 701 receiving yards as a rookie in ’09. He even produced a signature moment, catching the game-winning touchdown pass from Vince Young in what was one of the greatest comeback drives of all time (no, really — I swear).

Britt’s 2010 season looks like modest improvement on the surface, but his 775 yards and 9 touchdowns don’t tell the full story. According to Pro Football Focus, Britt only ran passing routes on 253 snaps that season, but averaged a whopping 3.1 yards per route run, easily the highest rate in the league. The obvious follow-up question is why didn’t he run more routes? Well, the 2010 Titans were a run-heavy team centered around Chris Johnson; Tennessee finished 30th with just 474 pass attempts. Britt also missed nearly five full games with a hamstring injury, and Tennessee tended to place Nate Washington on the field in their 1-WR sets. Those seem like reasonable explanations for overlooking why a 22-year-old would play a limited number of snaps. The impressive part is his insane production.
[continue reading…]

{ 13 comments }

How did I end up with John  Hadl's helmet? It's actually a funny story

How did I end up with John Hadl's helmet? It's actually a funny story.

In 2011, Mike Mularkey and Joe Philbin were offensive coordinators for high-powered offenses. Those success seasons — on the backs of elite quarterbacks and wide receivers — were springboards for head coaching jobs in 2012. Mularkey’s work with Matt Ryan, Roddy White, Julio Jones, and Tony Gonzalez got him the top spot in Jacksonville, while Philbin (with an assist from head coach and play caller Mike McCarthy) parlayed big numbers from Aaron Rodgers, Jordy Nelson, Greg Jennings, Jermichael Finley, James Jones, and Randall Cobb into the Dolphins head coaching job. Mularkey, of course, was one-and-done with the Jaguars, while Philbin had an uneven first year in Miami.

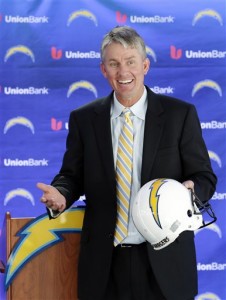
Mike McCoy’s work with Peyton Manning, Demaryius Thomas, and Eric Decker in 2012 (and Tim Tebow in 2011) helped him become the Chargers head coach in 2013. McCoy is one of three 2012 offensive coordinators who will be head coaches this season. [1]As for the other six head coaching changes? Doug Marrone (Syracuse) and Chip Kelly (Oregon) jump from college to Buffalo and Philadelphia, while Marc Trestman goes from Canada to Chicago. Gus Bradley … Continue reading The other two are are Bruce Arians (who goes from OC/interim HC/COTY in Indianapolis to Head Coach in Arizona) and Rob Chudzinkski (OC in Carolina, HC in Cleveland). I’m not sure if Arians really qualifies, but in any event, it’s McCoy who truly represents the “hot shot offensive coordinator –> head coaching job” rungs on the coaching ladder. His 2012 Broncos finished 2nd in points scored, 4th in yards, and 1st in both Net Yards per pass Attempt and Adjusted Net Yards per pass Attempt.

We’re working on our database of offensive coordinators, but it’s not 100% complete just yet. Let me know if I’ve missed any, but the table below represents all of the instances I’ve identified since 1990 where a team hired a new head coach who had been an offensive coordinator for a different team in the prior year. Here is how the McCoy line reads. In 2012, McCoy was the Offensive Coordinator for the Denver Broncos; after the season, he was hired to become the head coach of the Chargers. With the Broncos, his offense ranked 2nd in points, 4th in yards, and 1st in Adjusted Net Yards per Attempt.
[continue reading…]

References

References
1 As for the other six head coaching changes? Doug Marrone (Syracuse) and Chip Kelly (Oregon) jump from college to Buffalo and Philadelphia, while Marc Trestman goes from Canada to Chicago. Gus Bradley was the sole defensive coordinator hire, moving from Seattle to Jacksonville, while Andy Reid (Philadelphia to Kansas City) was the one “retread” hire. Sean Payton also moves from the naughty step back into the head coaching job in New Orleans.
{ 8 comments }

Trivia: NFL Head Coaches

In light of Shattenjager’s great post yesterday about Marion Campbell, I thought we should do some NFL head coach trivia today centered around losing.

Let’s start with a tough one. With 165 losses, which coach has lost the most games in NFL history?

Trivia hint 1 Show


Trivia hint 2 Show


Trivia hint 3 Show


Click 'Show' for the Answer Show

Obviously, there’s something to be said for losing a lot of games. That’s kind of like throwing the most interceptions in NFL history, a mark that Brett Favre holds. Let’s move on to a rate-based trivia question.

Which coach has the worst winning percentage in NFL history, minimum 50 games coached? It’s not Campbell or Joe Bugel, who at 30% are tied for the fourth worst record.

Trivia hint 1 Show


Trivia hint 2 Show


Trivia hint 3 Show


Click 'Show' for the Answer Show

What if we move to current coaches? Which of the 32 active head coaches has the most losses? No hints here:
[continue reading…]

{ 4 comments }

How did Marion Campbell keep getting hired?

Today you’re in for a treat, as frequent commenter Shattenjager has contributed an absolutely outstanding guest post.

Introduction: Question

Every time I have looked at Marion Campbell’s coaching career, a question has leapt to mind: How on earth did he keep getting jobs?

When Chase Stuart recently revisited Doug Drinen’s Dungy Index to measure coaches’ performances in the regular season compared to expectation, the man who appeared dead last in Wins over Expectation was former Falcons and Eagles head coach Marion Campbell, at a rather staggering -14.9. His teams essentially lost 15 more games than a linear regression based on Pythagorean winning percentage expected.

“So what?” you might think, “He was just a terrible coach.” I wouldn’t blame you for having that reaction. However, here’s what’s really fascinating about Marion Campbell: he had three separate head coaching stints.

Strictly looking at win-loss records is a poor measure of a coach, but it works well enough as a shorthand overview of Campbell’s career. He went 6-19 as the Atlanta Falcons head coach 1974-1976 after Norm Van Brocklin was fired during the 1974 season. Then, several years later, he took the head coaching job of the Philadelphia Eagles after Dick Vermeil famously stepped down due to burnout and promptly went 17-29-1 over the next three seasons before being fired again with one game remaining in the season. Just a year later, the Falcons—yes, the same Falcons who had already hired and fired Campbell as their head coach—decided that Campbell was the man to replace newly-fired Dan Henning. He rewarded them with an 11-32 run that ended with his retirement late in the 1989 season.

Again, how did he keep getting jobs? Well, it’s complicated, but I think an in-depth look at his career can explain it. [continue reading…]

{ 20 comments }
Previous Posts