≡ Menu

FCS Playoffs Preview

I’ll be honest: I know nothing about FCS football. But that’s what the SRS is for! If you want to read a real FCS playoff preview, SB Nation has a good one, as does the Sports Network, but let’s be honest, I have no idea how good those previews are. If you were to tell me that SB Nation just made up the name “Terrence West”, I couldn’t offer a counterargument.

That said, here is what the SRS says about the first round of the playoffs. Here’s how to read the table below: South Dakota State has an SRS rating of 30.1, the 8th best among FCS schools. In the first round of the playoffs, they go on the road to face Northern Arizona, which has an SRS rating of 23.5, the 27th best school in the FCS. As a result, the projected Margin of Victory – always shown from the perspective of the home team, is 3.6 points in the favor of the visitors. The table is sorted in terms of Game Quality, in case you need to determine which one of these games to watch. Game Quality is a proprietary statistic which meas… nah, even I’m not that crazy. The Game Quality rank is just a combination of the average SRS ratings of the two teams and the projected competitiveness of the game.

GQVisitorSRS RatingFCS RkHomeSRS RatingFCS RkProj MOV
1South Dakota St30.18Northern Arizona23.527-3.6
2Bethune-Cookman24.626Coastal Carolina27.5125.9
3Samford22.930Jacksonville St25.5215.6
4Furman18.943South Carolina St23.3297.4
5Southern Utah17.346Sam Houston St25.22310.9
6Lafayette16.352New Hampshire26.41613.1
7Sacred Heart15.354Fordham23.42811.1
8Tennessee St2524Butler8.973-13.1

[continue reading…]

{ 4 comments }

Checkdowns: How to Fix the Jets

What are the biggest problems facing the Jets? What should GM John Idzik do in the offseason? Should Rex Ryan be fired? Jets fan and friend of the program Jason McIntyre reached out to me, Jason of NYJetsCap.com and OvertheCap.com, and Brian Bassett of The Jets Blog for our thoughts.

One of the questions was whether Geno Smith was the quarterback of the future for the Jets. Here was my answer:

No question is harder than determining when to give up on a quarterback. There’s no right answer: give up too soon, and you miss out on Drew Brees; wait too long, and you have four years of Mark Sanchez. It’s not really “fair” to give up on a quarterback after one season, particularly one saddled with such a weak supporting cast. On the other hand, that’s exactly what the Jets did with Kellen Clemens. Drew Stanton was the 43rd pick in the draft and he’s started 4 games – is that “fair”?

My favorite part of Smith’s game is that (at least, when he’s not being neutered by the coaching staff) he’s a gunslinger at heart. Did you know that Smith’s average pass travels 9.7 yards in the air, the third highest number in the league? The average Smith completion travels 7.87 yards in the air and has 4.85 yards of YAC (which ranks only 24th); as a result, his 12.7 yards per completion ranks seventh in the league. I at least think there’s a chance that when his line is better and he has legitimate downfield weapons, he could be a very good quarterback. The issue, of course, is how long do you wait to find that out?

You can read the full article here.

{ 2 comments }

New York Times: Post-Week 12, 2013

This week at the New York Times, I analyze the Cardinals, the Steelers, and some record-setting points and yardage numbers.

Bruce Arians is doing it again. A year ago, he helped turn the Indianapolis Colts from the worst team in the N.F.L. in 2011 to a playoff team in 2012. Hired as the team’s offensive coordinator, he was named the Associated Press coach of the year for his work as the interim head coach after Chuck Pagano, who was found to have leukemia, took a leave of absence. The Arizona Cardinals hired Arians as their head coach after firing Ken Whisenhunt, and now Arians is a viable candidate for the same award with a different team.

After Kurt Warner retired in January 2010, Arizona’s passing attack crumbled. From 2010 to 2012, the Cardinals completed just 54.0 percent of all passes, the lowest rate in the league. Also, no team was sacked more often or threw more interceptions than Arizona. Arians was hired to fix an attack that was among the worst in the league, and while the team started slowly — Arizona began the year 1-2, then 3-4 — the Cardinals (7-4) have been red hot over the last month.

Over the last four games, quarterback Carson Palmer has completed 69.0 percent of his passes, averaged 8.9 yards per attempt and thrown 8 touchdowns and only 2 interceptions. Over that time, the team is averaging 30.25 points a game and is 4-0. And while Palmer and Larry Fitzgerald remain the stars in the desert, two young players have provided the missing spark to the offense.

You can read the full article here.

{ 1 comment }

Last year, I wrote about the best Thanksgiving Day Performances. Today, we get three games with serious playoff implications.

Green Bay (5-5-1) at Detroit (6-5)

Suh always does something nuts on Thanksgiving

Suh always does something nuts on Thanksgiving.

Come to see what Ndamukong Suh does this Thanksgiving, stay for a pivotal NFC North matchup. Matt Flynn gets the start in a must-win game for the Packers. Even if Aaron Rodgers returns next week and the Packers run the table, the Packers may still be left out in the cold with a loss today to the Lions. Beating the Packers would get the Lions to 7 wins, and Detroit will be favored in home games against the Ravens and Giants and in Minnesota in week 17. The good news for Green Bay? The last time Flynn started a game for Green Bay, it was against the Lions, and it went very well.

The game is nearly as important for the Lions. With a loss, Detroit would no longer control its own destiny for the NFC North title. Assuming the Bears beat the Vikings this weekend, the Lions would essentially be one-half game back of both Green Bay and Chicago (the Bears would be 7-5 but Detroit has the tiebreaker).  It’s not that hard to make up a half game in four weeks, but the Bears and Packers play in week 17. That means the winner of that game must lose one other game and Detroit would need to run the table in order to win the NFC North. Of course, the Lions could also get in as a 9-7 NFC North champ; the most likely path there is the Packers losing to the Bears and Cowboys, while Chicago loses in Philadelphia and to either the Cowboys at home or the Browns on the road. A loss today would be deadly for Green Bay, while a Detroit loss would put the Lions as the third-most likely team to win the division.

[continue reading…]

{ 3 comments }
It has not been a good week for these two

It has not been a good week for these two.

The game of the week 12 was obviously Brady/Manning XIV, and the Patriots comeback victory resulted in the second lowest Game Script by a winning team this year. Due to the big lead, Denver rushed 55% of the time, and Knowshon Moreno set NFL season-highs with 37 carries for 224 rushing yards. In regulation, the Broncos held an average lead of 10.5 points, although that still trails the Andrew Luck-fueled comeback by Indianapolis against Houston in week nine. The other big comeback in week 12 was by Cam Newton and the Panthers.  Carolina trailed 16-3 with one minute left in the second quarter in the 2nd quarter, but scored the final seventeen points of the game to steal the win from Miami.

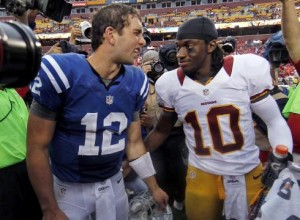
The biggest blowout of the week was by the Cardinals, who clobbered the Colts, 40-11.  Arizona led 34-3 entering the fourth quarter, and this was the second time this season Indianapolis has held an average deficit of 18+ points. That, in my expert opinion, is not good. Things are even worse for the team that selected after the Colts in the 2012 draft: for the second week in a row, Washington posted a Game Script of less than -9.0. I don’t have any desire to talk about the RG3 drama, but I will point you in the direction of this interesting article written by my former co-blogger.

Below are the Game Scripts data from week 12. I’ve highlighted the Vikings/Packers row in blue, since I know of no other way to shame both teams (you can move your cursor over that row to see it more clearly, not that I know why you would want to). [continue reading…]

{ 5 comments }

Analyzing every Joe Flacco interception this year

Flacco has had more downs than ups this year

Flacco has struggled to regain his Super form.

Over the course of his six-year career, Joe Flacco has generally done an excellent job at avoiding interceptions. Remember that quarterbacks are much more likely to be intercepted on deep passes, and Flacco tends to throw deep. Flacco has the 5th highest average length of pass this year according to NFLGSIS, after ranking 3rd in 2012, and 8th in 2011. But despite attempting more risky throws, Flacco posted better-than-average interception rates in each of his first five seasons. And he did that despite completion percentages that were often at or below league average.

Before the Super Bowl, I asked if Flacco was simply lucky to keep avoiding interceptions. That seemed like a good explanation for how an inaccurate passer who throws often downfield could have such a low interception rate. But other quarterbacks, like Donovan McNabb, sustained those traits for a long time.

This year, Flacco ranks in the top 7 in both interceptions and interception rate. So has lady luck simply switched allegiances? I looked at all 14 of Flacco’s interceptions this season to determine the cause.

1) Denver, 2nd quarter, 11:47 remaining, 3rd-and-9 from the Baltimore 16, trailing 7-0

Brandon Stokley is the primary receiver on the play. He’s lined up in the slot to Flacco’s left, and ends up running across the middle of the field at the first down marker. He’s in single coverage, but Flacco’s throw is a little short, and Chris Harris makes an outstanding play diving across for the interception. You can view the play here.
[continue reading…]

{ 10 comments }

Presented below, without comment, is a table of every matchup featuring Tom Brady & Peyton Manning as the starting quarterbacks. Enjoy:

DateHome TeamFavoritePatriots PassingColts/Broncos PassingAdvantageOutcome
2001-09-30NWECLT -11.513-23, 159 yds, 0 TD, 0 Int, 6.63 ANYPA25-43, 240 yds, 1 TD, 3 Int, 2.72 ANYPA+3.91, NWE44-13, NWE
2001-10-21CLTCLT -10.517-21, 262 yds, 4 TD, 0 Int, 16.29 ANYPA22-34, 305 yds, 1 TD, 0 Int, 8.55 ANYPA+7.73, NWE38-17, NWE
2003-11-30CLTCLT -3.526-35, 226 yds, 2 TD, 2 Int, 4.76 ANYPA29-48, 272 yds, 4 TD, 1 Int, 6.14 ANYPA+1.38, CLT38-34, NWE
2004-01-18 (C)NWENWE -3.522-37, 237 yds, 1 TD, 1 Int, 5.73 ANYPA23-47, 208 yds, 1 TD, 4 Int, 0.94 ANYPA+4.79, NWE24-14, NWE
2004-09-09NWENWE -326-38, 320 yds, 3 TD, 1 Int, 8.38 ANYPA16-29, 244 yds, 2 TD, 1 Int, 7.97 ANYPA+0.41, NWE27-24, NWE
2005-01-16 (D)NWENWE -118-27, 115 yds, 1 TD, 0 Int, 4.50 ANYPA27-42, 230 yds, 0 TD, 1 Int, 4.30 ANYPA+0.20, NWE20-3, NWE
2005-11-07NWECLT -325-40, 254 yds, 3 TD, 0 Int, 7.48 ANYPA28-37, 321 yds, 3 TD, 1 Int, 9.08 ANYPA+1.60, CLT40-21, CLT
2006-11-05NWENWE -2.520-35, 201 yds, 0 TD, 4 Int, 0.60 ANYPA20-36, 301 yds, 2 TD, 1 Int, 7.59 ANYPA+6.99, CLT27-20, CLT
2007-01-21 (C)CLTCLT -321-34, 226 yds, 1 TD, 1 Int, 5.74 ANYPA27-47, 330 yds, 1 TD, 1 Int, 6.10 ANYPA+0.36, CLT38-34, CLT
2007-11-04CLTNWE -521-32, 237 yds, 3 TD, 2 Int, 6.09 ANYPA16-27, 210 yds, 1 TD, 1 Int, 6.17 ANYPA+0.08, CLT24-20, NWE
2009-11-15CLTCLT -1.529-42, 364 yds, 3 TD, 1 Int, 8.61 ANYPA28-44, 316 yds, 4 TD, 2 Int, 6.80 ANYPA+1.81, NWE35-34, CLT
2010-11-21NWENWE -4.519-25, 178 yds, 2 TD, 0 Int, 8.38 ANYPA38-52, 396 yds, 4 TD, 3 Int, 6.56 ANYPA+1.83, NWE31-28, NWE
2012-10-07NWENWE -623-31, 193 yds, 1 TD, 0 Int, 6.09 ANYPA31-44, 324 yds, 3 TD, 0 Int, 8.35 ANYPA+2.26, DEN31-21, NWE
2013-11-24NWEDEN -2.534-50, 324 yds, 3 TD, 0 Int, 7.25 ANYPA19-36, 132 yds, 2 TD, 1 Int, 3.34 ANYPA+3.90, NWE34-31, NWE
{ 6 comments }

Oklahoma State won one for the Drinen

Oklahoma State won one for Drinen.

Every year, a few mind-blowing upsets occur this time of year, and every year, we are shocked when it happens. Three of the top five single game performances of the season occurred on Saturday, including the best individual game rating of the year. Oklahoma State’s blowout win against Baylor produced an SRS score of 88.5, topping Florida State’s win at Clemson by three points. Meanwhile, Arizona shocked Oregon, giving the Wildcats (82.9 score) just the third 80+ point SRS rating in a game in 2013. And in less exciting but still noteworthy news: Washington crushed Oregon State (#27 in last week’s SRS ratings) in Corvalis, 69-27.

It looks like we’re headed for a Florida State-Alabama showdown in the BCS National Championship Game. FSU’s last two games should not pose any issues: the Seminoles are rated 27 points higher than Florida, and will be a three-touchdown favorite in the ACC Championship Game. In fact, the difference between the ratings of Florida and Georgia Southern is smaller than the difference between Florida and Florida State (you can view the ratings of FCS teams here). And we’ll get to that Georgia Southern game in a minute.

For Alabama, the schedule is a little more challenging. The Tide are “only” 9 points ahead of Auburn in the SRS, but that’s a little misleading. If we remove Alabama’s games against Colorado State, Georgia State, Chattanooga, Kentucky, and Tennessee — all games the Tide won by over 21 points — their rating would jump to 64.4. For Auburn, the only team they beat by more than three touchdowns that lowered their rating was Western Carolina; do that, and the Tigers are at 52.9. That puts Alabama 11.5 points better than Auburn. The Iron Bowl is in Auburn this year, and the Tigers are 10.5 point underdogs, so perhaps the SRS is still underrating the Tide by a point or two. An SEC Championship Game against Missouri would be another tough test, but first, those Tigers must defeat Johnny Manziel and the Aggies to earn a trip to Atlanta.

Below are the SRS ratings through 13 weeks. As always, thanks to Dr. Peter Wolfe for providing the final scores for every college football game. [continue reading…]

{ 2 comments }

Non-FBS College Football Ratings Through 13 Weeks

Every week, I publish my college football ratings for FBS teams. To generate those ratings – using this methodology — my program also generates ratings for teams at all other levels.  This week, I will separate out the non-FBS teams based on their levels of play (instead of just lumping all non-FBS teams together). As always, thanks to Dr. Peter Wolfe for providing the final scores for every college football game.

Let’s start with the FCS schools:
[continue reading…]

{ 2 comments }
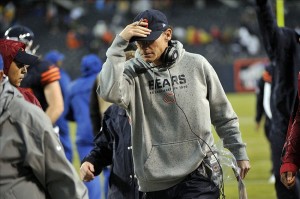
Trestman hides from the timeout police

Trestman hides from the timeout police.

In week 11, the Bears led the Ravens by three with two minutes remaining. After the two-minute warning, Joe Flacco completed an 11-yard pass that brought Baltimore to the Bears’ 16-yard line. The Ravens next snap took place with 1:21 remaining, and Ray Rice picked up 11 yards to put the Ravens at the Chicago 5-yard line with 75 seconds left.

Baltimore then let the clock run, snapping the 1st-and-goal play with 36 seconds left (Ray Rice ran for three yards). After waiting a few seconds, the Ravens called timeout with 23 seconds remaining. On second down, the Ravens ran Rice again, but he lost a yard, and Baltimore used its final timeout with 11 seconds left. Flacco’s third down pass went incomplete, and Baltimore kicked a field goal to force overtime, giving Chicago the ball back with just three seconds.

This was the rare case where both teams managed to lower their odds of winning with poor clock management. Baltimore had two timeouts and 36 seconds to run three plays. The worst option would be to call timeout after the 1st down and 2nd down plays: the goal should be to keep a timeout for after the third down play. By saving that timeout, the team retains the option of running on 3rd down, and also has a safety net in the event of a sack. There’s no reason why a team needs to call one timeout after 1st-and-goal and another after 2nd-and-goal. For a man who sleeps at the office to get every edge he can, John Harbaugh lowered his team’s odds of winning by not knowing when to use his timeouts. This is not just an academic point, either: Flacco nearly lost the third down snap, which could have ended in an embarrassing loss for the Ravens. [1]Also, the predictable run-run-pass playcalling won’t win Harbaugh any awards, either. A second down pass to the end zone solves all of these problems, too.

But Harbaugh’s poor use of timeouts — while inexcusable — didn’t lower his team’s odds of winning significantly. That task was handled by Marc Trestman. After Rice ran down to the 5-yard line, Trestman should have called timeout with 75 seconds remaining — instead, he allowed Baltimore to run the clock all way to 36 seconds left (Baltimore snapped it with 3 seconds left on the play clock). On that play, Rice nearly ran for a touchdown, which shows how foolish this decision was by Trestman. The mere fact that Baltimore bled the clock for 39 seconds is prima facie evidence that the Bears erred by not calling timeout. Football is a zero-sum game, so if it was good for Baltimore to let the clock run down, it must have been bad for Chicago to allow the Ravens to do that. Think of it this way: would Ravens fans have been happy or sad to see Trestman call timeout in that situation?

The interesting part of this situation is we actually got to find out what Trestman was thinking. Adam Hoge transcribed the head coach’s Monday press conference, where he said:
[continue reading…]

References

References
1 Also, the predictable run-run-pass playcalling won’t win Harbaugh any awards, either. A second down pass to the end zone solves all of these problems, too.
{ 3 comments }

Comparing the schedules of Ohio State and Baylor

In the unlikely event that either Alabama or Florida State drop a game, Ohio State and Baylor will each have very good arguments that they deserve to move into the top two of the BCS standings. Through 12 weeks, Baylor ranks higher than Ohio State in the SRS ratings thanks to a higher margin of victory and strength of schedule. But I want to delve into the SOS argument a little bit more today.

First, let’s just assume each team wins out, even though that’s no sure thing. Ohio State defeated Indiana today, but still must beat Michigan and Michigan State. Baylor plays Oklahoma State tonight, and then has Texas Tech and Texas to close the year. But let’s assume both schools finish the year undefeated: who will have faced the harder schedule?

Baylor plays every team in the Big 12 — giving the Bears 9 conference games — and faced Buffalo, an FCS school, and a Sun Belt school (Louisiana-Monroe). Ohio State will also play 9 conference games, including the Big 10 championship — and conveniently also played Buffalo and an FCS school, along with a Mountain West team (San Diego State), and California.

We can obviously throw out the games against Buffalo and the FCS school. Louisiana-Monroe ranks 106th and Cal ranks 96th, so those two games are a wash. Since beating San Diego State (78th in the SRS) is nothing special, picking between Baylor and OSU predictably turns into a referendum on the Big 12 and Big 10. So let’s look at the SRS ratings of each of the conference opponents and San Diego State for the Buckeyes and Bears.

Here’s how to read the first line. The toughest opponent for Baylor (after adjusting for home field) is Oklahoma State, who Baylor plays tonight in Stillwater. The Cowboys have an SRS rating of 54.8. The toughest opponent for Ohio State was Wisconsin, who the Buckeyes played at home, and the Badgers have an SRS rating of 57.4. After accounting for home field, that means Baylor’s toughest game was 3.4 points harder than Ohio State’s (54.8 + 3 – (57.4 -3) ).

RkBaylor OpponentH/RSOSOSU OpponentH/RH/RDiff
1Oklahoma StRoad54.8WisconsinHome57.43.4 (Baylor)
2Kansas StRoad49.1Michigan StIndianapolis47.84.3 (Baylor)
3OklahomaHome46.3MichiganRoad42.72.3 (OSU)
4TCURoad40.1NorthwesternRoad38.61.5 (Baylor)
5Texas TechArlington42.4IowaHome43.42.0 (Baylor)
6TexasHome44.3IndianaHome39.35.0 (Baylor)
7West VirginiaHome34.6IllinoisRoad334.4 (OSU)
8KansasRoad27.7Penn StateHome36.52.9 (OSU)
9Iowa StHome29San Diego StHome31.22.2 (OSU)
100PurdueRoad19.9----

By this measure, Baylor’s toughest two games were harder than Ohio State’s toughest two games (although if you ignore home field, you’d argue that Ohio State faced the toughest opponent). Ohio State gets credit for having the third toughest game, but at each of the next three slots, the Bears have the SOS edge.

At the bottom of the schedule, the Buckeyes pick up some ground, but I don’t think the back end of the schedule is the appropriate mechanism to separate national title contenders. Yeah, Illinois, Penn State, San Diego State and Purdue is a tougher set than West Virginia/Kansas State/Iowa State, but any elite team should have no problem sweeping those games.

It’s very close, but if Baylor wins out, I’d vote for Baylor over Ohio State. The Bears clearly have the edge if you take style points into consideration, but even if you ignore margin of victory and all the statistics, I still think Baylor’s season is more impressive.  It’s close, but I’d say that an average great team would have had a harder time going undefeated against Baylor’s schedule than it would against Ohio State’s schedule.

{ 2 comments }

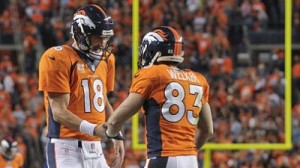
Denver has scored at a historic rate

Denver has scored at a historic rate.

Today’s insane statistic comes courtesy of RJ Bell: the difference between Denver and the #2 team in points per game is larger than the difference between the #2 and #31 teams. The Broncos are averaging 39.8 points per game this season, 11.6 points more than the (surprisingly second-ranked) Bears. And Chicago is averaging just 9.9 more points per game than the Jets, the #31 ranked scoring team.

That is, well, crazy. The record for points per game in a season is 38.8, set by the 1950 Rams. The 2007 Patriots are second at 36.8, and both of those teams scored slightly more points through ten games than the 2013 Broncos. So while Denver is on pace to break the scoring record, some regression to the mean over the final six games should be expected.

If the Broncos want to set the record for most points scored relative to the second highest scoring team in the league, Peyton Manning and company have some work to do. That mark is held by the ’41 Bears, who averaged 36.0 points per game, 12.5 more than the Packers that year. Second and third on that list are the ’07 Patriots (8.4) and ’50 Rams (8.3), so Denver has a realistic shot of setting the modern record.

I’ll be honest: as dominant as the Broncos offense has been, I’m a little surprised to see them so far ahead of the competition in points scored. After all, consider:

  • The Eagles have just 19 fewer yards than the Broncos, and Nick Foles actually leads Manning in both passer rating and Adjusted Net Yards per Attempt;
  • In PFR’s Expected Points Added, the Broncos offense is at 14.7 EPA-added per game, while the Saints offense is at 11.3. That’s a relatively small difference considering the fact that Denver has scored 12.1 more points per game than New Orleans.
  • The Chargers have a higher completion percentage than the Broncos and six fewer turnovers, but have averaged 17 fewer points per game.
  • The Packers are actually a hair ahead of Denver in yards per play (6.3531 to 6.3529), but have scored two fewer touchdowns per game.

So what’s going on? I’m perfectly fine with Denver being general run-of-the-mill dominant, but the team’s points scored numbers makes it seem like the Broncos might be the greatest offensive machine ever. I think I’ve identified the two reasons to explain the gap:

Red Zone success

Philadelphia has scored a touchdown just 46% of the time the Eagles made it into the red zone, which ranks 28th in the league. San Diego isn’t much better at 50% (22nd). The Saints are at 52.5% (20th), and the Packers are down at 30th at 43%. So some excellent offenses are really struggling in the red zone, which gives them disproportionately low points per game averages. Oh, and Denver? They’re at 79.1%, by far the highest rate in the league. It’s not unusual for a great offense to dominate in the red zone — the ’07 Pats were at 70% — but what is unusual is seeing the other top offenses struggle there.

I have red zone data going back to 1997, and the highest ever performance was set by Kansas City in 2003. The Trent GreenPriest HolmesTony Gonzalez Chiefs scored a touchdown on 77.8% of all red zone opportunities (42 out of 54), so the Broncos (34 out of 43) could break that record this year. More likely, though, is that the Broncos go from otherworldly in the red zone to just great, which would drop the team’s points per game average.

Number of Drives

The Broncos are averaging 2.85 points per drive, while the Saints are #2 at 2.46. That’s not a huge difference — the gap between #2 and #7 is slightly bigger. The difference, as you can deduce, is that the Broncos are averaging 13 drives per game while the Saints are at just 11.3 drives per game. Why is that? New Orleans’ average drive takes 2:56 minutes, the third-longest in the league (and San Diego is #1 at 3:13), while the Broncos are in the bottom five at 2:17 (the Eagles are last at 2:02). That Chip Kelly edge is erased, though, because Philadelphia’s opponents average 2:48 per drive, the third highest rate in the league. Denver’s opponents take just 2:18 per drive, the third lowest (just a second ahead of Detroit and eight seconds longer than Kansas City).

The Broncos defense is not great, but it does rank 6th in completion percentage allowed. Combine that with the fact that Denver ranks 4th in percentage of opponent plays that are passes, and incomplete passes occur on 25% of all plays run by Broncos opponents, the second-highest rate in the league behind Kansas City. That’s not surprising for a team with such a high Game Script, but it does stop the clock from running for long stretches, which gives Denver’s offense more possessions The Chargers are 28th in this statistic (18%), which is one reason why San Diego is dead last in offensive drives (10.2 per game).

But there’s another reason why Broncos’ opponents tend to have short drives: Denver leads the league in 20+ yard plays allowed at 54. As a result, teams don’t end up with many clock-chewing drives against Denver: opponents tend to gain big yards quickly or throw incomplete passes. That increases the number of drives for the Broncos, which (one could argue) inflates the success of the team’s offense. It’s all relative, of course — Denver is still #1 in points per drive by a wide margin — but it’s worth recognizing that Denver has scored 75% more points per game than an average of the other 31 teams, but “just” 62% more on a per-drive basis. That accounts for about 3 points per game. Add in the insane success in the red zone, and the lack of success there by the other top teams, and you have the reasons for the crazy stat at the top of today’s post.

Manning Record Watch Update

After six games, I analyzed how likely Manning was to break the single-season touchdown record. At the time, he had 22 touchdowns, and the formula projected him to throw 2.99 TDs/G the rest of the way to finish with 52 touchdowns, narrowly breaking Tom Brady’s record.

Now? Manning has 34 touchdowns, as his pace has only slightly declined. What does that mean? To calculate Manning’s odds using Bayes Theorem we need to know four things:

1) His Bayesian prior mean (i.e., his historical average): 2.38, as this number wouldn’t change from the original post.

2) His Bayesian prior variance (the variance surrounding his historical average): Again, no change here, so we use 0.0986.

3) His observed mean: Instead of 3.667, we will use 3.4.

4) His observed variance: This one involves just a little bit of work. What I suggested we do last time is calculate the number of passing touchdowns per game Manning averaged in the first six (now ten) games of each season since 2000, along with his average over the rest of the season (then, 8-10 games, now, 4-6 games). Then we take the difference of the variances of each column, as we did in step two.

YearTD/G Thru 10ROY GTD/G ROYDiff
20002.1620.1
20011.861.330.47
20021.961.330.57
20031.961.670.23
20043.552.80.7
20052420
2006261.830.17
20071.653-1.4
20081.751.8-0.1
20092.143-0.9
2010262.17-0.17
20122.462.170.23
Variance0.220.31

Manning’s variance over the rest of the season is 0.3052 TDs/G, while his variance through ten games is 0.2214; the differential there is 0.0838, which is the variance of our current mean.

Once you have your number for these four variables, then you substitute those numbers into this equation:

Result_mean = [(prior_mean/prior_variance)+(observed_mean/observed_variance)]/[(1/prior_variance)+(1/observed_variance)]

Or, using our numbers:

[(2.38 /0.0986) + (3.4 / 0.0838)] / [(1/0.0986) + (1/0.0838)]

which becomes

[24.14 + 40.57] / (22.08) = 2.93

This picture will never get old

This picture will never get old.

After averaging 3.667 TDs/G over 6 games, we projected Manning to average 2.99 TDs/G the rest of the year. Since he averaged “only” 3 touchdowns per game over his next four games, we downgrade him from 2.99 to 2.93. Of course, we already had a significant regression factored into his future projection — we dropped him by 0.67 TDs/game from his average, which is the point of using Bayes Theorem. So while he’s at “only” 3.4 TDs/G on the season after 10 games, since he’s played at that level for longer, he only loses about half a touchdown per game over his projection the rest of the way.

That gives Manning 17-18 touchdowns, which puts him at a season-ending projection of 51-52 touchdowns. He’s still more likely than not to break the record, although obviously this analysis ignores lots of elements like strength of schedule. And with a visit to Kansas City and a game against the Titans (who have allowed a league-low 7 touchdowns through the air), perhaps he’s actually an underdog to even tie Brady at 50.

{ 3 comments }

Last week brought us the most lopsided game of the year. The games were more competitive this week, with the largest Game Script belonging to Tampa Bay (yes, Tampa Bay) at 14.0. The Philadelphia-Washington game provides a good example of the information conveyed — and not conveyed — by Game Scripts. Philadelphia won by 8 points, but that would be misleading if you thought it was a close game throughout: the Eagles held an average lead of 12.8 points. On the other hand, Game Scripts don’t necessarily tell you how lopsided the game was: Washington had the ball with a chance to tie, at the Eagles’ 27-yard line, with 54 seconds remaining. The Eagles came away with a very low Moral Margin of Victory (5.8) but a high Game Script, with neither bit of information being right or wrong. On one hand, Philadelphia’s Win Probability was over 85% for the final 2.5 quarters, but it was also a game where Washington was not really out of it until the final seconds. I prefer a toolbox with lots of different tools over trying to find one do-it-all device.

Here are the week 11 Game Scripts data:

WinnerH/RLoserBoxscorePFPAMarginGame ScriptPassRunP/R RatioOp_POp_ROpp_P/R Ratio
TAMATLBoxscore41281314263840.6%462069.7%
PHIWASBoxscore2416812.8293346.8%383750.7%
BUFNYJBoxscore37142312.3293843.3%332260%
SEAMINBoxscore41202110.2222844%363252.9%
DENKANBoxscore2717108.1403553.3%482466.7%
CINCLEBoxscore4120218.1283147.5%601975.9%
NYGGNBBoxscore2713147.4392461.9%341964.2%
OAK@HOUBoxscore282355.5343152.3%512170.8%
CARNWEBoxscore242043.1302455.6%422562.7%
MIASDGBoxscore201641.9382065.5%372658.7%
ARI@JAXBoxscore2714131.6452465.2%441673.3%
PITDETBoxscore3727101.5462763%482466.7%
NORSFOBoxscore23203-0.5442365.7%342260.7%
CHIBALBoxscore23203-3.4332556.9%344145.3%
IND@TENBoxscore30273-4.6373253.6%302455.6%

[continue reading…]

{ 3 comments }

Fullback Report

The best exercise for fullbacks? One-handed push ups

The best exercise for fullbacks? One-handed push ups.

In May, I discussed how and why the fullback was being slowly phased out of the game. Some of the main reasons are:

  • The increase in the size of defensive linemen has made running up the middle less attractive.
  • The blocking fullback has been replaced by the slot receiver: A great blocking fullback will take a linebacker out of the play, but an average slot receiver will take a linebacker off the field.
  • Tight ends are now among the most athletic players in the game, and the fullback is essentially a shorter, slower, tight end. Teams aren’t looking to leave a multi-dimensional tight end or a slot receiver off the field for a six-foot lead blocker.
  • The pass-catching fullback is the option of last resort for an offense, not an element of design. No offensive coordinator is spending his time thinking about how he can get the ball into the hands of his fullback more often.
  • Fullbacks are being diverted into other career paths: a fast high school fullback becomes a running back, a tall fullback becomes a tight end, and a strong fullback puts on weight to become a linebacker.

But enough about theory: let’s analyze how teams are using fullbacks in today’s NFL, courtesy of Pro Football Focus. Let’s break the teams down into tiers:

Fullbacks need not apply: Arizona, Philadelphia, Denver, Dallas, Detroit, Cincinnati, and Miami

The Cardinals and Eagles have not had a fullback on the field this season. Philadelphia runs a lot of three-wide receivers sets with DeSean Jackson, Riley Cooper, and Jason Avant, and LeSean McCoy and/or Bryce Brown are always on the field. Add tight ends Brent Celek and Zach Ertz see significant playing time, too. You could classify James Casey as a fullback (PFF labels him a tight end), but he has just 60 snaps this year. For Arizona, tight ends Jim Dray, Rob Housler, Kory Sperry, Jake Ballard, and even D.C. Jefferson get on the field in lieu of any fullbacks. Head coach Bruce Arians does not see much of a need for a fullback, as Robert Hughes had just 28 snaps in Indianapolis last year.

Dallas, Denver, and Detroit all use 3-WR/1-TE as their base personnel, and little changes even when those teams are leading. Dallas will put TEs James Hanna and Gavin Escobar on the field with Jason Witten in run-heavy sets, and backup linebacker Kyle Bosworth is responsible for all 9 snaps taking by a Cowboys fullback this year. Wes Welker and Julius Thomas are textbook examples of why the fullback is becoming extinct. Welker’s prowess as a slot receiver far exceeds the value any fullback could add, while Thomas is the type of athletic superfreak teams are finding to play at tight end. Virgil Green, Joel Dreessen, and Jacob Tamme see time when the Broncos want to run, and defensive tackle Mitch Unrein (8 snaps) is the only fullback Denver has used. For the Lions, Joseph Fauria (and, prior to his release, Tony Scheffler) is used when the Lions want more blockers on the field, and the team will occasionally put Reggie Bush and Joique Bell on the field together, too, leaving just two snaps this season for fullback Montell Owens.

[continue reading…]

{ 6 comments }

New York Times: Post-Week 11, 2013

Eight teams fired their head coaches last year. How are those eight coaches doing in 2013? And will there be more firings next year because of the Reid effect? That’s what I’m writing about this week at the New York Times.

Andy Reid may be the worst thing to happen to struggling coaches. In 2012 under Romeo Crennel, the Chiefs appeared to be a talented team but finished 2-14. Even the biggest Kansas City optimists could not have expected the addition of Reid and quarterback Alex Smith to turn the Chiefs into a Super Bowl contender overnight. But Reid has all but locked up the coach of the year award and engineered one of the great turnarounds in league history. If general managers break close calls in favor of replacing their coaches in the off-season, call it the Reid effect.

Chip Kelly, who replaced Reid in Philadelphia, has done a superb job, too. The 2012 Eagles were a 4-12 team that relied on fourth-quarter comebacks to win each of those games. Philadelphia had an inconsistent offense and a terrible defense, which caused ownership to make the splashy hiring of the off-season by bringing in Kelly from Oregon.

The Eagles’ offense has come close to matching the hype that surrounded Kelly’s arrival. Philadelphia is in the top 10 in yards and points per game, and the Eagles are the only team to rank in the top three in both yards per pass attempt and yards per carry. Quarterback Nick Foles has 16 touchdown passes and no interceptions and leads the league in yards per pass attempt, and LeSean McCoy leads the N.F.L. in yards from scrimmage.

You can read the full article here.

{ 1 comment }

Another way to do team rankings

Wonders what good quarterback play looks like

Wonders what good quarterback play looks like.

The Jets lost by 40 points to the Bengals in Cincinnati; adjust for home field, and that is still a 37-point adjusted margin of victory, the best single game for the Bengals this year.

New York lost by 23 in Buffalo this weekend; that 20-point adjusted MOV was the best single game for the Bills this year.

Back in week four, the Jets lost by 25 in Tennessee, and as you can probably guess, that is the best single game for the Titans this year.

And in week six, at home against the Steelers, New York lost by 13, and that 16-point adjusted MOV was the top performance for Pittsburgh this year.

That’s pretty bad, of course. Four different teams had their best games of the season against the Jets. The only team that’s been worse is the Jaguars, who have seen five different opponents (San Francisco, San Diego, Kansas City, Indianapolis, and Arizona) post their best games against Jacksonville. But the Jets were close to matching the Jaguars: Tampa Bay’s best game of the year came on Sunday against Atlanta, making the Bucs’ second best performance in 2013 the game against the Jets in week 1. [1]How can the 2-8 Bucs have had only one game better than their loss to the Jets? Because Tampa Bay lost in New York by 1, which is an adjusted MOV of +2, while their home win against Miami of 3 points … Continue reading
[continue reading…]

References

References
1 How can the 2-8 Bucs have had only one game better than their loss to the Jets? Because Tampa Bay lost in New York by 1, which is an adjusted MOV of +2, while their home win against Miami of 3 points gets an adjusted MOV of 0.
{ 10 comments }

Week 12 College Football SRS Ratings: Auburn Stays Alive

Entering week 12, there were 7 teams with legitimate paths to the national championship. The four undefeated teams came in with cupcake games, while two of the three one-loss teams had tough challenges. So what happened?

  • Alabama was a 23-point favorite at Mississippi State (53rd in the week 11 SRS ratings). It wasn’t pretty, but the Crimson Tide left Starkville with a 20-7 win.
  • Florida State also simply needs to win out, and the Seminoles hosted Syracuse (69). FSU was a 37.5-point favorite, and the game wasn’t even that close. After one quarter, Jameis Winston was 10 for 10 for 170-yards, and the Seminoles were up 28-0, en route to a 59-3 win. That was the largest win of the week, and gives FSU four of the top nine single-game SRS scores of the season.
  • Behind the undefeated behemoths of the SEC and ACC are undefeated teams in two other major conferences: the Big 10 and Big 12. Ohio State was a 33.5-point favorite in Illinois (#74), while Baylor was a 27.5 point favorite against Texas Tech (#41) in Arlington. Ohio State jumped out to a 28-0 lead against Illinois, and won 60-35, but the game got a little close in the middle. It was only 35-21 in the third quarter, and 44-28 in the 4th, but Carlos Hyde and Braxton Miller (combined 40 carries for 430 yards and 5 touchdowns) were too much for the Illini to handle.
  • Baylor fell behind 14-0 early, but still managed to cover the spread after winning 63-34. After the hot start from the Red Raiders, the Bears scored 8 touchdowns in the next 36 minutes of game time. Quarterback Bryce Petty “struggled” in this game, which means he only completed 17 of 31 passes, but still picked up 335 yards and three touchdowns (to go along with two rushing scores). So far, the Bears have been up to the challenge as the meat of the schedule arrived in November, although the toughest test comes next week in Stillwater. The crazy part is that if it wasn’t for West Virginia, this Oklahoma State-Baylor game would be as hyped as any Big 12 game in recent memory: two explosive offenses, two undefeated teams, a B12 title and a possible BCSNCG berth on the line.
  • Three one loss teams were also knocking on the door. Stanford had the hardest SOS through 11 weeks of any team with no more than one loss, and the Cardinal owned the best win (as measured purely by SOS) of any team in the country. Stanford traveled to Los Angeles to face a USC team (#20) that had gone 4-1 since interim head coach Ed Orgeron took over for Lane Kiffin. Stanford was a 3.5-point favorite over the Trojans, but a strong fourth quarter gave USC the win. Kevin Hogan threw two late interceptions, and kicker Andre Heidari hit a 47-yarder in the final minute, completing the upset for Coach O and the Trojans. We can officially rule Stanford out of the BCS race, and absent any upsets, pencil in Oregon-Ohio State in the Rose Bowl.
  • Two one-loss SEC teams entered week 12 with quasi control-their-own-destiny fates. Missouri and Auburn know that winning out means an SEC championship and a win over Alabama. No one really knows if that would be enough to vault them into the BCS National Championship Game, but for idle MIZZOU, the debate will have to wait another week (the bye week comes at an opportune time, with Ole Miss and Johnny Manziel and Texas A&M coming up the next two weeks).
  • Auburn was a three-point home favorite against Georgia (#25), and got off to a hot start, outgaining Georgia 149 to 4 and grabbing a 10-0 lead after the first quarter. With 10 minutes left, the Tigers led 37-20, but three touchdowns in eight minutes — the last on a run by Aaron Murray on 4th-and-goal that just barely (if at all) got in — gave Georgia a 38-37 lead. All looked lost, until on 4th and 18, Nick Marshall threw a 73-yard touchdown to Ricardo Louis on the play of the year.

It didn’t take the straightest route, but after week 12, the national picture barely changed. The Iron Bowl in two weeks will be the de facto SEC West Championship Game, but more importantly it could be a quarterfinal matchup for the national title. The winner of Alabama/Auburn goes to the SEC Championship Game, which — if Missouri wins out — may be a de facto semifinal game. Whether a one-loss Auburn/Missouri gets in over an undefeated Baylor or Ohio State is tough to say, of course, although both of those teams could have a loss by then. And don’t worry: if either set of Tigers can upset Alabama, we will surely hear about how dominant the SEC is, which is very hard to argue.
[continue reading…]

{ 3 comments }

Non-FBS College Football Ratings Through 12 Weeks

Every week, I publish my college football ratings for FBS teams. To generate those ratings – using this methodology — my program also generates ratings for non-FBS team.  So let’s take a look at the ratings through twelve weeks for all non-FBS teams. After posting the ratings, I’m going to dip my toe into the Butler/Marist debate. As always, thanks to Dr. Peter Wolfe for providing the final scores for every college football game. [continue reading…]

{ 7 comments }

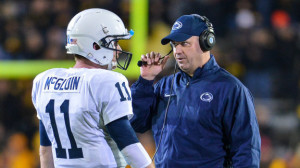
O'Brien teaches McGloin how to throw a football

O'Brien teaches McGloin how to throw a football.

Two weeks ago, Jeff Tuel became the Buffalo starting quarterback after Thaddeus Lewis (who was replacing an injured EJ Manuel) couldn’t play against the Chiefs due a ribs injury. Today, former Penn State quarterback Matt McGloin will start for the Raiders, as Terrelle Pryor will miss the game against the Texans due to an injured knee.

This is a mind-boggling development for fans of college football. McGloin was a walk-on at Penn State who co-starred with four-star recruit Rob Bolden in one of the least-competent quarterback battles in recent memory. In 2010 and 2011, the duo seemingly alternated every other week, which was about how long it took for one of them to lose the job. Among the 90 quarterbacks who threw for at least 3,000 yards over that two-year period, McGloin ranked 87th in completion percentage. Then, Bill O’Brien arrived, and McGloin turned into a real quarterback, and led the Big 10 in both passing yards and passing touchdowns.

McGloin joins Tuel, Max Hall, and Matt Moore as the only undrafted free agent rookies to start a game at quarterback in the last ten years. The table below is a bit overinclusive: it includes all undrafted quarterbacks who started a game during the first season in which they played a game. That’s not quite the same thing as starting as a rookie, of course, but it’s the best I can do. Brock Berlin, for example, went undrafted in 2005, so he wouldn’t count, but he appears on the list below. To help you filter through the “sat around for a few years but didn’t get into a game/played in another league” issue, I’ve included an age column.
[continue reading…]

{ 2 comments }

The NFC is stronger than the AFC, as expected

The expectation entering this year was that the NFC was the deeper and stronger conference than the AFC. That was certainly my expectation as well. Last year in the AFC, every team that had a winning record made the postseason. The NFC went 39-25 against the AFC teams, and the middle class of the AFC had plenty of questions.

That was the introductory paragraph to this article by Jason Lisk after week three of the season. Lisk was not alone in favoring the NFC — most observers felt the same way, and I said as much in my thoughts from the gut on NFC and AFC teams back in April. But when Lisk wrote that article, the AFC had gone an incredible 11-3 against the NFC. Here is how they did it:

WkDateWinnerH/RLoserPFPAWin CLos C
109/08Chicago BearsCincinnati Bengals2421NFCAFC
109/08New York JetsTampa Bay Buccaneers1817AFCNFC
209/15Denver Broncos@New York Giants4123AFCNFC
209/15San Diego Chargers@Philadelphia Eagles3330AFCNFC
209/15Buffalo BillsCarolina Panthers2423AFCNFC
209/15Kansas City ChiefsDallas Cowboys1716AFCNFC
309/22Seattle SeahawksJacksonville Jaguars4517NFCAFC
309/22Chicago Bears@Pittsburgh Steelers4023NFCAFC
309/22Cincinnati BengalsGreen Bay Packers3430AFCNFC
309/22Cleveland Browns@Minnesota Vikings3127AFCNFC
309/22Indianapolis Colts@San Francisco 49ers277AFCNFC
309/22Miami DolphinsAtlanta Falcons2723AFCNFC
309/19Kansas City Chiefs@Philadelphia Eagles2616AFCNFC
309/22New England PatriotsTampa Bay Buccaneers233AFCNFC

[continue reading…]

{ 3 comments }

The SEC is a dominant 8-6 against BCS teams

This year, the SEC is 8-6 against BCS conferences, courtesy of:

  • A 2-2 record against the AAC (South Carolina over Central Florida, Texas A&M over SMU; Kentucky lost to Louisville and Arkansas lost to Rutgers);
  • A 2-2 record against the ACC (Alabama over Virginia Tech; South Carolina over North Carolina; Clemson over Georgia, Miami over Florida)
  • A 1-0 record against the Big 10, courtesy of a Missouri victory over Indiana
  • A 2-1 record against the Big 12 (Ole Miss over Texas and LSU over TCU, while Oklahoma State beat Mississippi State)
  • A 1-1 record against the Pac-12 (Auburn over Washington State, Oregon over Tennessee)

But if we want to do an honest analysis, we should recognize that the AAC is a BCS conference in name only: those schools are 4-12 against the other BCS conferences and Notre Dame/BYU (for the rest of this post, I will refer to ACC, Big 10, Big 12, Pac-12, SEC, Notre Dame and BYU as BCS teams), and even that is misleading. Louisville, Central Florida, and Houston are the only AAC teams in the top 70 of the SRS. Outside of Louisville and Central Florida, the AAC is 1-12 against BCS teams, with the sole win being coming when Cincinnati beat Purdue (#110 in the SRS).

So let’s leave out the AAC and just look at how the ACC, B10, B12, P12, SEC, and Notre Dame/BYU have done in games against each other.

ConfACCB10B12SECP12INDTotal
ACC--0-21-02-20-22-15-7
B102-0--1-00-12-32-27-6
B120-10-1--1-20-01-12-5
SEC2-21-02-1--1-10-06-4
P122-03-20-01-1--1-27-5
IND1-22-21-10-02-1--6-6

[continue reading…]

{ 2 comments }

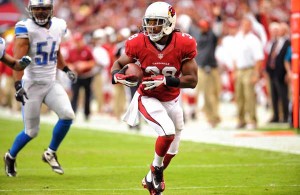
Ellington races for a long touchdown

Ellington races for a long touchdown.

Arizona is one of many teams in the NFL employing a running back by committee philosophy, but no team — now, or at any point in modern history — allocated time quite like the Cardinals. Through nine weeks, Rashard Mendenhall has 105 rushes for 323 yards, giving him a miniscule 3.1 yards per carry average. Mendenhall arrived in the desert this offseason, as part of a reunion with new Cardinals head coach Bruce Arians. The duo worked together for three years in Pittsburgh, where Mendenhall rushed for 3,309 yards and 29 touchdowns and averaged 4.2 yards per carry. But Mendenhall hasn’t been close to the best back added this offseason, as Clemson’s Andre Ellington — a sixth round of the 2013 Draft — has 388 yards this year on 54 carries. Thanks to his spectacular 7.2 yards per carry average, he has outgained Mendenhall despite seeing roughly half as many carries.

How crazy is it for one back in a committee to average more than four more yards per carry than the other back? I ran the following query for every team since 1970:

  • First, I noted the two running backs who recorded the most carries for each team
  • Next, I eliminated all running back pairs where the lead back had over 150 more carries than the backup.
  • I also eliminated all pairings where the lead back was a lead back in name only due to injury to the starter (otherwise, years where Maurice Jones-Drew and Darren McFadden ranked second on their team in carries would be inappropriately included). To do that, I deleted sets where the “lead” back — defined as the back with the most carries — averaged fewer carries per game than the second running back.

After running through those criteria, the table below shows all situations where the backup averaged at least one more yard per rush than the lead back. As always, the table is fully searchable and sortable. It is currently sorted by the difference between the YPC average of the backup and the starter, but you can sort by year to bring the recent instances to the top.
[continue reading…]

{ 8 comments }

Big Red

Big Red.

Kansas City is 9-0. Denver is 8-1. As far as resumes go, it’s hard to beat this matchup. But is it the best ever?

You can’t just average Kansas City’s 100% winning percentage with Denver’s 88.8% rate, since a matchup of teams with 3-0 records (like New Orleans-Miami earlier this year) would produce a better average winning percentage. One simple method would be to use Neil’s method of deriving a team’s “true winning percentage”, which adds 5.5 wins and 5.5 losses to each team’s record. At 3-0, a team has a true winning percentage of only 0.607, so this method rewards teams that have had longer stretches of success. Do the math, and Kansas City has a 0.725 true winning percentage, while Denver is at 0.675. That gives this game an even 0.700 average true winning percentage. So where does that rank?

Pretty darn high. Last year, the highest average true winning percentage in a game was at 0.674, occurring when the 11-2 Texans faced the 10-3 Patriots in that letter jacket game. Denver-Kansas City will be just the fifteenth game since World War II where the two teams have an average true winning percentage of at least 0.700. [1]Five pre-WW II games show up: In 1926, the 11-0-2 Bears lost 7-6 to the 12-1-1 Frankford Yellow Jackets. In the last game of that season, a 14-1-1 Frankford tied a 10-2-1 Pottsville Maroons. Three … Continue reading Let’s look at the first 14, ranked in order of average true winning percentage:
[continue reading…]

References

References
1 Five pre-WW II games show up: In 1926, the 11-0-2 Bears lost 7-6 to the 12-1-1 Frankford Yellow Jackets. In the last game of that season, a 14-1-1 Frankford tied a 10-2-1 Pottsville Maroons. Three years later, the 9-0-0 Packers traveled to New York and beat the 8-0-1 Giants, 20-6. In 1934, the 10-1 Lions lost 19-16 at home against the 11-0 Bears. A week later, the 10-2 Lions went to Chicago and lost 10-7 to the 12-0 Bears.
{ 4 comments }

Austin and the Rams blew out the Colts

Austin and the Rams blew out the Colts.

We have a new leader in the clubhouse for most lopsided game of the season. The St. Louis Rams pulled off one of the biggest blowouts by a heavy underdog in league history in week ten, defeating the Colts in Indianapolis, 38-8. In the process, the Rams also held an average lead of 23.2 points, the largest Game Script score of the season.

Indianapolis kept it close early, and the only first quarter score came via the St. Louis defense. On that play, Robert Quinn — who with 12 sacks through 10 games, is a legitimate Defensive Player of the Year candidate — stripsacked Andrew Luck, and Chris Long picked up the fumble and raced 45 yards for the touchdown. Incredibly, the Colts are lucky this game wasn’t even more one-sided. Late in the first quarter, Kellen Clemens and Zac Stacy botched the exchange on a handoff on the goal line with the Rams looking to go up 14-0, and Indianapolis recovered to end the scoring threat. That didn’t set back the Rams for long, however, as St. Louis scored 21 points in the third quarter to take a 28-0 lead into the locker room. Tavon Austin — who had a day for the ages — scored in the third quarter to give St. Louis a 35-0 lead early in the third quarter, effectively ending any hopes for another Luck comeback.

Three teams lost with positive Game Scripts in week 10, but unlike in week nine, there were no big comebacks, as all three games were back-and-forth affairs.  The Panthers won with the worst Game Script of the week, holding an average deficit of 2.6 points against the 49ers. San Francisco jumped out to a 9-0 early, but Carolina eventually won 10-9 on a late field goal. Since I wrote about how the 3-9 Panthers were about to turn things around, Carolina has gone 9-3. In an unrelated note, I recently injured my hand on my back.

The table below shows the Game Scripts data from week 10:
[continue reading…]

{ 19 comments }

New York Times: Post-Week 10, 2013

This week at the New York Times, I talk about the shocking development that follows after a bad offensive line loses two of its starters:

Off the field, the Richie IncognitoJonathan Martin dispute has dominated the headlines in Miami. On the field, the absence of the two allowed the Tampa Bay Buccaneers defensive line to dominate the Dolphins offense on Monday night.

Entering the game, no team in the N.F.L. had rushed for fewer than 18 yards this season, and no Dolphins team had ever rushed for fewer than 7 yards in a game. But those records were pushed aside Monday as Miami rushed 14 times for 2 yards against Tampa Bay in a 22-19 loss, the lowest production by an N.F.L. team on the ground since 2007.

Miami’s offensive line has been a weakness all year, making the team ill-prepared to replace the two men who started most of the season on the left side of the line. The absence of Incognito, a left guard, was particularly notable on one of the key plays of the game. Early in the second quarter, Miami called a run play to Daniel Thomas with the ball at the team’s 1-yard line. Tampa Bay linebacker Lavonte David shot into the backfield immediately after the snap, running free between the center and the backup left guard to tackle Thomas for a safety.

Those 2 points, combined with the extra point Miami eschewed for a failed 2-point conversion attempt later in the game as a result of the safety, provided the final margin in the game.

The Dolphins had a chance to win the game in the final minutes, but the offensive line again let the team down. Trailing by 3 with two minutes left, quarterback Ryan Tannehill was sacked on consecutive plays, thwarting the team’s comeback. Those were the only two sacks of the game, but the team’s pass blocking has been a problem all year, even when Martin and Incognito were in the lineup.

You can read the full article here, which closes with a review of the playoff picture in both conferences.

{ 0 comments }
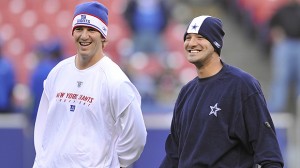
Can you believe we get to play in the NFC East?

Can you believe we get to play in the NFC East?

Let’s pretend that each team in the NFC East is equal in strength. That’s probably not true, of course, but I wan to stipulate that Eli Manning = Robert Griffin III = Tony Romo = Nick Foles, and that goes for the other 52 players on each of their teams, too. If that’s the case, the schedules will play a big role in determining the eventual champion.

The Cowboys and Eagles are tied atop the division at 5-5, with Dallas having the easiest remaining schedule (opponents have a 0.435 winning percentage) and Philadelphia having the second easiest (0.472). Washington (0.508) and New York (0.533) are both 3-6, with even more challenging schedules the rest of the way than the two division leaders.  But I think it’s instructive to look at the schedules in a different way.

As you know, each team plays six games against the other three teams in the division. Of the remaining ten games, eight are the same — and this year, they come against the AFC West and NFC North. The final two games of the season are what I’ll call “Strength of Schedule” games, as they are determined by each team’s rank in the division in 2012. That means Washington, the #1 team in the division in 2012, is scheduled to play last year’s division winners from the NFC South and NFC West, the #2 team gets the runners up from those divisions, and so on. Let’s start there, because these “SOS” games already put one team behind the eight ball.

In the tables below, I’ll put a 1 in the cell if the team won the game, a 0 to represent a loss, and a 0.5 to indicate that the game has not yet been played.
[continue reading…]

{ 7 comments }

Last week, the top five was Florida State, Baylor, Oregon, Alabama, and Arizona State. Florida State won big (by 56), while Baylor and Alabama won big games (against Oklahoma and LSU) by comfortable margins. Arizona State won by a point at Utah, an underrated team (despite the record, Utah ranks 24th in the SRS). Of course, the big story of the week was Stanford (who lost to Utah earlier in the year) upsetting Oregon. Oregon understandably will drop in the rankings, but this late in the season, one game doesn’t swing the SRS nearly as much. After all, each game is given the same weight. Oregon gets credited with a 50.7 SRS score for losing in Palo Alto, which essentially says for one game, the Ducks were about the 20th best team in the country. Alabama gets 69.9 points for defeating LSU at home by 21. But while the Crimson Tide move up, and moves the Ducks down, Alabama did not pass Oregon in the SRS.

Say what? Yes, the SRS still has FSU, Baylor, and Oregon ahead of Alabama. I’ll explain more in a minute, but first, the SRS ratings through eleven weeks. As a reminder, you can read about the methodology here. As always, thanks to Dr. Peter Wolfe for providing the final scores for every college football game.
[continue reading…]

{ 1 comment }

Non-FBS College Football Ratings Through 11 Weeks

Every week, I publish my college football ratings for FBS teams. To generate those ratings – using this methodology — my program also generates ratings for non-FBS team.  So let’s take a look at the ratings through eleven weeks for all non-FBS teams. As always, thanks to Dr. Peter Wolfe for providing the final scores for every college football game. [continue reading…]

{ 0 comments }

Tavon Austin’s Record Setting Day

Fisher is introduced to Tavon Austin

Fisher is introduced to Tavon Austin.

The Tavon Austin breakout game is here. First, the #8 pick in the 2013 draft returned a punt off a bounce 98 yards for a second quarter touchdown. A few minutes later, Kellen Clemens hit him for a 57-yard touchdown pass. With St. Louis up 28-0 in the third quarter, Austin caught an 81-yard touchdown.

The third score made him just the 8th player in NFL history with three touchdowns of 50+ yards in the same game, joining Chris Johnson, Qadry Ismail, Randy Moss, Freddie Solomon, Gale Sayers, Billy Cannon, and Raymond Berry. That also means Austin has 236 yards of touchdowns today, the most of any player since 1970.

In fact, that’s the second most in NFL history. The table below shows all 78 players from 1940 to 2012 who recorded at least 160 yards worth of touchdowns in a single game.
[continue reading…]

{ 1 comment }

Benford’s Law in the NFL, Part II

Sometimes the best blog posts are ones that remind you of things you’ve forgot. Seven years ago, Doug wrote about Benford’s Law. Also known as the First Digit Law, it has been observed across many data sets, from street address to lengths of rivers to stock prices to the number of followers people have on twitter. A new Applied Economics Letters article states that “nonconformity with Benford’s law can be a useful indicator of poor data quality, which may be a result of fraud or manipulation.”

So what the heck is it? According to Wikipedia, this phenomenon

refers to the frequency distribution of digits in many (but not all) real-life sources of data. In this distribution, the number 1 occurs as the leading digit about 30% of the time, while larger numbers occur in that position less frequently: 9 as the first digit less than 5% of the time. Benford’s Law also concerns the expected distribution for digits beyond the first, which approach a uniform distribution.

For example, 131 players have caught a touchdown this year. As it turns out, the distribution pretty closely matches what Benford’s Law would predict:

Digit    #    Perc
1      39    29.8%
2      34    26.0%
3      29    22.1%
4      11     8.4%
5      6      4.6%
6      4      3.1%
7      5      3.8%
8      2      1.5%
9      1      0.8%

You might think that part of that is just an artifact of where we are in the year, and that may be true: a bunch of players have only one touchdown reception. Then again, Jimmy Graham is the only player with double digit touchdowns, and that’s likely to change, too. But as Doug noted, one of the neat things about Benford’s Law is that it (subject to some caveats) is unit agnostic. For example, what if we look at receiving touchdowns per minute of game time? Graham has played in eight games; if we assume 60 minutes for each game, that means Graham has scored 0.0208 receiving touchdowns per minute. That counts as a two (ignore the leading zeroes); if we do that for all 131 players, we get the following distribution:
[continue reading…]

{ 0 comments }
Previous Posts