≡ Menu

Last year, I provided a starting point for my running back projections. The idea is pretty simple: some fantasy statistics are much more repeatable, or sticky, than others. Over at Footballguys.com, I used the following formula to help isolate those factors:

1) Rushing Yards (R^2 = 0.47). The best-fit formula to predict rushing yards is:

-731 + 3.73 * Rush Attempts + 180 * Yards/Rush

2) Receptions (R^2 = 0.42). The best-fit formula to predict receptions is:

11.1 + 0.39 * Receptions + 0.032 * Receiving Yards

3) Receiving Yards (R^2 = 0.38). The best-fit formula to predict receiving yards is:

83.7 + 1.65 * Receptions + 0.46 * Receiving Yards

4) Rushing Touchdowns (R^2 = 0.29). The best-fit formula to predict rushing touchdowns is:

0.1 + 0.0037 * Rushing Yards + 0.35 * Rushing Touchdowns

5) Receiving Touchdowns (R^2 = 0.23). The best-fit formula to predict receiving touchdowns is:

0.1 + 0.0022 * Receiving Yards + 0.25 * Receiving Touchdowns

Using these formulas, we can come up with a good starting point for your 2014 running back projections.

You can read the full article here.

{ 5 comments }

Let’s get the disclaimer out of the way: the traditional draft value chart is outdated, and it never made much sense in the first place. Trying to use logic to explain why teams operate in an illogical manner is a tall task, and probably a waste of time. So, let’s try anyway.

First, I recreated my draft value chart. To do that, I looked at the first 224 players selected in each draft from 1970 to 2009. PFR assigns Approximate Value grades to each player in each season, but since AV grades are gross units, we need to tweak those numbers to measure marginal value. As a result, I only gave players credit for their AV above two points in each season; that difference is a metric I’m defining as a player’s Marginal AV. For example, if a player has AV scores of 8, 1, and 3 in three straight years, those scores are translated into Marginal AV scores of 6, 0 and 1.

The graph below shows the average Marginal AV produced by each draft pick in each season from ’70 to ’09. The blue line shows the average Marginal AV produced by draft picks as rookies, the red line represents second-year players, green is for year three, purple for the fourth season, and orange for average Marginal AV in year five. [continue reading…]

{ 8 comments }

First Season in a New Stadium

This year, the Vikings will play their home games at the University of Minnesota’s TCF Bank Stadium. The Metrodome is no longer, and Minnesota will play outdoors for two years before moving into a new indoor facility in 2016.

Should we expect the Vikings to struggle in 2014 in their temporary home? This scare piece noted that since the merger, only four teams (excluding those that moved cities) have played games in a temporary stadium for at least one season, and those teams saw an average decline of 5.8 wins. That’s a pretty misleading statistic, though. Consider:

  • One of the teams included was the 2005 Saints, who dropped from 8 to 3 wins as the team played “home” games in Baton Rouge, San Antonio, and uh, East Rutherford following Hurricane Katrina. I don’t think the 2005 Saints are an appropriate comparison for any team.
  • Another team was the 2002 Chicago Bears, who played in Champaign, Illinois while Soldier Field was being remodeled. The 2001 Bears were one of football’s great flukes: Chicago’s win probability added in the 4th quarter and overtime of games was one of the highest ever. Jim Miller and Shane Matthews led five 4th quarter comebacks. The Bears were 27th in yards per carry, allowed more net yards per pass than they gained, and yet went 13-3. Safety Mike Brown scored interception return touchdowns in overtime in consecutive weeks. And then the Bears promptly went 4-12 in 2002.
  • The 1973 Giants are another team used in the study. New York used to play in Yankee Stadium, which as you may know was primarily a baseball park. On September 30th, 1973, the stadium closed for renovations for two (baseball) years. Of course, that meant it would be closed for nearly three football years: the Giants played the rest of ’73 and all of 1974 at the Yale Bowl in Connecticut; in 1975, the Giants shared Shea Stadium with the Jets, just as the Yankees were doing with the Mets.

[continue reading…]

{ 7 comments }

Bradford had a lot of surrounding talent in Norman.

Bradford had a lot of surrounding talent in Norman.

Do players get too much credit when teammates make them look good? Take Johnny Manziel. In the last thirty years, no quarterback has had teammates around him drafted so highly. Last year, his left tackle (Luke Joeckel) was the second pick in the draft. This year, his new left tackle (Jake Matthews) was the sixth pick in the draft and his talented wide receiver went immediately after. That’s three top seven picks from his offense in two drafts. Does this means, perhaps, that Manziel was riding those players’ coattails? Or is it Manziel who helped make his teammates look better?

The first round quarterback with the closest comparable surrounding college talent — a left-handed former Florida QB drafted in 2010 — doesn’t appear to be a very promising comparison. Tim Tebow’s top wide receiver was drafted 22nd overall (Percy Harvin) in 2009, and successive linemen Pouncey brothers were drafted in the top 20 the next two years (Maurkice went #18 in 2010 and Mike #15 in 2011). [1]And he had a talented tight end go in the fourth round in 2010, too. Like Tebow, he is also no longer playing football. Let’s move on. Tebow is obviously very different from Manziel, most notably in lacking the important skill for a quarterback of being able to throw a football well. But Tebow may have looked better as a college player in part because of the great talent around him, a situation which may be similar to Manziel.

In general, does having better college teammates cause QBs like Manziel to be overvalued in the draft? Or, do better QBs cause their college teammates to be overdrafted? To check these ideas out, I compared how draft picks performed in their first five years (according to PFR’s Approximate Value) relative to their expected value given their draft position. [2]I did this by running a regression of a player’s value in the first five years on a fifth-order polynomial in draft position. This is pretty much the same thing as looking at the value a player … Continue reading I then compared performance relative to expectation for players who had the benefit of teammates who were drafted in the first round to those who weren’t so lucky. The results are certainly not what I expected: by the end of this post, it might be Bucs fans who worry the most that they overvalued a high pick in the 2014 draft.

Quarterbacks

I first considered the value above expectation (VAE) for quarterbacks drafted in the first three rounds since 1984. It looks like having a lineman drafted in the first round either in the same or subsequent draft has no clear impact on the QB’s VAE. Those QBs who played with first-round linemen do about 1.8 points worse in VAE than QBs (relative to a baseline of 22.2), but this difference isn’t close to being distinguishable from zero. [3]The p-value is 0.70

Here’s the list of QBs from the first three rounds who had at least one lineman drafted in the first round of the same or subsequent draft. [4]All analysis in this post ignores the supplemental draft. The VAE for the last few entries is missing because those players have not finished their first five seasons. Keep in mind that the VAEs cannot be too low for third-round picks like Bobby Hoying, since little was expected of them given their draft position.

QuarterbackYearVAESchoolOL
Boomer Esiason198441.3MarylandRon Solt
Chuck Long1986-18.7IowaMike Haight
Todd Marinovich1991-21.2USCPat Harlow
Matt Blundin1992-19.2VirginiaRay Roberts
Billy Joe Hobert1993-8.4WashingtonLincoln Kennedy
Rick Mirer1993-5.8Notre DameAaron Taylor
Kerry Collins1995-6.8Penn St.Jeff Hartings; Andre Johnson
Todd Collins1995-10MichiganTrezelle Jenkins
Bobby Hoying1996-9.6Ohio St.Orlando Pace
Charlie Batch199814.9East. MichiganL.J. Shelton
Eli Manning20049.5MississippiChris Spencer
Brian Brohm2008-15.7LouisvilleEric Wood
Chad Henne20086.4MichiganJake Long
Matt Ryan200837.9Boston Col.Gosder Cherilus
Sam Bradford20100OklahomaTrent Williams
Tim Tebow20100FloridaMaurkice Pouncey; Mike Pouncey
Andrew Luck20120StanfordDavid DeCastro
Ryan Tannehill20120Texas A&MLuke Joeckel
Russell Wilson20120WisconsinKevin Zeitler; Travis Frederick

There are definitely some classic failures on this list, notably Todd Marinovich, but there are some big successes, too. And, for the more recent QBs, Andrew Luck and Russell Wilson will more than balance out Tebow. Overall, there’s little reason to think getting to play with a first-round lineman causes QBs to be overdrafted in general. As a result, Manziel critics may not have much support if they want to point to Matthews and Joeckel as the reason for Manziel’s college success.

But what about the presence of Mike Evans? Does having an elite wide receiver or tight end mean that a QB might be overvalued in the draft? I ran a separate regression looking at whether having a first-round WR/TE predicts a QB to succeed or flop relative to his expectation. Here, there’s more reason to think there might be something going on, but there is still not clear evidence that teammates make the QB. Part of this is just the relatively small number of QBs with first-round WR/TEs in the sample. On average, QBs with first-round WR/TE teammates in college do 6.5 points worse relative to expectation than other QBs. That gap is still indistinguishable from zero, however. [5]p = .20

Below are the QBs since 1984 who had at least one WR/TE teammate in the same or following year drafted in the first round.

QuarterbackYearVAESchoolWR/TE
Vinny Testaverde1987-4.5Miami (FL)Michael Irvin
Tony Sacca1992-17.7Penn St.O.J. McDuffie
Rick Mirer1993-5.8Notre DameIrv Smith
Kerry Collins1995-6.8Penn St.Kyle Brady
Kordell Stewart199519.9ColoradoMichael Westbrook
Bobby Hoying1996-9.6Ohio St.Terry Glenn; Rickey Dudley
Peyton Manning199840.5TennesseeMarcus Nash
Marques Tuiasosopo2001-14.2WashingtonJerramy Stevens
Chris Simms2003-2.3TexasRoy Williams
Matt Schaub200410.9VirginiaHeath Miller
JaMarcus Russell2007-30.5LSUDwayne Bowe; Craig Davis
Sam Bradford20100OklahomaJermaine Gresham
Brandon Weeden20120Oklahoma St.Justin Blackmon
Robert Griffin20120BaylorKendall Wright
Geno Smith20130West VirginiaTavon Austin

The repeats from the earlier list who were blessed with great help both on the line and at WR/TE were Rick Mirer, Kerry Collins and Sam Bradford. [6]All of those first-rounders were actually TEs (Irv Smith, Kyle Brady and Jermaine Gresham, respectively), although Collins also threw to a second-round WR in Bobby Engram. As you can see, Peyton Manning swings this upwards, but JaMarcus Russell swings it down just as much. Both of those would seem to be anecdotes that fit the story of teammates potentially inflating another player’s perceived value, with the QB inflating the WR (the instantly forgotten Marcus Nash) in Manning’s case and the WR (Dwayne Bowe) perhaps inflating the QB in Russell’s case.

Overall, though, it’s unclear whether WRs in general tend to inflate their QBs, making them overvalued in the draft. The effect size is substantial and just three of the 11 QBs have positive VAE, but it could be driven by random chance given the small sample size. [7]Kordell Stewart is one of those three and he did play a little WR in his first few years, too, but almost all of his value was at QB Given what I find below for predicting WR success, I suspect that the Manning-Nash example may happen more often than the Russell-Bowe situation.

Wide Receivers

Do great college quarterbacks cause NFL talent evaluators to reach for their wide receiver and tight end teammates? It seems like the answer to this question might be yes. Receivers selected in rounds 1-3 who come from schools with first-round QBs drafted the same or following year do 6.4 points worse relative to expectation from their draft position. Here, we have more data and the results are statistically significant that having a first-round college QB has led to their wide receivers being overvalued in the draft. [8]The p-value for this effect is .01 WRs drafted in the first three rounds without a top QB generated an average value in their first five years of 17.6, so the predicted drop in value is down to about 11.2. Having a first round QB thus predicts a WR gets taken a little more than a round too early. [9]For wide receivers, I estimate 17.6 as being the expected value generated by about the 46th pick, with 11.2 the expected value generated by the 89th pick

In fact, from 1984 to 2009, only 20% of the round 1-3 WR/TEs who played with first-round QBs had a positive VAE.

WR/TEYearVAESchoolQB
Jonathan Hayes1985-11.9IowaChuck Long
Flipper Anderson198817.3UCLATroy Aikman
Mike Bellamy1990-16.9IllinoisJeff George
Derek Brown1992-26.7Notre DameRick Mirer
Irv Smith1993-14.9Notre DameRick Mirer
Cory Fleming1994-10.4TennesseeHeath Shuler
Malcolm Floyd1994-7.9Fresno St.Trent Dilfer
Tydus Winans1994-9.8Fresno St.Trent Dilfer
Kyle Brady1995-20.4Penn St.Kerry Collins
Bryan Still1996-10.9Virginia TechJim Druckenmiller
Joey Kent1997-15.7TennesseePeyton Manning
Marcus Nash1998-21.1TennesseePeyton Manning
Patrick Johnson1998-8.7OregonAkili Smith
Kevin Johnson199910.6SyracuseDonovan McNabb
Jabar Gaffney2002-1.1FloridaRex Grossman
Reche Caldwell20022.7FloridaRex Grossman
Taylor Jacobs2003-16.2FloridaRex Grossman
Mike Williams2005-25.8USCMatt Leinart
Anthony Fasano2006-2.3Notre DameBrady Quinn
David Thomas2006-2.5TexasVince Young
Dominique Byrd2006-10.7USCMatt Leinart
Maurice Stovall2006-6.1Notre DameBrady Quinn
Craig Davis2007-15.1LSUJaMarcus Russell
Dwayne Bowe200713.4LSUJaMarcus Russell
Fred Davis2008-2.3USCMark Sanchez
Jordy Nelson200812.8Kansas St.Josh Freeman
Juaquin Iglesias2009-10.1OklahomaSam Bradford
Mohamed Massaquoi2009-2.9GeorgiaMatthew Stafford
Patrick Turner2009-10.4USCMark Sanchez
Percy Harvin200917FloridaTim Tebow
Jermaine Gresham20100OklahomaSam Bradford
Coby Fleener20120StanfordAndrew Luck
Justin Blackmon20120Oklahoma St.Brandon Weeden
Kendall Wright20120BaylorRobert Griffin

And at least one of the successes on this list is an exception that fits the broader idea. Percy Harvin played with a QB who just maybe was a slight reach as a first round pick. It’s hard to think that Tim Tebow made Percy Harvin look good. [10]I’d argue the same for Dwayne Bowe and JaMarcus Russell, but Russell at least was a legitimately excellent passer in 2006 At least based on these results, having a great college QB has caused wide receivers to be drafted much too highly over the last thirty years.

Conclusion

So it seems like Bucs fans might have more to worry about than Browns fans. The evidence is unclear on whether QBs such as Manziel generally become overvalued from playing with first-round receiver talent, although there might be something going on there. But the evidence is much clearer that WRs such as Evans become overvalued from playing with premier college QBs. Perhaps it’s not surprising from what we know about the NFL that there’s a pretty good chance that Manziel’s excellence helped inflate Evans’s value.

Of course, the last example of a 6’5 receiver drafted in the top ten who played with a first-round Heisman-winning QB doesn’t bode well for Evans, either. [11]The similarities don’t stop there. Mike Williams is listed at 229 lbs and ran a 4.56 40 at the combine. Evans is at 231 and ran a 4.53. And they’re both named Mike. And while Evans will likely still be in the NFL after six years unlike Mike Williams, it is likely that he would have gone lower in the draft if he played with a quarterback not quite so good as Johnny Football.

References

References
1 And he had a talented tight end go in the fourth round in 2010, too. Like Tebow, he is also no longer playing football. Let’s move on.
2 I did this by running a regression of a player’s value in the first five years on a fifth-order polynomial in draft position. This is pretty much the same thing as looking at the value a player generates compared to their expected value according to Chase’s chart, except I also control for whether a player went to a major football school.
3 The p-value is 0.70
4 All analysis in this post ignores the supplemental draft.
5 p = .20
6 All of those first-rounders were actually TEs (Irv Smith, Kyle Brady and Jermaine Gresham, respectively), although Collins also threw to a second-round WR in Bobby Engram.
7 Kordell Stewart is one of those three and he did play a little WR in his first few years, too, but almost all of his value was at QB
8 The p-value for this effect is .01
9 For wide receivers, I estimate 17.6 as being the expected value generated by about the 46th pick, with 11.2 the expected value generated by the 89th pick
10 I’d argue the same for Dwayne Bowe and JaMarcus Russell, but Russell at least was a legitimately excellent passer in 2006
11 The similarities don’t stop there. Mike Williams is listed at 229 lbs and ran a 4.56 40 at the combine. Evans is at 231 and ran a 4.53. And they’re both named Mike.
{ 37 comments }

Vegas Has The Seahawks As the Best Team in 2014

Last year, I derived implied SRS Ratings for each NFL team based on the initial Vegas point spreads. Well, lines have been set for the first 240 games of the year — i.e., every week but week 17 — which means we can re-run the exercise for 2014.

So how do we use point spread data to derive SRS ratings? The point spread in each game provides an implied strength margin (“ISM”) between the two teams: When the Raiders are 10-point home underdogs to Denver, that implies that Denver is 13 points better than Oakland. If we treat each ISM like we would margin of victory, then we can use the SRS to come up with team ratings. For those who need a primer on what the SRS is, you can read about it here; the rest of you can skip to the ratings:

RkTeamMOVSOSSRS
1Seattle Seahawks5.10.926.02
2Denver Broncos5.530.155.68
3San Francisco 49ers4.30.815.11
4Green Bay Packers3.50.33.8
5New England Patriots3.6-0.393.21
6New Orleans Saints2.070.782.85
7Carolina Panthers1.330.822.15
8Chicago Bears0.570.781.35
9Philadelphia Eagles1.20.071.27
10Cincinnati Bengals1.3-0.171.13
11Indianapolis Colts1.97-0.891.08
12Detroit Lions0.93-0.030.9
13Kansas City Chiefs0.730.120.85
14Atlanta Falcons0.30.390.69
15Pittsburgh Steelers1.47-0.850.61
16Dallas Cowboys0.370.140.5
17Baltimore Ravens0.93-0.580.36
18Arizona Cardinals-1.271-0.27
19New York Giants-0.23-0.11-0.35
20San Diego Chargers-0.3-0.13-0.43
21Houston Texans0.4-1.46-1.06
22Miami Dolphins-1.1-0.44-1.54
23Washington Redskins-1.27-0.34-1.6
24Tampa Bay Buccaneers-2.370.48-1.88
25St. Louis Rams-2.70.72-1.98
26New York Jets-2.6-0.03-2.63
27Cleveland Browns-1.87-0.82-2.69
28Buffalo Bills-2.6-0.37-2.97
29Minnesota Vikings-3.60.47-3.13
30Tennessee Titans-1.97-1.31-3.27
31Oakland Raiders-6.270.52-5.75
32Jacksonville Jaguars-7.47-0.55-8.01

This time last year, the top five teams were…. well, the exact same five teams, albeit in a slightly different order. And the bottom three teams were… Jacksonville, Oakland, and Tennessee, in that exact order. The Broncos have the largest average margin of victory [1]Just to be clear, this analysis includes 3 points for each home team except in the London games, so these are more accurately thought of as location-adjusted expected margins of victory., but because the Seahawks face a tougher schedule, the Seahawks are implied by Vegas to be the strongest team in the NFL at six points better than average.

One interesting way to use the SRS is to see which teams have the hardest schedules. Pre-season strength of schedule is essentially meaningless when based on last year’s record, but the SOS ratings here are based on the implied strengths of each team. In my opinion, you’d be hard-pressed to find a better set of strength of schedule ratings in May than what we see here (other than the fact that they exclude week 17).

The toughest schedule this year belongs to Arizona: add in the oldest roster in the league in 2013, and it’s easy to see why Vegas is so bearish on the Cardinals in 2014. The Seahawks (+0.92) and 49ers (+0.81) have two of the next three toughest schedules (with the Panthers sandwiched between them). The Rams are a few spots down, but remember: this is only the strength of schedule for the first sixteen weeks of the season. St. Louis travels to Seattle in week 17, so the Rams schedule would be just as brutal if we included that game. The Bears having one of the five hardest schedules is a surprise after having such an easy slate in 2013.  It’s true that this analysis ignores that Chicago gets to play Minnesota in week 17, which would ease their schedule strength, but the Bears face the 49ers, Patriots, Saints, and Panthers this year, along with two games against Green Bay. That’s six games against top-7 teams.

Three AFC South teams have the easiest schedules; the Jaguars would probably join the rest of the division if they had two games against Jacksonville. The Texans are set up nicely for a rebound season under Jadeveon Clowney, Bill O’Brien, and, uh, Ryan Fitzpatrick/Case Keenum/Tom Savage. What’s really incredible about Houston’s schedule: not only do the Texans have the easiest schedule through 16 weeks, the Texans host the Jaguars in week 17! Including that game would bring Houston’s schedule down to 1.9 points easier than average.

If you include that game, 8 of the Texans’ 16 games are against teams that are 1.5 points weaker than average. Playing six games against the AFC South, the NFC East and the AFC North, and the Bills and Raiders makes for about as easy a schedule as one could create. Assuming the Texans would be favored in week 17, that means Houston — which went 2-14 last year — is favored in 8 of 16 games and a pick’em in three others (Philadelphia and Cincinnati at home, Tennessee on the road). That’s pretty incredible, and explains why Vegas was so bullish on Houston.

The table below shows each game in the first sixteen weeks of the 2014 season.  Here’s how to read the Seahawks/Raiders line: In week 9, Seattle hosts Oakland. The line is -14.5, which means the Seahawks are 14.5-point favorites. Seattle’s SRS is 6.0 while Oakland has an SRS of -5.8. Therefore, the line predicted by the SRS would be Seattle -14.8 (since the Raiders are 11.8 points worse than the Seahawks and on the road). The difference between the actual line and the SRS line is -0.3 points. By definition, the sum of all the differences between the actual lines and SRS lines must be 0, since the SRS lines were generated from the actual lines. The table below contains 480 rows, showing each game from the perspective of both teams (although the only searchable column is the first team column):

WkTeam 1Team 2H/RLineTm SRSOpp SRSProj SRS LineDiff
9Seattle SeahawksOakland RaidersHome-14.56-5.8-14.8-0.3
3New England PatriotsOakland RaidersHome-133.2-5.8-121
12Indianapolis ColtsJacksonville JaguarsHome-121.1-8-12.1-0.1
14Denver BroncosBuffalo BillsHome-11.55.7-3-11.7-0.2
1Philadelphia EaglesJacksonville JaguarsHome-111.3-8-12.3-1.3
9Cincinnati BengalsJacksonville JaguarsHome-111.1-8-12.1-1.1
9San Francisco 49ersSt. Louis RamsHome-115.1-2-10.10.9
15Baltimore RavensJacksonville JaguarsHome-10.50.4-8-11.4-0.9
12Seattle SeahawksArizona CardinalsHome-10.56-0.3-9.31.2
4San Diego ChargersJacksonville JaguarsHome-10-0.4-8-10.6-0.6
12Denver BroncosMiami DolphinsHome-105.7-1.5-10.2-0.2
5Green Bay PackersMinnesota VikingsHome-103.8-3.1-9.90.1
10Seattle SeahawksNew York GiantsHome-106-0.3-9.30.7
3New Orleans SaintsMinnesota VikingsHome-102.8-3.1-8.91.1
10Dallas CowboysJacksonville JaguarsLond-100.5-8-8.51.5
10Denver BroncosOakland RaidersRoad-105.7-5.8-8.51.5
2Washington RedskinsJacksonville JaguarsHome-9-1.6-8-9.4-0.4
5Denver BroncosArizona CardinalsHome-95.7-0.3-90
12San Francisco 49ersWashington RedskinsHome-8.55.1-1.6-9.7-1.2
15Kansas City ChiefsOakland RaidersHome-8.50.8-5.8-9.6-1.1
2Green Bay PackersNew York JetsHome-8.53.8-2.6-9.4-0.9
8Denver BroncosSan Diego ChargersHome-8.55.7-0.4-9.1-0.6
11San Diego ChargersOakland RaidersHome-8-0.4-5.8-8.4-0.4
7New England PatriotsNew York JetsHome-7.53.2-2.6-8.8-1.3
6Seattle SeahawksDallas CowboysHome-7.560.5-8.5-1
16Carolina PanthersCleveland BrownsHome-7.52.1-2.7-7.8-0.3
5New Orleans SaintsTampa Bay BuccaneersHome-7.52.8-1.9-7.7-0.2
4Indianapolis ColtsTennessee TitansHome-7.51.1-3.3-7.40.1
5Detroit LionsBuffalo BillsHome-7.50.9-3-6.90.6
16San Francisco 49ersSan Diego ChargersHome-75.1-0.4-8.5-1.5
14San Francisco 49ersOakland RaidersRoad-75.1-5.8-7.9-0.9
2Denver BroncosKansas City ChiefsHome-75.70.8-7.9-0.9
6Tennessee TitansJacksonville JaguarsHome-7-3.3-8-7.7-0.7
1Denver BroncosIndianapolis ColtsHome-75.71.1-7.6-0.6
12Philadelphia EaglesTennessee TitansHome-71.3-3.3-7.6-0.6
11Chicago BearsMinnesota VikingsHome-71.4-3.1-7.5-0.5
3Cincinnati BengalsTennessee TitansHome-71.1-3.3-7.4-0.4
5San Francisco 49ersKansas City ChiefsHome-75.10.8-7.3-0.3
15Detroit LionsMinnesota VikingsHome-70.9-3.1-70
2San Francisco 49ersChicago BearsHome-75.11.4-6.70.3
12Atlanta FalconsCleveland BrownsHome-70.7-2.7-6.40.6
15New England PatriotsMiami DolphinsHome-6.53.2-1.5-7.7-1.2
1Chicago BearsBuffalo BillsHome-6.51.4-3-7.4-0.9
15Carolina PanthersTampa Bay BuccaneersHome-6.52.1-1.9-7-0.5
10Cincinnati BengalsCleveland BrownsHome-6.51.1-2.7-6.8-0.3
14Green Bay PackersAtlanta FalconsHome-6.53.80.7-6.10.4
8Kansas City ChiefsSt. Louis RamsHome-6.50.8-2-5.80.7
5Pittsburgh SteelersJacksonville JaguarsRoad-6.50.6-8-5.60.9
12New Orleans SaintsBaltimore RavensHome-6.52.80.4-5.41.1
16New Orleans SaintsAtlanta FalconsHome-6.52.80.7-5.11.4
4San Francisco 49ersPhiladelphia EaglesHome-65.11.3-6.8-0.8
10Baltimore RavensTennessee TitansHome-60.4-3.3-6.7-0.7
9Kansas City ChiefsNew York JetsHome-60.8-2.6-6.4-0.4
12Chicago BearsTampa Bay BuccaneersHome-61.4-1.9-6.3-0.3
5Philadelphia EaglesSt. Louis RamsHome-61.3-2-6.3-0.3
3Indianapolis ColtsJacksonville JaguarsRoad-61.1-8-6.1-0.1
7Chicago BearsMiami DolphinsHome-61.4-1.5-5.90.1
14Detroit LionsTampa Bay BuccaneersHome-60.9-1.9-5.80.2
13Indianapolis ColtsWashington RedskinsHome-61.1-1.6-5.70.3
10Green Bay PackersChicago BearsHome-63.81.4-5.40.6
6Denver BroncosNew York JetsRoad-65.7-2.6-5.30.7
12New England PatriotsDetroit LionsHome-63.20.9-5.30.7
7Seattle SeahawksSt. Louis RamsRoad-66-2-51
13St. Louis RamsOakland RaidersHome-5.5-2-5.8-6.8-1.3
3Atlanta FalconsTampa Bay BuccaneersHome-5.50.7-1.9-5.6-0.1
13New York GiantsJacksonville JaguarsRoad-5.5-0.3-8-4.70.8
1Kansas City ChiefsTennessee TitansHome-50.8-3.3-7.1-2.1
1Pittsburgh SteelersCleveland BrownsHome-50.6-2.7-6.3-1.3
10Detroit LionsMiami DolphinsHome-50.9-1.5-5.4-0.4
1Seattle SeahawksGreen Bay PackersHome-563.8-5.2-0.2
13Houston TexansTennessee TitansHome-5-1.1-3.3-5.2-0.2
4Houston TexansBuffalo BillsHome-5-1.1-3-4.90.1
4Miami DolphinsOakland RaidersLond-5-1.5-5.8-4.30.7
1New York JetsOakland RaidersHome-4.5-2.6-5.8-6.2-1.7
8Cleveland BrownsOakland RaidersHome-4.5-2.7-5.8-6.1-1.6
3Philadelphia EaglesWashington RedskinsHome-4.51.3-1.6-5.9-1.4
11Green Bay PackersPhiladelphia EaglesHome-4.53.81.3-5.5-1
15Indianapolis ColtsHouston TexansHome-4.51.1-1.1-5.2-0.7
8Dallas CowboysWashington RedskinsHome-4.50.5-1.6-5.1-0.6
8New England PatriotsChicago BearsHome-4.53.21.4-4.8-0.3
11Denver BroncosSt. Louis RamsRoad-4.55.7-2-4.7-0.2
6Philadelphia EaglesNew York GiantsHome-4.51.3-0.3-4.6-0.1
5Seattle SeahawksWashington RedskinsRoad-4.56-1.6-4.6-0.1
5Dallas CowboysHouston TexansHome-4.50.5-1.1-4.6-0.1
1St. Louis RamsMinnesota VikingsHome-4.5-2-3.1-4.10.4
6San Francisco 49ersSt. Louis RamsRoad-4.55.1-2-4.10.4
12Green Bay PackersMinnesota VikingsRoad-4.53.8-3.1-3.90.6
14Chicago BearsDallas CowboysHome-4.51.40.5-3.90.6
15Green Bay PackersBuffalo BillsRoad-4.53.8-3-3.80.7
5San Diego ChargersNew York JetsHome-4-0.4-2.6-5.2-1.2
5New England PatriotsCincinnati BengalsHome-43.21.1-5.1-1.1
10Arizona CardinalsSt. Louis RamsHome-4-0.3-2-4.7-0.7
11New Orleans SaintsCincinnati BengalsHome-42.81.1-4.7-0.7
7Green Bay PackersCarolina PanthersHome-43.82.1-4.7-0.7
16Miami DolphinsMinnesota VikingsHome-4-1.5-3.1-4.6-0.6
12San Diego ChargersSt. Louis RamsHome-4-0.4-2-4.6-0.6
11Carolina PanthersAtlanta FalconsHome-42.10.7-4.4-0.4
6Arizona CardinalsWashington RedskinsHome-4-0.3-1.6-4.3-0.3
1Detroit LionsNew York GiantsHome-40.9-0.3-4.2-0.2
13Atlanta FalconsArizona CardinalsHome-40.7-0.3-40
14Houston TexansJacksonville JaguarsRoad-4-1.1-8-3.90.1
3New York GiantsHouston TexansHome-4-0.3-1.1-3.80.2
12Kansas City ChiefsOakland RaidersRoad-40.8-5.8-3.60.4
8Miami DolphinsJacksonville JaguarsRoad-4-1.5-8-3.50.5
16Chicago BearsDetroit LionsHome-41.40.9-3.50.5
4Pittsburgh SteelersTampa Bay BuccaneersHome-3.50.6-1.9-5.5-2
7Washington RedskinsTennessee TitansHome-3.5-1.6-3.3-4.7-1.2
7Pittsburgh SteelersHouston TexansHome-3.50.6-1.1-4.7-1.2
3Carolina PanthersPittsburgh SteelersHome-3.52.10.6-4.5-1
11Miami DolphinsBuffalo BillsHome-3.5-1.5-3-4.5-1
15New York GiantsWashington RedskinsHome-3.5-0.3-1.6-4.3-0.8
2Carolina PanthersDetroit LionsHome-3.52.10.9-4.2-0.7
15Seattle SeahawksSan Francisco 49ersHome-3.565.1-3.9-0.4
7Dallas CowboysNew York GiantsHome-3.50.5-0.3-3.8-0.3
9Dallas CowboysArizona CardinalsHome-3.50.5-0.3-3.8-0.3
5Carolina PanthersChicago BearsHome-3.52.11.4-3.7-0.2
14New Orleans SaintsCarolina PanthersHome-3.52.82.1-3.7-0.2
13Green Bay PackersNew England PatriotsHome-3.53.83.2-3.6-0.1
3Seattle SeahawksDenver BroncosHome-3.565.7-3.30.2
16Seattle SeahawksArizona CardinalsRoad-3.56-0.3-3.30.2
6New England PatriotsBuffalo BillsRoad-3.53.2-3-3.20.3
15Denver BroncosSan Diego ChargersRoad-3.55.7-0.4-3.10.4
15Atlanta FalconsPittsburgh SteelersHome-3.50.70.6-3.10.4
7Arizona CardinalsOakland RaidersRoad-3.5-0.3-5.8-2.51
1New England PatriotsMiami DolphinsRoad-3.53.2-1.5-1.71.8
1San Francisco 49ersDallas CowboysRoad-3.55.10.5-1.61.9
8Tampa Bay BuccaneersMinnesota VikingsHome-3-1.9-3.1-4.2-1.2
13Baltimore RavensSan Diego ChargersHome-30.4-0.4-3.8-0.8
15Philadelphia EaglesDallas CowboysHome-31.30.5-3.8-0.8
8Cincinnati BengalsBaltimore RavensHome-31.10.4-3.7-0.7
5Indianapolis ColtsBaltimore RavensHome-31.10.4-3.7-0.7
7Denver BroncosSan Francisco 49ersHome-35.75.1-3.6-0.6
14Cincinnati BengalsPittsburgh SteelersHome-31.10.6-3.5-0.5
2Cincinnati BengalsAtlanta FalconsHome-31.10.7-3.4-0.4
2New England PatriotsMinnesota VikingsRoad-33.2-3.1-3.3-0.3
1Arizona CardinalsSan Diego ChargersHome-3-0.3-0.4-3.1-0.1
2New York GiantsArizona CardinalsHome-3-0.3-0.3-30
16New England PatriotsNew York JetsRoad-33.2-2.6-2.80.2
7Baltimore RavensAtlanta FalconsHome-30.40.7-2.70.3
16Green Bay PackersTampa Bay BuccaneersRoad-33.8-1.9-2.70.3
13Detroit LionsChicago BearsHome-30.91.4-2.50.5
11San Francisco 49ersNew York GiantsRoad-35.1-0.3-2.40.6
6Atlanta FalconsChicago BearsHome-30.71.4-2.30.7
13Carolina PanthersMinnesota VikingsRoad-32.1-3.1-2.20.8
13Denver BroncosKansas City ChiefsRoad-35.70.8-1.91.1
16Tennessee TitansJacksonville JaguarsRoad-3-3.3-8-1.71.3
15Chicago BearsNew Orleans SaintsHome-31.42.8-1.61.4
16St. Louis RamsNew York GiantsHome-3-2-0.3-1.31.7
1Houston TexansWashington RedskinsHome-2.5-1.1-1.6-3.5-1
2Seattle SeahawksSan Diego ChargersRoad-2.56-0.4-3.4-0.9
14Washington RedskinsSt. Louis RamsHome-2.5-1.6-2-3.4-0.9
8New York JetsBuffalo BillsHome-2.5-2.6-3-3.4-0.9
11Washington RedskinsTampa Bay BuccaneersHome-2.5-1.6-1.9-3.3-0.8
9Pittsburgh SteelersBaltimore RavensHome-2.50.60.4-3.2-0.7
7Buffalo BillsMinnesota VikingsHome-2.5-3-3.1-3.1-0.6
2Tampa Bay BuccaneersSt. Louis RamsHome-2.5-1.9-2-3.1-0.6
7Indianapolis ColtsCincinnati BengalsHome-2.51.11.1-3-0.5
2Indianapolis ColtsPhiladelphia EaglesHome-2.51.11.3-2.8-0.3
13Buffalo BillsCleveland BrownsHome-2.5-3-2.7-2.7-0.2
12Buffalo BillsNew York JetsHome-2.5-3-2.6-2.6-0.1
2New Orleans SaintsCleveland BrownsRoad-2.52.8-2.7-2.50
16Dallas CowboysIndianapolis ColtsHome-2.50.51.1-2.40.1
5Tennessee TitansCleveland BrownsHome-2.5-3.3-2.7-2.40.1
3San Francisco 49ersArizona CardinalsRoad-2.55.1-0.3-2.40.1
6San Diego ChargersOakland RaidersRoad-2.5-0.4-5.8-2.40.1
6Green Bay PackersMiami DolphinsRoad-2.53.8-1.5-2.30.2
7Cleveland BrownsJacksonville JaguarsRoad-2.5-2.7-8-2.30.2
1Baltimore RavensCincinnati BengalsHome-2.50.41.1-2.30.2
9Carolina PanthersNew Orleans SaintsHome-2.52.12.8-2.30.2
12New York GiantsDallas CowboysHome-2.5-0.30.5-2.20.3
9Cleveland BrownsTampa Bay BuccaneersHome-2.5-2.7-1.9-2.20.3
11Seattle SeahawksKansas City ChiefsRoad-2.560.8-2.20.3
13San Francisco 49ersSeattle SeahawksHome-2.55.16-2.10.4
5New York GiantsAtlanta FalconsHome-2.5-0.30.7-20.5
8New Orleans SaintsGreen Bay PackersHome-2.52.83.8-20.5
9Miami DolphinsSan Diego ChargersHome-2.5-1.5-0.4-1.90.6
11Arizona CardinalsDetroit LionsHome-2.5-0.30.9-1.80.7
2Houston TexansOakland RaidersRoad-2.5-1.1-5.8-1.70.8
2Dallas CowboysTennessee TitansRoad-2.50.5-3.3-0.81.7
13Pittsburgh SteelersNew Orleans SaintsHome-2.50.62.8-0.81.7
2Baltimore RavensPittsburgh SteelersHome-20.40.6-2.8-0.8
14Minnesota VikingsNew York JetsHome-2-3.1-2.6-2.5-0.5
8Pittsburgh SteelersIndianapolis ColtsHome-20.61.1-2.5-0.5
6Cincinnati BengalsCarolina PanthersHome-21.12.1-20
14Arizona CardinalsKansas City ChiefsHome-2-0.30.8-1.90.1
7San Diego ChargersKansas City ChiefsHome-2-0.40.8-1.80.2
8Arizona CardinalsPhiladelphia EaglesHome-2-0.31.3-1.40.6
1Carolina PanthersTampa Bay BuccaneersRoad-22.1-1.9-11
11Pittsburgh SteelersTennessee TitansRoad-20.6-3.3-0.91.1
10Kansas City ChiefsBuffalo BillsRoad-20.8-3-0.81.2
10Pittsburgh SteelersNew York JetsRoad-20.6-2.6-0.21.8
16Pittsburgh SteelersKansas City ChiefsHome-1.50.60.8-2.8-1.3
15Tennessee TitansNew York JetsHome-1.5-3.3-2.6-2.3-0.8
13Dallas CowboysPhiladelphia EaglesHome-1.50.51.3-2.2-0.7
4Washington RedskinsNew York GiantsHome-1.5-1.6-0.3-1.7-0.2
16Denver BroncosCincinnati BengalsRoad-1.55.71.1-1.6-0.1
9Minnesota VikingsWashington RedskinsHome-1.5-3.1-1.6-1.50
11Cleveland BrownsHouston TexansHome-1.5-2.7-1.1-1.40.1
7Detroit LionsNew Orleans SaintsHome-1.50.92.8-1.10.4
8Seattle SeahawksCarolina PanthersRoad-1.562.1-0.90.6
15Cincinnati BengalsCleveland BrownsRoad-1.51.1-2.7-0.80.7
10New Orleans SaintsSan Francisco 49ersHome-1.52.85.1-0.70.8
4Chicago BearsGreen Bay PackersHome-1.51.43.8-0.60.9
16Philadelphia EaglesWashington RedskinsRoad-1.51.3-1.60.11.6
10Philadelphia EaglesCarolina PanthersHome-11.32.1-2.2-1.2
13New York JetsMiami DolphinsHome-1-2.6-1.5-1.9-0.9
14Seattle SeahawksPhiladelphia EaglesRoad-161.3-1.7-0.7
9New York GiantsIndianapolis ColtsHome-1-0.31.1-1.6-0.6
16Houston TexansBaltimore RavensHome-1-1.10.4-1.5-0.5
2Buffalo BillsMiami DolphinsHome-1-3-1.5-1.5-0.5
15St. Louis RamsArizona CardinalsHome-1-2-0.3-1.3-0.3
4Baltimore RavensCarolina PanthersHome-10.42.1-1.3-0.3
6Detroit LionsMinnesota VikingsRoad-10.9-3.1-10
11Indianapolis ColtsNew England PatriotsHome-11.13.2-0.90.1
1Atlanta FalconsNew Orleans SaintsHome-10.72.8-0.90.1
4Atlanta FalconsMinnesota VikingsRoad-10.7-3.1-0.80.2
6Houston TexansIndianapolis ColtsHome-1-1.11.1-0.80.2
14Indianapolis ColtsCleveland BrownsRoad-11.1-2.7-0.80.2
6Tampa Bay BuccaneersBaltimore RavensHome-1-1.90.4-0.70.3
14New England PatriotsSan Diego ChargersRoad-13.2-0.4-0.60.4
4Kansas City ChiefsNew England PatriotsHome-10.83.2-0.60.4
4Detroit LionsNew York JetsRoad-10.9-2.6-0.50.5
9New England PatriotsDenver BroncosHome-13.25.7-0.50.5
3Buffalo BillsSan Diego ChargersHome-1-3-0.4-0.40.6
8Detroit LionsAtlanta FalconsLond-10.90.7-0.20.8
14New York GiantsTennessee TitansRoad-1-0.3-3.301
3Green Bay PackersDetroit LionsRoad-13.80.90.11.1
16Buffalo BillsOakland RaidersRoad-1-3-5.80.21.2
14Miami DolphinsBaltimore RavensHome0-1.50.4-1.1-1.1
3Chicago BearsNew York JetsRoad01.4-2.6-1-1
12Houston TexansCincinnati BengalsHome0-1.11.1-0.8-0.8
8Tennessee TitansHouston TexansHome0-3.3-1.1-0.8-0.8
4Dallas CowboysNew Orleans SaintsHome00.52.8-0.7-0.7
3Miami DolphinsKansas City ChiefsHome0-1.50.8-0.7-0.7
9Houston TexansPhiladelphia EaglesHome0-1.11.3-0.6-0.6
3St. Louis RamsDallas CowboysHome0-20.5-0.5-0.5
10Tampa Bay BuccaneersAtlanta FalconsHome0-1.90.7-0.4-0.4
6Pittsburgh SteelersCleveland BrownsRoad00.6-2.7-0.3-0.3
3Baltimore RavensCleveland BrownsRoad00.4-2.7-0.1-0.1
13Cincinnati BengalsTampa Bay BuccaneersRoad01.1-1.900
13Tampa Bay BuccaneersCincinnati BengalsHome0-1.91.100
3Cleveland BrownsBaltimore RavensHome0-2.70.40.10.1
6Cleveland BrownsPittsburgh SteelersHome0-2.70.60.30.3
10Atlanta FalconsTampa Bay BuccaneersRoad00.7-1.90.40.4
3Dallas CowboysSt. Louis RamsRoad00.5-20.50.5
9Philadelphia EaglesHouston TexansRoad01.3-1.10.60.6
3Kansas City ChiefsMiami DolphinsRoad00.8-1.50.70.7
4New Orleans SaintsDallas CowboysRoad02.80.50.70.7
8Houston TexansTennessee TitansRoad0-1.1-3.30.80.8
12Cincinnati BengalsHouston TexansRoad01.1-1.10.80.8
3New York JetsChicago BearsHome0-2.61.411
14Baltimore RavensMiami DolphinsRoad00.4-1.51.11.1
16Oakland RaidersBuffalo BillsHome1-5.8-3-0.2-1.2
3Detroit LionsGreen Bay PackersHome10.93.8-0.1-1.1
14Tennessee TitansNew York GiantsHome1-3.3-0.30-1
8Atlanta FalconsDetroit LionsLond10.70.90.2-0.8
3San Diego ChargersBuffalo BillsRoad1-0.4-30.4-0.6
4New York JetsDetroit LionsHome1-2.60.90.5-0.5
9Denver BroncosNew England PatriotsRoad15.73.20.5-0.5
14San Diego ChargersNew England PatriotsHome1-0.43.20.6-0.4
4New England PatriotsKansas City ChiefsRoad13.20.80.6-0.4
6Baltimore RavensTampa Bay BuccaneersRoad10.4-1.90.7-0.3
14Cleveland BrownsIndianapolis ColtsHome1-2.71.10.8-0.2
4Minnesota VikingsAtlanta FalconsHome1-3.10.70.8-0.2
6Indianapolis ColtsHouston TexansRoad11.1-1.10.8-0.2
11New England PatriotsIndianapolis ColtsRoad13.21.10.9-0.1
1New Orleans SaintsAtlanta FalconsRoad12.80.70.9-0.1
6Minnesota VikingsDetroit LionsHome1-3.10.910
4Carolina PanthersBaltimore RavensRoad12.10.41.30.3
15Arizona CardinalsSt. Louis RamsRoad1-0.3-21.30.3
2Miami DolphinsBuffalo BillsRoad1-1.5-31.50.5
16Baltimore RavensHouston TexansRoad10.4-1.11.50.5
9Indianapolis ColtsNew York GiantsRoad11.1-0.31.60.6
14Philadelphia EaglesSeattle SeahawksHome11.361.70.7
13Miami DolphinsNew York JetsRoad1-1.5-2.61.90.9
10Carolina PanthersPhiladelphia EaglesRoad12.11.32.21.2
16Washington RedskinsPhiladelphia EaglesHome1.5-1.61.3-0.1-1.6
4Green Bay PackersChicago BearsRoad1.53.81.40.6-0.9
10San Francisco 49ersNew Orleans SaintsRoad1.55.12.80.7-0.8
15Cleveland BrownsCincinnati BengalsHome1.5-2.71.10.8-0.7
8Carolina PanthersSeattle SeahawksHome1.52.160.9-0.6
7New Orleans SaintsDetroit LionsRoad1.52.80.91.1-0.4
11Houston TexansCleveland BrownsRoad1.5-1.1-2.71.4-0.1
9Washington RedskinsMinnesota VikingsRoad1.5-1.6-3.11.50
16Cincinnati BengalsDenver BroncosHome1.51.15.71.60.1
4New York GiantsWashington RedskinsRoad1.5-0.3-1.61.70.2
13Philadelphia EaglesDallas CowboysRoad1.51.30.52.20.7
15New York JetsTennessee TitansRoad1.5-2.6-3.32.30.8
16Kansas City ChiefsPittsburgh SteelersRoad1.50.80.62.81.3
10New York JetsPittsburgh SteelersHome2-2.60.60.2-1.8
10Buffalo BillsKansas City ChiefsHome2-30.80.8-1.2
11Tennessee TitansPittsburgh SteelersHome2-3.30.60.9-1.1
1Tampa Bay BuccaneersCarolina PanthersHome2-1.92.11-1
8Philadelphia EaglesArizona CardinalsRoad21.3-0.31.4-0.6
7Kansas City ChiefsSan Diego ChargersRoad20.8-0.41.8-0.2
14Kansas City ChiefsArizona CardinalsRoad20.8-0.31.9-0.1
6Carolina PanthersCincinnati BengalsRoad22.11.120
14New York JetsMinnesota VikingsRoad2-2.6-3.12.50.5
8Indianapolis ColtsPittsburgh SteelersRoad21.10.62.50.5
2Pittsburgh SteelersBaltimore RavensRoad20.60.42.80.8
2Tennessee TitansDallas CowboysHome2.5-3.30.50.8-1.7
13New Orleans SaintsPittsburgh SteelersRoad2.52.80.60.8-1.7
2Oakland RaidersHouston TexansHome2.5-5.8-1.11.7-0.8
11Detroit LionsArizona CardinalsRoad2.50.9-0.31.8-0.7
9San Diego ChargersMiami DolphinsRoad2.5-0.4-1.51.9-0.6
5Atlanta FalconsNew York GiantsRoad2.50.7-0.32-0.5
8Green Bay PackersNew Orleans SaintsRoad2.53.82.82-0.5
13Seattle SeahawksSan Francisco 49ersRoad2.565.12.1-0.4
12Dallas CowboysNew York GiantsRoad2.50.5-0.32.2-0.3
9Tampa Bay BuccaneersCleveland BrownsRoad2.5-1.9-2.72.2-0.3
11Kansas City ChiefsSeattle SeahawksHome2.50.862.2-0.3
1Cincinnati BengalsBaltimore RavensRoad2.51.10.42.3-0.2
6Miami DolphinsGreen Bay PackersHome2.5-1.53.82.3-0.2
7Jacksonville JaguarsCleveland BrownsHome2.5-8-2.72.3-0.2
9New Orleans SaintsCarolina PanthersRoad2.52.82.12.3-0.2
6Oakland RaidersSan Diego ChargersHome2.5-5.8-0.42.4-0.1
16Indianapolis ColtsDallas CowboysRoad2.51.10.52.4-0.1
3Arizona CardinalsSan Francisco 49ersHome2.5-0.35.12.4-0.1
5Cleveland BrownsTennessee TitansRoad2.5-2.7-3.32.4-0.1
2Cleveland BrownsNew Orleans SaintsHome2.5-2.72.82.50
12New York JetsBuffalo BillsRoad2.5-2.6-32.60.1
13Cleveland BrownsBuffalo BillsRoad2.5-2.7-32.70.2
2Philadelphia EaglesIndianapolis ColtsRoad2.51.31.12.80.3
7Cincinnati BengalsIndianapolis ColtsRoad2.51.11.130.5
2St. Louis RamsTampa Bay BuccaneersRoad2.5-2-1.93.10.6
7Minnesota VikingsBuffalo BillsRoad2.5-3.1-33.10.6
9Baltimore RavensPittsburgh SteelersRoad2.50.40.63.20.7
11Tampa Bay BuccaneersWashington RedskinsRoad2.5-1.9-1.63.30.8
8Buffalo BillsNew York JetsRoad2.5-3-2.63.40.9
14St. Louis RamsWashington RedskinsRoad2.5-2-1.63.40.9
2San Diego ChargersSeattle SeahawksHome2.5-0.463.40.9
1Washington RedskinsHouston TexansRoad2.5-1.6-1.13.51
16New York GiantsSt. Louis RamsRoad3-0.3-21.3-1.7
15New Orleans SaintsChicago BearsRoad32.81.41.6-1.4
16Jacksonville JaguarsTennessee TitansHome3-8-3.31.7-1.3
13Kansas City ChiefsDenver BroncosHome30.85.71.9-1.1
13Minnesota VikingsCarolina PanthersHome3-3.12.12.2-0.8
6Chicago BearsAtlanta FalconsRoad31.40.72.3-0.7
11New York GiantsSan Francisco 49ersHome3-0.35.12.4-0.6
13Chicago BearsDetroit LionsRoad31.40.92.5-0.5
7Atlanta FalconsBaltimore RavensRoad30.70.42.7-0.3
16Tampa Bay BuccaneersGreen Bay PackersHome3-1.93.82.7-0.3
16New York JetsNew England PatriotsHome3-2.63.22.8-0.2
2Arizona CardinalsNew York GiantsRoad3-0.3-0.330
1San Diego ChargersArizona CardinalsRoad3-0.4-0.33.10.1
2Minnesota VikingsNew England PatriotsHome3-3.13.23.30.3
2Atlanta FalconsCincinnati BengalsRoad30.71.13.40.4
14Pittsburgh SteelersCincinnati BengalsRoad30.61.13.50.5
7San Francisco 49ersDenver BroncosRoad35.15.73.60.6
5Baltimore RavensIndianapolis ColtsRoad30.41.13.70.7
8Baltimore RavensCincinnati BengalsRoad30.41.13.70.7
13San Diego ChargersBaltimore RavensRoad3-0.40.43.80.8
15Dallas CowboysPhiladelphia EaglesRoad30.51.33.80.8
8Minnesota VikingsTampa Bay BuccaneersRoad3-3.1-1.94.21.2
1Dallas CowboysSan Francisco 49ersHome3.50.55.11.6-1.9
1Miami DolphinsNew England PatriotsHome3.5-1.53.21.7-1.8
7Oakland RaidersArizona CardinalsHome3.5-5.8-0.32.5-1
15San Diego ChargersDenver BroncosHome3.5-0.45.73.1-0.4
15Pittsburgh SteelersAtlanta FalconsRoad3.50.60.73.1-0.4
6Buffalo BillsNew England PatriotsHome3.5-33.23.2-0.3
3Denver BroncosSeattle SeahawksRoad3.55.763.3-0.2
16Arizona CardinalsSeattle SeahawksHome3.5-0.363.3-0.2
13New England PatriotsGreen Bay PackersRoad3.53.23.83.60.1
14Carolina PanthersNew Orleans SaintsRoad3.52.12.83.70.2
5Chicago BearsCarolina PanthersRoad3.51.42.13.70.2
9Arizona CardinalsDallas CowboysRoad3.5-0.30.53.80.3
7New York GiantsDallas CowboysRoad3.5-0.30.53.80.3
15San Francisco 49ersSeattle SeahawksRoad3.55.163.90.4
2Detroit LionsCarolina PanthersRoad3.50.92.14.20.7
15Washington RedskinsNew York GiantsRoad3.5-1.6-0.34.30.8
11Buffalo BillsMiami DolphinsRoad3.5-3-1.54.51
3Pittsburgh SteelersCarolina PanthersRoad3.50.62.14.51
7Tennessee TitansWashington RedskinsRoad3.5-3.3-1.64.71.2
7Houston TexansPittsburgh SteelersRoad3.5-1.10.64.71.2
4Tampa Bay BuccaneersPittsburgh SteelersRoad3.5-1.90.65.52
16Detroit LionsChicago BearsRoad40.91.43.5-0.5
8Jacksonville JaguarsMiami DolphinsHome4-8-1.53.5-0.5
12Oakland RaidersKansas City ChiefsHome4-5.80.83.6-0.4
3Houston TexansNew York GiantsRoad4-1.1-0.33.8-0.2
14Jacksonville JaguarsHouston TexansHome4-8-1.13.9-0.1
13Arizona CardinalsAtlanta FalconsRoad4-0.30.740
1New York GiantsDetroit LionsRoad4-0.30.94.20.2
6Washington RedskinsArizona CardinalsRoad4-1.6-0.34.30.3
11Atlanta FalconsCarolina PanthersRoad40.72.14.40.4
16Minnesota VikingsMiami DolphinsRoad4-3.1-1.54.60.6
12St. Louis RamsSan Diego ChargersRoad4-2-0.44.60.6
7Carolina PanthersGreen Bay PackersRoad42.13.84.70.7
10St. Louis RamsArizona CardinalsRoad4-2-0.34.70.7
11Cincinnati BengalsNew Orleans SaintsRoad41.12.84.70.7
5Cincinnati BengalsNew England PatriotsRoad41.13.25.11.1
5New York JetsSan Diego ChargersRoad4-2.6-0.45.21.2
15Buffalo BillsGreen Bay PackersHome4.5-33.83.8-0.7
14Dallas CowboysChicago BearsRoad4.50.51.43.9-0.6
12Minnesota VikingsGreen Bay PackersHome4.5-3.13.83.9-0.6
6St. Louis RamsSan Francisco 49ersHome4.5-25.14.1-0.4
1Minnesota VikingsSt. Louis RamsRoad4.5-3.1-24.1-0.4
6New York GiantsPhiladelphia EaglesRoad4.5-0.31.34.60.1
5Houston TexansDallas CowboysRoad4.5-1.10.54.60.1
5Washington RedskinsSeattle SeahawksHome4.5-1.664.60.1
11St. Louis RamsDenver BroncosHome4.5-25.74.70.2
8Chicago BearsNew England PatriotsRoad4.51.43.24.80.3
8Washington RedskinsDallas CowboysRoad4.5-1.60.55.10.6
15Houston TexansIndianapolis ColtsRoad4.5-1.11.15.20.7
11Philadelphia EaglesGreen Bay PackersRoad4.51.33.85.51
3Washington RedskinsPhiladelphia EaglesRoad4.5-1.61.35.91.4
8Oakland RaidersCleveland BrownsRoad4.5-5.8-2.76.11.6
1Oakland RaidersNew York JetsRoad4.5-5.8-2.66.21.7
4Oakland RaidersMiami DolphinsLond5-5.8-1.54.3-0.7
4Buffalo BillsHouston TexansRoad5-3-1.14.9-0.1
1Green Bay PackersSeattle SeahawksRoad53.865.20.2
13Tennessee TitansHouston TexansRoad5-3.3-1.15.20.2
10Miami DolphinsDetroit LionsRoad5-1.50.95.40.4
1Cleveland BrownsPittsburgh SteelersRoad5-2.70.66.31.3
1Tennessee TitansKansas City ChiefsRoad5-3.30.87.12.1
13Jacksonville JaguarsNew York GiantsHome5.5-8-0.34.7-0.8
3Tampa Bay BuccaneersAtlanta FalconsRoad5.5-1.90.75.60.1
13Oakland RaidersSt. Louis RamsRoad5.5-5.8-26.81.3
7St. Louis RamsSeattle SeahawksHome6-265-1
6New York JetsDenver BroncosHome6-2.65.75.3-0.7
12Detroit LionsNew England PatriotsRoad60.93.25.3-0.7
10Chicago BearsGreen Bay PackersRoad61.43.85.4-0.6
13Washington RedskinsIndianapolis ColtsRoad6-1.61.15.7-0.3
14Tampa Bay BuccaneersDetroit LionsRoad6-1.90.95.8-0.2
7Miami DolphinsChicago BearsRoad6-1.51.45.9-0.1
3Jacksonville JaguarsIndianapolis ColtsHome6-81.16.10.1
12Tampa Bay BuccaneersChicago BearsRoad6-1.91.46.30.3
5St. Louis RamsPhiladelphia EaglesRoad6-21.36.30.3
9New York JetsKansas City ChiefsRoad6-2.60.86.40.4
10Tennessee TitansBaltimore RavensRoad6-3.30.46.70.7
4Philadelphia EaglesSan Francisco 49ersRoad61.35.16.80.8
16Atlanta FalconsNew Orleans SaintsRoad6.50.72.85.1-1.4
12Baltimore RavensNew Orleans SaintsRoad6.50.42.85.4-1.1
5Jacksonville JaguarsPittsburgh SteelersHome6.5-80.65.6-0.9
8St. Louis RamsKansas City ChiefsRoad6.5-20.85.8-0.7
14Atlanta FalconsGreen Bay PackersRoad6.50.73.86.1-0.4
10Cleveland BrownsCincinnati BengalsRoad6.5-2.71.16.80.3
15Tampa Bay BuccaneersCarolina PanthersRoad6.5-1.92.170.5
1Buffalo BillsChicago BearsRoad6.5-31.47.40.9
15Miami DolphinsNew England PatriotsRoad6.5-1.53.27.71.2
12Cleveland BrownsAtlanta FalconsRoad7-2.70.76.4-0.6
2Chicago BearsSan Francisco 49ersRoad71.45.16.7-0.3
15Minnesota VikingsDetroit LionsRoad7-3.10.970
5Kansas City ChiefsSan Francisco 49ersRoad70.85.17.30.3
3Tennessee TitansCincinnati BengalsRoad7-3.31.17.40.4
11Minnesota VikingsChicago BearsRoad7-3.11.47.50.5
12Tennessee TitansPhiladelphia EaglesRoad7-3.31.37.60.6
1Indianapolis ColtsDenver BroncosRoad71.15.77.60.6
6Jacksonville JaguarsTennessee TitansRoad7-8-3.37.70.7
2Kansas City ChiefsDenver BroncosRoad70.85.77.90.9
14Oakland RaidersSan Francisco 49ersHome7-5.85.17.90.9
16San Diego ChargersSan Francisco 49ersRoad7-0.45.18.51.5
5Buffalo BillsDetroit LionsRoad7.5-30.96.9-0.6
4Tennessee TitansIndianapolis ColtsRoad7.5-3.31.17.4-0.1
5Tampa Bay BuccaneersNew Orleans SaintsRoad7.5-1.92.87.70.2
16Cleveland BrownsCarolina PanthersRoad7.5-2.72.17.80.3
6Dallas CowboysSeattle SeahawksRoad7.50.568.51
7New York JetsNew England PatriotsRoad7.5-2.63.28.81.3
11Oakland RaidersSan Diego ChargersRoad8-5.8-0.48.40.4
8San Diego ChargersDenver BroncosRoad8.5-0.45.79.10.6
2New York JetsGreen Bay PackersRoad8.5-2.63.89.40.9
15Oakland RaidersKansas City ChiefsRoad8.5-5.80.89.61.1
12Washington RedskinsSan Francisco 49ersRoad8.5-1.65.19.71.2
5Arizona CardinalsDenver BroncosRoad9-0.35.790
2Jacksonville JaguarsWashington RedskinsRoad9-8-1.69.40.4
10Oakland RaidersDenver BroncosHome10-5.85.78.5-1.5
10Jacksonville JaguarsDallas CowboysLond10-80.58.5-1.5
3Minnesota VikingsNew Orleans SaintsRoad10-3.12.88.9-1.1
10New York GiantsSeattle SeahawksRoad10-0.369.3-0.7
5Minnesota VikingsGreen Bay PackersRoad10-3.13.89.9-0.1
12Miami DolphinsDenver BroncosRoad10-1.55.710.20.2
4Jacksonville JaguarsSan Diego ChargersRoad10-8-0.410.60.6
12Arizona CardinalsSeattle SeahawksRoad10.5-0.369.3-1.2
15Jacksonville JaguarsBaltimore RavensRoad10.5-80.411.40.9
9St. Louis RamsSan Francisco 49ersRoad11-25.110.1-0.9
9Jacksonville JaguarsCincinnati BengalsRoad11-81.112.11.1
1Jacksonville JaguarsPhiladelphia EaglesRoad11-81.312.31.3
14Buffalo BillsDenver BroncosRoad11.5-35.711.70.2
12Jacksonville JaguarsIndianapolis ColtsRoad12-81.112.10.1
3Oakland RaidersNew England PatriotsRoad13-5.83.212-1
9Oakland RaidersSeattle SeahawksRoad14.5-5.8614.80.3

Some thoughts:

  • The biggest outlier games are again in week 1; as Jason Lisk noted when he ran a similar study last year, the lines build in some risk of injury (or simply risk of not knowing what’s going to happen in the future): if Aaron Rodgers or Peyton Manning miss time with an injury, it’s more likely to be later in the season than in week one. Additionally, if Vegas feels more confident in the early games than the late games, that will lead to some games appearing as outliers in week 1.
  • The weirdest line of the season is Tennessee/Kansas City in week 1.  The Chiefs are only 5-point home favorites: that’s 2.1 points lower than we would expect given the location of the game and the ratings of Kansas City (+0.8) and Tennessee (-3.3).
  • As a reminder, here’s a link to the 2014 schedule grid I created; I did not assign 3 points to the home team in the three London games this year.
  • For the second straight year, the Seahawks are underdogs just once: the game in San Francisco. Denver is an underdog when it travels to Seattle and Foxboro, and every other team is a dog in at least three games.
  • Oakland and Jacksonville are underdogs in each of their 15 games. Considering Oakland travels to Denver in week 17, we can safely say the Raiders and Jags are projected underdogs in every game this year.

References

References
1 Just to be clear, this analysis includes 3 points for each home team except in the London games, so these are more accurately thought of as location-adjusted expected margins of victory.
{ 4 comments }

Memorial Day 2014

Pat  Tillman

Pat Tillman.

It is the soldier, not the reporter, who has given us freedom of the press. It is the soldier, not the poet, who has given us freedom of speech. It is the soldier, not the campus organizer, who has given us the freedom to demonstrate. It is the soldier, who salutes the flag, who serves beneath the flag, and whose coffin is draped by the flag, who allows the protester to burn the flag.
Father Dennis Edward O’Brien, USMC

Today is a day that we as Americans honor and remember those who lost their lives protecting our country. As my friend Joe Bryant says, it’s easy for the true meaning of this day to get lost in the excitement of summer and barbecues and picnics. But that quote helps me remember that the things I enjoy today are only possible because those before me made incredibly selfless sacrifices. And since this is a football blog, I thought I’d take the time to remember the many football players who have lost their lives defending our country.

The most famous, of course, is Pat Tillman, the former Arizona Cardinals safety who chose to quit football to enlist in the United States army. On April 22, ten years ago, Tillman died in Afghanistan. In Vietnam, we lost both Bob Kalsu and Don Steinbrunner. You can read their stories here. Hall of Famers Roger Staubach, Ray Nitschke, and Charlie Joiner were three of the 28 NFL men to serve in the military during that war.

An incredible 226 men with NFL ties served in the Korean War, including men like Night Train Lane and Don Shula. But it was World War II that claimed the lives of 21 former NFL players.

I first encountered the list below from Sean Lahman, identifying those 21 players.

Jack Chevigny, former coach of the Cardinals, and John O’Keefe, an executive with the Eagles, were also World War II casualties. The Pro Football Hall of Fame has chronicled the stories of these men, too. Lummus received the Medal of Honor for his bravery at Iwo Jima, and you can read more about his sacrifice here.

While today isn’t Veterans Day, I’d still like to close with some more words from Father Dennis Edward O’Brien.

What is a Veteran?

Some veterans bear visible signs of their service: a missing limb, a jagged scar, a certain look in the eye.

Others may carry the evidence inside them: a pin holding a bone together, a piece of shrapnel in the leg – or perhaps another sort of inner steel: the soul’s ally forged in the refinery of adversity.

Except in parades, however, the men and women who have kept America safe wear no badge or emblem.

You can’t tell a vet just by looking.

He is the cop on the beat who spent six months in Saudi Arabia sweating two gallons a day making sure the armored personnel carriers didn’t run out of fuel.

He is the barroom loudmouth, dumber than five wooden planks, whose overgrown frat-boy behavior is outweighed a hundred times in the cosmic scales by four hours of exquisite bravery near the 38th parallel.

She – or he – is the nurse who fought against futility and went to sleep sobbing every night for two solid years in Da Nang.

He is the POW who went away one person and came back another – or didn’t come back AT ALL.

He is the Quantico drill instructor who has never seen combat – but has saved countless lives by turning slouchy, no-account rednecks and gang members into Marines, and teaching them to watch each other’s backs.

He is the parade – riding Legionnaire who pins on his ribbons and medals with a prosthetic hand.

He is the career quartermaster who watches the ribbons and medals pass him by.

He is the three anonymous heroes in The Tomb Of The Unknowns, whose presence at the Arlington National Cemetery must forever preserve the memory of all the anonymous heroes whose valor dies unrecognized with them on the battlefield or in the ocean’s sunless deep.

He is the old guy bagging groceries at the supermarket – palsied now and aggravatingly slow – who helped liberate a Nazi death camp and who wishes all day long that his wife were still alive to hold him when the nightmares come.

He is an ordinary and yet an extraordinary human being – a person who offered some of his life’s most vital years in the service of his country, and who sacrificed his ambitions so others would not have to sacrifice theirs.

He is a soldier and a savior and a sword against the darkness, and he is nothing more than the finest, greatest testimony on behalf of the finest, greatest nation ever known.

So remember, each time you see someone who has served our country, just lean over and say Thank You. That’s all most people need, and in most cases it will mean more than any medals they could have been awarded or were awarded.

Two little words that mean a lot, “THANK YOU”.

Thanks for stopping by the site today.

{ 3 comments }

Trivia: Rushing Yards with Multiple Franchises

Only two players in NFL history have ever rushed for 5,000 yards with two teams. Can you name either of them?

Here’s a couple of hints for the only player to rush for 5,300+ yards with two different teams.

Trivia hint 1 Show


Trivia hint 2 Show


Click 'Show' for the Answer Show

Here’s a couple of hints for the other player:

Trivia hint 1 Show


Trivia hint 2 Show


Click 'Show' for the Answer Show

One other player was really, really close.

Here’s a couple of hints for that player:

Trivia hint 1 Show


Trivia hint 2 Show


Click 'Show' for the Answer Show
[continue reading…]

{ 9 comments }

Green is poised for another monster year

Green is poised for another monster year.

Last year, at Footballguys.com, I looked at the best starting point for wide receiver projections. Well, I’ve re-run the numbers and come up with the best starting point for wide receiver projections in 2014.

The general philosophy is that receiving yards can be re-written using the following formula:

Receiving yards = (Receiving Yards/Target) x (Targets/Team_Pass_Att) x Team_Pass_Att.

Since each of those variables regress to the mean in different ways, we can get a more accurate projection of future receiving yards by projecting each of those three variables than by simply looking at past receiving yards. For example, here are the best fit formulas for each of those metrics:

Future Pass Attempts = 36 + (450 x Pass_Attempts/Play) + (0.255 x Offensive Plays)

Future Percentage of Targets = 6.2% + 71.3% x Past Percentage of Targets

Future Yards/Target = 5.5 + 0.29 x Past Yards/Targets

If you take a look at the three coefficients, the number of offensive plays run from year to year and the yards per target averages are not very sticky; both have coefficients of less than 0.3, which indicates a significant amount of regression to the mean. Meanwhile, percentage of targets is much, much sticker, at 71%. [1]Pass attempts per play can’t be analyzed the same way, at least using the formulas presented here, but it does look as though the pass-heaviness of an offense is moderately sticky, too. And … Continue reading

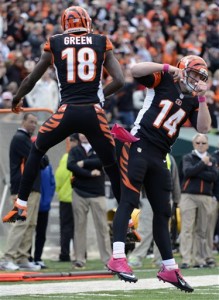
As a result, this regression really likes players like A.J. Green (5th in receiving yards in 2013, projected to be 1st in 2014), Andre Johnson (7th, 2nd) and Vincent Jackson (14th, 6th). To find out who else this metric likes and dislikes, and for a more thorough analysis, you can read the full article here.

References

References
1 Pass attempts per play can’t be analyzed the same way, at least using the formulas presented here, but it does look as though the pass-heaviness of an offense is moderately sticky, too. And that would be even more true if we accounted for game scripts, I suppose.
{ 0 comments }

Blake Bortles, Johnny Manziel, and Teddy Bridgewater were selected in the first round of the 2014 Draft. The Jaguars seem intent on giving Bortles a redshirt year, but it seems likely that the Browns and Vikings will hand their rookie quarterbacks the reins at some point early this fall.

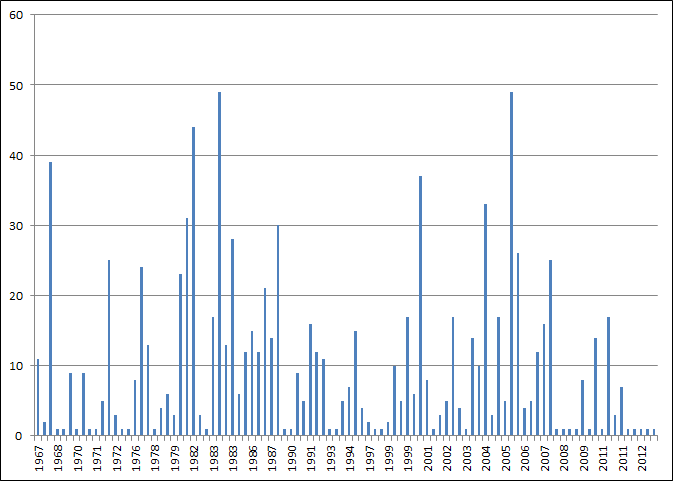
From the first common draft in 1967, until 2013, there were 96 quarterbacks selected in the first round of the draft. [1]Ignoring Rich Campbell, the only quarterback in the study to never start a game, and all quarterbacks taken in supplemental drafts. Today’s post looked at how long it took each quarterback to start his first game. For each quarterback, I assumed 16 game seasons for all seasons where the quarterback sat on the bench. Two quarterbacks, Jim Kelly and Aaron Rodgers, sat three full seasons before starting in week 1 of their 4th year; that means both players get an estimated first start of game 49. [2]Of course, Kelly and Rodgers didn’t start for pretty different reasons: Kelly was in the USFL, while Rodgers was sitting behind Brett Favre. Twenty-eight quarterbacks (29% of our sample) started their team’s first game in the year they were drafted; as a result, those quarterbacks get an estimated first start of game 1. The graph below shows how long it took each quarterback to start his first game; the X-axis represents draft year, and the Y-axis estimated number of games.

QB starts [continue reading…]

References

References
1 Ignoring Rich Campbell, the only quarterback in the study to never start a game, and all quarterbacks taken in supplemental drafts.
2 Of course, Kelly and Rodgers didn’t start for pretty different reasons: Kelly was in the USFL, while Rodgers was sitting behind Brett Favre.
{ 9 comments }

Age and the NFL Draft

In yesterday’s Wall Street Journal, Kevin Clark noted that the Eagles targeted college graduates in the 2014 NFL draft. Six of the seven players selected by Philadelphia are on track to get their degrees before entering the NFL, which is important to Chip Kelly.

Kelly said a degree is more than proof of intelligence. “It’s also, what is their commitment?” he said. “They set goals out for themselves and can they follow through for it? A lot of people can tell you they want to do this, this and this. But look at their accomplishments.”

Kelly’s quote has a certain air of truth to it, but is it verifiable? Do players with college degrees turn out to be better pros than players who don’t obtain their degrees? Unfortunately, I don’t have historical data on whether players graduated college before entering the pros. So this post can’t and won’t answer that question.

But we do have player age for all NFL players, subject to a big caveat [1]Unfortunately, we do not have such data on players who were drafted but did not make it to the NFL. This is a potentially serious issue with trying to analyze Kelly’s claim: if a non-graduate … Continue reading So here’s what I did:

1) Record the top 250 players selected in each draft from 1990 to 2009.

2) For each of those 5,000 players, calculate their Career AV in their first five years.

3) Create an expected AV curve for players by draft slot, which mirrors the myriad of other draft curves I’ve created. [continue reading…]

References

References
1 Unfortunately, we do not have such data on players who were drafted but did not make it to the NFL. This is a potentially serious issue with trying to analyze Kelly’s claim: if a non-graduate was selected in the draft but because of his “lack of follow through” he fails to even make a roster, he would be a shining example of Kelly’s claim but would be ignored in this study.. That’s a problem, but there’s no way around it.
{ 28 comments }

Longest Streaks Without Allowing a 100-Yard Rusher

Taylor was a Rams killer

Taylor was a Rams killer.

Last year, I looked at the longest streaks by teams without producing a 100-yard rusher. Today, the reverse: the run defenses that didn’t allow any opposing backs to hit the century mark week after week, year after year (note: all streaks are regular season only, unless otherwise specified). Two teams have gone 50+ straight games without allowing an opposing player to hit 100 rushing yards, and neither defense will surprise you.

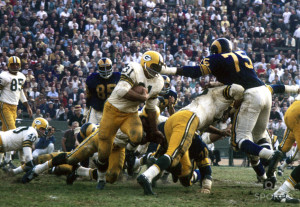
The Fearsome Foursome Rams of Merlin Olsen and Deacon Jones fame went 51 straight weeks without allowing a 100-yard rusher. In the final week of the 1964 season, Jim Taylor rushed 17 times for 165 yards against the Rams (he also picked up 56 receiving yards). Over the next three years, no opponent rushed for over 100 yards against Los Angeles. That held true for the first nine weeks of the 1968 season, too, until San Francisco’s Ken Willard broke that mark with a 128-yard performance. That was the only time from 1965 through 1968 that the Rams allowed a 100-yard rusher. Incredibly, there was a stretch of 93 games where the Rams allowed a 100-yard back just five times… and three of them came at the feet of Jim Taylor! [1]In addition to Willard, Baltimore’s Tom Matte also accomplished that feat. And Matte did put up a 99-yard performance in 1965 against LA, too. By 1969, the Rams were positively pedestrian … Continue reading

In 1989, Gerald Riggs, then with Washington, rushed for an incredible 221 yards yards in week two against Philadelphia. That was noteworthy, because for the next 53 games, no opponent rushed for 100 yards against Reggie White, Jerome Brown, and the Philadelphia Eagles defense. We know how dominant the 1991 defense was, but the rush defense was pretty stringy in the surrounding years, too. It wasn’t until Emmitt Smith broke through with a 30-carry, 163-yard day in November 1992 that the streak was snapped. [continue reading…]

References

References
1 In addition to Willard, Baltimore’s Tom Matte also accomplished that feat. And Matte did put up a 99-yard performance in 1965 against LA, too. By 1969, the Rams were positively pedestrian against the run by their standards, allowing both Gale Sayers and Tom Woodeshick to hit the 100-yard mark. Then nobody did it again for 27 games.
{ 11 comments }

Declining Running Back Value in the Draft

A first round pick in '08, an afterthought in '14

A first round pick in '08, an afterthought in '14.

Running backs had a very rough time on the open market this year. To be fair, other than perhaps Chris Johnson, the market was full of question marks, platoon guys, or second stringers. And while players like Johnson and Maurice Jones-Drew were big names, they were devalued because of the “tread on their tires.” After all, we have been told time and time again that running back is a young man’s game, and that’s mostly true.  But one might argue that college running backs should be viewed as substitutes for veteran running backs. If teams are spending less capital on veteran running backs, they would start spending more capital on college running backs.

Except that’s not the case. It appears as though veteran running backs and college running backs are like Coke and Pepsi at a time when a lot of consumers have decided to stop drinking soda. In 2013, for the first time since 1963, no running back was selected in the first round of the draft. The top back off the board was Giovani Bernard at 37, the longest a draft had ever gone without hearing a running back’s name called. That was until this year, when the first 53 picks came and went without a single running back being selected. Bishop Sankey was the first back off the board to Tennessee with the 54th pick, although Jeremy Hill, and Carlos Hyde were drafted with two of the next three picks.

You’ve heard a lot about how running backs are being devalued in the draft. By nature, I’m a bit of a contrarian, but even I can’t spin this graph, which shows the percentage of draft capital spent on running backs in each NFL draft since 1950: [continue reading…]

{ 6 comments }

Interesting tidbit from Peter King this week about how the Vikings nearly acquired Johnny Manziel:

As the picks went by, starting soon after the Rams chose at 13, Cleveland GM Ray Farmer worked the phones, trying to find a partner to move up from their second pick in the round (26th overall) to grab Manziel. He couldn’t find a fit. Finally, with less than three minutes to go in Philadelphia’s 22nd slot, Farmer heard this from an Eagles representative over the phone: “If you’re not gonna jump in here, we’re gonna trade the pick right now.” It’s cloudy what his offer had been to this point, but now he had to sweeten it, and he offered the 83rd pick overall, a third-rounder, in addition to their pick four slots lower than Philly. Done deal. The Eagles liked that offer better than an offer from Minnesota, because the Vikings would have been moving up from 40.

As discussed in my round 1 recap, the Eagles made out like bandits picking up the 83rd pick to move down four spots. Not only did Philadelphia received 137 cents on the dollar according to my trade chart, but the Jimmy Johnson trade chart — which overvalues high picks and therefore cautions against trading down — had the Eagles receiving 112 cents on the dollar. [continue reading…]

{ 2 comments }

Four First Round Defensive Linemen

The St. Louis Rams may have had the best defensive line in football in 2013. At defensive end, the Rams had two stars in Robert Quinn (the Defensive Player of the Year) and Chris Long (who has recorded 33 sacks over the past three years). As part of the RG3 trade, St. Louis traded down in the first round of the 2012 draft and wound up selecting defensive tackle Michael Brockers, who had a breakout sophomore season. The other defensive tackle spot was manned by Kendall Langford, a solid if unremarkable 28-year-old player. That defensive line helped St. Louis record a sack on 9.2% of all pass plays in 2013, the second highest rate in the NFL (behind Carolina).

Then, the Rams drafted a defensive tackle in the first round of the 2014 Draft. And not just any defensive tackle, but Pittsburgh’s Aaron Donald, the combine superstar who led the nation in tackles for losses last year. Assuming Donald replaces Langford in the lineup, that gives the Rams for first round picks on the defensive line, which brings us to the first trivia question of the day.

Can you name the last team to have four different defensive linemen who were drafted in the first round start 8+ games in a season? [continue reading…]

{ 2 comments }

Best and Worst Drafts since 1970

Not all drafts are created equal. The 2014 NFL Draft was said to be very rich in talent, while last year’s iteration was considered relatively weak. We don’t have much data on which drafts scouts have labeled as “good” or “bad”, but I thought it might be fun to see which drafts have turned out to be the best and worst.

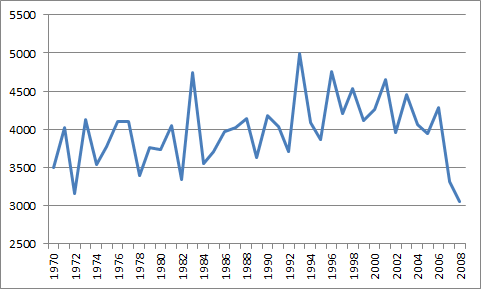
To do this, I looked at every draft from 1970 to 2008. Since there were only 222 picks in the 1994 draft, I looked at only the top 222 drafts in each of these drafts. The formula I used to measure each draft was pretty simple: use PFR’s Approximate Value grades to produce a value for each player, and then sum the values for each of the top 222 picks in each draft. More recent drafts will obviously be disadvantaged by this formula, since AV is a counting metric, which means the 2008, 2007, 2006, etc., drafts will look stronger in a few years. Regardless, take a look:

best worst drafts [continue reading…]

{ 3 comments }

Who is the Best Backup Quarterback Ever?

That's a pretty good backup.

That's a pretty good backup.

Determining the best backup quarterback ever is really complicated. Steve Young and Aaron Rodgers backed up Joe Montana and Brett Favre, respectively, but neither Young nor Rodgers morally feel like they belong in the discussion of best backup quarterbacks.

There are a couple of ways to measure how a backup quarterback fares. One way is on a game-by-game approach: i.e., the starter gets injured or pulled, and now the backup is in charge. That’s the sort of thing Frank Reich, at least anecdotally, excelled at. [1]Post for another day (or another author): Which quarterbacks were the best off the bench? The more interesting, and easier question to analyze, is to take a season-by-season approach. If a quarterback does not start his team’s season opener, he’s a backup. If he does, he’s not.

Using that concept, the name that immediately jumps to mind is Earl Morrall.  After all, he led two teams to Super Bowls during seasons that began with him on the bench. But what do the numbers say?

Ironically, my proposed definition excludes what is undoubtedly the greatest season in backup quarterback history: Kurt Warner in 1999. That season may have been a top-three season in quarterback history, but it began with Warner second on the depth chart to Trent Green. When Rodney Harrison ended Green’s season in the preseason, Warner become the starter, which would exclude his ’99 season from this analysis.

And, uh, ironically again, Morrall’s best season is excluded, too.  His top year was in 1968 when he won the NFL MVP, but since Johnny Unitas was injured in the preseason, Morrall isn’t labeled a backup by this formula, either. But I do think that the Warner and Morrall examples are rare enough that we can proceed with minimal concern. [continue reading…]

References

References
1 Post for another day (or another author): Which quarterbacks were the best off the bench?
{ 12 comments }

Will Blake Bortles be the Best QB of the 2014 Class?

A rare shot of Blake Bortles in a two-tone helmet.

A rare shot of Blake Bortles in a two-tone helmet.

The Jaguars drafted Blake Bortles with the 3rd pick in the 2014 draft. Nineteen picks later, the Browns took Johnny Manziel, and with the 32nd pick, the Vikings traded up to acquire Teddy Bridgewater.

If you believe in the efficient market theory, this means Bortles is the most likely of that group to wind up being the top quarterback from this year’s draft. But I wanted to look at other drafts where the top quarterback was selected very early but the next quarterback wasn’t drafted in quick succession (like say, Andrew Luck and RG3).

Since 1967, the first year of the common draft, a quarterback was selected in the top 6 [1]Why the top 6 and not the top 5? Only once was the top quarterback drafted with the fifth overall pick, but in three other drafts prior to 2014, the first quarterback went off the board at number six … Continue reading in 34 of 48 drafts. But in 22 of those 34 drafts, another team spent a top-12 pick on a quarterback, too. [2]Why top 12? In none of these drafts was the 2nd quarterback selected with the 13th, 14th, 15th, 16th, or 17th picks, which made 12 seem like a good cut-off.

That leaves 12 drafts where (a) a quarterback was drafted really, really early, and (b) no other quarterback went off the board for awhile (at least 14 picks between the quarterback selections in all 12 cases). Some further slicing, however, is required if we really want to do an apples-to-apples comparison. In six of those cases, a quarterback was selected with the number one overall pick, and based on research conducted by Jason Lisk, it doesn’t seem appropriate to compare quarterbacks not selected with the top pick to number one overall selections. [3]In reality, the number one picks in this sample were pretty underwhelming: Sam Bradford, JaMarcus Russell, Alex Smith, Michael Vick, Troy Aikman, and Steve Bartkowski are the six quarterbacks who … Continue reading I’d also throw out the 1973, 1976, and 1981 drafts, as the number two quarterbacks were all drafted after pick 30. [continue reading…]

References

References
1 Why the top 6 and not the top 5? Only once was the top quarterback drafted with the fifth overall pick, but in three other drafts prior to 2014, the first quarterback went off the board at number six (and never was the first passer selected at seven, eight, nine, or ten). Plus, since the Jaguars were rumored to be considering a trade down to #6 to draft Bortles, it seemed to make sense to use 6 as a cut-off.
2 Why top 12? In none of these drafts was the 2nd quarterback selected with the 13th, 14th, 15th, 16th, or 17th picks, which made 12 seem like a good cut-off.
3 In reality, the number one picks in this sample were pretty underwhelming: Sam Bradford, JaMarcus Russell, Alex Smith, Michael Vick, Troy Aikman, and Steve Bartkowski are the six quarterbacks who would have otherwise made the cut-off.
{ 6 comments }

College Observations from the 2014 Draft

Messing with Texas

By now, you’ve probably heard that no player from the University of Texas was drafted. Jackson Jeffcoat was the Big 12 co-Defensive Player of the Year, but that honor wasn’t enough to enable him to hear his named called on any of the three draft days. [1]as Bill Barnwell points out, Jeffcoat’s tumble provided a good counter to those arguing that Michael Sam was going to go undrafted despite being the SEC co-Defensive Player of the Year solely … Continue reading The draft was first instituted in 1936, and not since 1937 had an NFL draft has been Longhorn-free.  From 2000 to 2013, players selected from the University of Texas were, in the aggregate, responsible for about 37 points of value per season using the values from my pick value chart.  That’s the 10th most of any school during that period, behind only Miami (FL) (51), Southern Cal (49), Florida State (42), LSU (39), Ohio State (39), Georgia (39), Alabama (38), and Florida (38). But UT wasn’t the only school that had a rough weekend:

  • Illinois, which ranked 37th in draft value from 2000 to 2013 (14 points), was the next highest-ranked school after Texas to get shut out of the 2014 draft.  Hawaii (53rd), Rutgers (59th), and Cincinnati (66th) were other top-70 programs from ’00 to ’13 that did not have a player selected this year. A couple of other schools from power conferences — Northwestern and Kansas — were also left out in the cold.
  • For Texas and Illinois, injury was added to insult. No only were no Longhorns drafted, but three Aggies — Jake Matthews, Mike Evans, and Johnny Manziel – went in the first round, while TCU had a first round pick (Jason Verrett), Texas Tech had a second round pick (Jace Amaro) and Baylor had five players drafted.  No Illini went in the draft, but Northern Illinois had two players (including 1st round safety Jimmie Ward), Eastern Illinois had a second round pick (Jimmy Garoppolo) and even Illinois State had a player selected (Shelby Harris in the 7th round).
  • It was also a rough draft for a few other schools. Miami normally dominates the draft, but only three Hurricanes were selected: two offensive lineman and a punter.  Brandon Linder was drafted 93rd overall to Jacksonville, followed by Pat O’Donnell to Chicago at 191 and Seantrel Henderson to the Bills at 237.
  • The Georgia Bulldogs had just two players drafted, both in the fifth round: quarterback Aaron Murray and tight end Arthur Lynch.
  • Sooners fans probably want to gloat over Texas, but this was a pretty ugly year for Oklahoma, too.  The school’s highest-drafted player was Jalen Saunders at 104. That marks the first time since 1997 that no Sooner was drafted in the top 100 picks.

Small Schools Making Draft History

There were four players who came from schools that haven’t had a single player drafted in the last 20 years.

  • At pick 198, New England took defensive end Zach Moore out of Concordia University in St. Paul, Minnesota. He’s not only the first player ever drafted from the school, but no player from the Division 2 program has ever made it to the NFL. Last year, Concordia only ranked as the 26th best football team in Division 2 through 13 weeks (by reference, Pittsburgh State ranked 8th).
  • Finally, Terrence Fede out of Marist was drafted by the Dolphins with the 234th pick. Fede, like Desir and Moore, made history by becoming the first player ever drafted out of his school. Marist, located in New York state, plays in the Pioneer Football League, but ranked as just the 70th best FCS school last year.

The Crimson Tide Reign is Over

For three straight years, more draft capital was spent on Alabama players than those from any other school. The reign is over, as Alabama tumbled all the way down to … fourth place. Texas A&M led the way: while only three Aggies were selected, they were drafted high enough to make College Station the most valuable town for the 2014 draft with 60.3 points of value. Next up was LSU (57.0), which also led the way with 9 players drafted (but only one in the top 50). In third place was Notre Dame (54.7 points, 8 players drafted, three in the top 75), followed by Alabama (54.3, 8 players), Florida State (54.2, 7 players), Auburn (52.4, 4), Louisville (49.9, 4), and Ohio State (49.8, 6).

Texas A&M, Louisville, and Notre Dame had excellent drafts especially by their standards: none of the three ranked in the top 20 from ’00 to ’13 in draft value provided (the Fighting Irish were 21st, the Aggies were 24th, and the Cardinals were down at #50).  Other schools that had comparably big years: UCLA, Auburn, Buffalo, Central Florida, South Carolina, and Clemson. Okay, in the case of UCF it was just because of Blake Bortles (running back Storm Johnson, at pick 222, was the only other Knight drafted) and for Buffalo it was Khalil Mack and done. But still, neither program had ever had a player drafted in the top ten before, so a top-five pick is a pretty remarkable accomplishment.

References

References
1 as Bill Barnwell points out, Jeffcoat’s tumble provided a good counter to those arguing that Michael Sam was going to go undrafted despite being the SEC co-Defensive Player of the Year solely because he was openly gay.  As it turns out, being co-DPOY isn’t worth as much as you might think.  Jeffcoat landed with the Seahawks, though, so he and Sam will both get a chance to prove their mettle in the NFL’s toughest division.
{ 3 comments }

The NFL Draft and the Wisdom of Crowds

[Chase note: Take a look at the name at the top of this post. Our good friend Andrew continues to desire to post here, and we thank him for that.]

Not the focus of Galton's experiment.

Not the focus of Galton's experiment.

In 1906, Sir Francis Galton probably wasn’t thinking about the NFL draft when he asked almost 800 fair goers to guess the weight of an ox. No one person accurately guessed its weight, and the guesses were all over the map, but the mean of all the guesses (1197 lbs) was within one pound of the actual weight of the ox. As I looked through endless mock drafts leading up to last Thursday night, I wondered if there was anything to be gained by looking at the wisdom of the crowds. Could we do a better job of predicting the NFL draft if we took all the knowledge and tried to put it together?

And the answer appears to be yes… to an extent. The NFL draft is not exactly a place where we’d expect the wisdom of crowds to be particularly strong. The power of the wisdom of crowds comes from lots of people bringing their own independent information to the table. For example, prediction markets appear to do a great job of predicting events like a president’s chances of being reelected. Sports prediction markets (a.k.a sportsbooks) similarly succeed in predicting game outcomes. And the stock market often reveals companies’ true values. In each case, every individual transaction represents a piece of information which gets reflected in the price.

Of course, the crowd is not always so wise. Stock markets can go haywire. Betting lines can be affected by people’s biases. The wisdom of crowds can break down when groupthink occurs and people stop having independent opinions. The NFL draft certainly looks like such a case. All the mock drafts are out there and the experts have the implicit pressure to not be too different. [1]In some cases, there may be incentives to stand out from the crowd with an original prediction, too. Overall, there are incentives that can make predictions depend on those made by others. In those circumstances, we could lose in a haze of groupthink much of the original information that people have. [continue reading…]

References

References
1 In some cases, there may be incentives to stand out from the crowd with an original prediction, too. Overall, there are incentives that can make predictions depend on those made by others.
{ 9 comments }

Analyzing Position Values In the 2014 Drafts

The 2014 NFL Draft is in the books. The three-day event gives us a unique peek behind the NFL curtain; teams can and do say all sorts of ridiculous things, but the way the draft unfolds is the ultimate in what economists refer to as a revealed preference. For example, NFL decision makers might say that running and stopping the run is the key to winning football games (particularly likely if those decision makers reside in Indianapolis), but the NFL draft revealed that no team preferred to spend a top-50 pick on a running back. Only one pure inside linebacker was drafted in the first two rounds (Alabama’s C.J. Mosley), and only two more (Louisville’s Preston Brown and Wisconsin’s Chris Borland) were selected with picks in the top 125.

As regular readers know, I’ve created a draft value chart based on the expected marginal Approximate Value produced by each draftee in his first five seasons to the team that drafted him. By assigning each draft pick a number of expected points, we can then calculate how much draft capital was spent on each position. I went through the 2014 draft (using the position designations from Pro-Football-Reference) and calculated how much value was used on each position; the results are displayed in the table below. [1]I’m excluding fullbacks and specialists from this definition. For purposes of this study, the three fullbacks drafted, Auburn’s Jay Prosch (HOU), Oklahoma’s Trey Millard (SF), and … Continue reading

[visualizer id=”19720″] [continue reading…]

References

References
1 I’m excluding fullbacks and specialists from this definition. For purposes of this study, the three fullbacks drafted, Auburn’s Jay Prosch (HOU), Oklahoma’s Trey Millard (SF), and Arkansas’ Kiero Small (SEA), were included as running backs. For those curious two kickers — Arkansas’ Zach Hocker (WAS) and Boston College’s Nate Freese (DET) — and one punter (Miami(FL)’s Pat O’Donnell (CHI) were also drafted.
{ 10 comments }

In the first round of the 2014 draft, five cornerbacks were selected:

  • the Browns traded up from 9 to 8 to ensure that Oklahoma State’s Justin Gilbert would be coming to Cleveland;
  • at 14, the Bears drafted Virginia Tech corner Kyle Fuller;
  • at 24 and 25, the Bengals and Chargers took Darqueze Dennard (Michigan State) and Jason Verrett (TCU), respectively;
  • the Broncos, perhaps still reeling from the Legion of Boom’s Super Bowl performance, took Ohio State cornerback Bradley Roby with the 31st pick

In addition, four safeties were drafted in round 1:

That’s nine defensive backs in the first round.  At one point, we saw a string of 7 defensive backs taken in 14 picks at the back end of the round. This was the first time in NFL draft history that nine defensive backs went in the first 32 picks. So this is the new normal and the NFL is now a crazy passing league, right? [continue reading…]

{ 1 comment }

The action got started on day two even before the round began. Buffalo, after giving up next year’s first and fourth round picks to move up to acquire Sammy Watkins, responded by trading Steve Johnson to the 49ers on Friday afternoon.  Buffalo was able to at least get back a 2015 4th round pick from the 49ers, which could become a 3rd rounder depending on Johnson’s performance this season.  This gives Colin Kaepernick another weapon in a contract year, and it provides some short-term insurance (if Father Time outraces Anquan Boldin) and long-term insurance (Michael Crabtree is a free agent after the season) at the position.

The trades in rounds 2 and 3 weren’t very exciting, and they followed a very predictable formula: the team trading down won according to my draft value chart. The fact that my metrics said every team overpaid when trading up does not mean my metrics are wrong; my grades, in addition to being objective, are designed to be aspirational, not predictive.  These ratings tell us the actual value provided by players based on historical results. In reality, teams fall in love with a player — and are overconfident in their abilities to scout — and as a result, are willing to lose value when trading up.

My chart recognizes that the right to choose between a mid-2nd and a mid-3rd round pick is not that significant; to a decision maker who believes his scouting skills descended from the heavens, that right to choose is really, really important. Of course, the data suggests otherwise. That said, let’s take a look at what happened on Friday night using my chart and the JJ Trade Value Chart.

1) Washington trades the 34th pick to Dallas for the 47th and 78th picks

According to my chart, this was an amazing trade for Washington, who received 140 cents on the dollar.  Even the JJ chart thinks Washington picked up 112.5 cents on the dollar. Picking up an extra 3rd round pick to move down 13 spots was a very nice haul.

The Cowboys traded up for Boise State defensive end Demarcus Lawrence. Dallas was worried the Falcons would take him and apparently viewed him as the clear best RDE available. That’s fine, but the Cowboys gave up two important picks to secure his rights.

2) Seattle trades the 40th and 146th pick to Detroit for the 45th (2nd), 111 (4th), and 227th (7th).

My chart liked the the Seahawks side of the deal, as Seattle picked up a 107.5 cents on the dollar.  The JJ chart, on the other hand, thinks Detroit got the slightly better deal , giving up 524 points of value for 533 points.

The Lions traded up for BYU outside linebacker Kyle Van Noy. This is the rare trade up I’ll approve, because well, I watched the 2012 Poinsettia Bowl.

In all, Van Noy made 7.5 disruptive plays in the box score: 3.5 tackles for loss (1.5 sacks), a forced fumble (which he recovered for a touchdown), an interception he returned for a touchdown and a blocked punt.

Van Noy single-handedly scored more points than the BYU offense and accounted for two of BYU’s five takeaways.

Van Noy may not be a great NFL player, but he was an excellent college player and a fun one to watch. Rumor has it the Lions wanted Anthony Barr in the first round, but pairing Eric Ebron with Van Noy might wind up working out even better.

3) The Bills traded the 41st pick to St. Louis for the 44th and 153rd picks

As you might suspect, my chart thought this was a very smooth move for Buffalo, trading 11 points for 13 and receiving 118 cents on the dollar.  The JJ chart thought this trade was exactly even, trading 490 points for 490 points.

We know that Jeff Fisher loves his cornerbacks, and the Rams traded up for Florida State’s Lamarcus Joyner.  I’m not a slave to my own chart — I recognize that giving up a 5th round pick to ensure that you get your player can be worth it. But my chart recognizes that 5th round picks still have value, and there’s not much difference between the 41st and 44th picks. The Rams probably had a 1st round grade on Joyner and were willing to sacrifice the pick to get him, but the million dollar question is always why didn’t enough other teams have a first round grade on him?

4) Three picks in a row, three trades.  Tennessee sent the 42nd pick to Philadelphia for the 54th and 122nd selections.

My chart says the Titans got a nice deal, picking up 122 cents on the dollar.  Meanwhile, the JJ chart says the Eagles killed it on this trade, and Tennessee only picked up 85 cents on the dollar.   In retrospect, the Seahawks may have won their deal with Detroit, but they almost certainly could have done better than they did in their deal with the Lions. Seattle clearly got the worst deal of the three teams that traded down in the 40 to 42 range.

Philadelphia moved up for Vanderbilt wide receiver Jordan Matthews and paid the price. Matthews may not have made it to 54, so it’s easy to understand why the Eagles made the move. This trade was interesting because of the wildly disparate values on the two charts, but the 122nd pick is not a throwaway. Of course, the Eagles tend to manage the draft very well, so giving up the pick here is not so disheartening: Philadelphia got an extra pick in the Johnny Manziel trade, and didn’t even give up their own pick in the Darren Sproles trade (the Eagles used the pick they got from New England for Isaac Sopoaga).

5) Miami sends the 50th pick to San Diego for the 57th and 125th selections

The Chargers tossed a 4th round pick in to move up 7 spots.  That might sound okay, but Miami picked up 132 cents on the dollar in this deal. On the other hand, teams like San Diego are probably using the JJ chart, which says San Diego won this trade (Miami received 94 cents).

San Diego moved up for outside linebacker Jeremiah Attaochu. Presumably the Georgia Tech player was the last pass rusher in the Chargers’ top tier, but a 4th round pick is not pocket change. Like most 3-4 teams, the Chargers really want to add edge rushers. What separates San Diego from the rest is the amount of capital they keep throwing at the position with little results: Jarret Johnson, Dwight Freeney, Larry English, Melvin Ingram are all still on the roster.

6)

7)

The next two trades are best analyzed together.  San Francisco owned the 56th pick and sent it to Denver; moments later, the 49ers traded for Miami’s 57th pick.

Combined, San Francisco moved down from 56 to 57 and lost their 242nd pick; in return, the 49ers picked up Denver’s 2015 4th round pick. That’s just beautiful.

This year, Denver picks at 131 in the 4th round.  If we say the Broncos will be around there next year, and then apply a 20-spot discount for the time value of draft picks, that would put this at equal to the 151st pick this year.  That’s some fuzzy math, of course, but….

If we do that, San Francisco gave up 56 and 242 for 63, 171, and something equivalent to the 151st pick.  That means the 49ers robbed the Broncos, getting 143 cents on the dollar.  Unfortunately, some of that was then given up when San Francisco sent 63 and 171 for number 57.  In that deal, Miami received 113 cents on the dollar according to my chart.

Denver traded up for Indiana wide receiver Cody Latimer; San Francisco traded for Ohio State running back Carlos Hyde. Both players could turn into starts, and in general, I’m less disturbed by a trade up for skill position players. Then again, the Broncos have Demaryius Thomas, Wes Welker, Julius Thomas, and Emmanuel Sanders (not to mention Andre Caldwell and Jordan Norwood), while the 49ers have Frank Gore, Kendall Hunter, Marcus Lattimore. That doesn’t even include LaMichael James, who is probably going to be traded soon.

8) San Francisco gets back into the trading business, sending the 61st pick to Jacksonville for the 70th and 150th selections.

Trading down would seem to make more sense for say, Jacksonville than San Francisco, but what do I know.  As you’d expect, the 49ers won the deal, picking up 121 cents on the dollar.

The Jaguars traded up for Penn State wide receiver Allen Robinson.  If nothing else, I admire Jacksonville’s dedication to improve the passing game, using the team’s first three picks on Blake Bortles, Marqise Lee, and Robinson. The most important thing, of course, is hitting on the picks, but those players — combined with Cecil Shorts, Ace Sanders, Denard Robinson, and Toby Gerhart — could be part of a fun Jaguars offense in 2015 and 2016. Unfortunately, 2014 probably will look a lot like 2013 still.

9) Oakland sends the 67th pick to Miami for the 81st and 116th picks.

The Dolphins did a nice job adding value with a pair of trade downs earlier, but go the wrong way here.  The Raiders pick up 140 cents on the dollar.

The Dolphins traded up for Billy Turner, who is an offensive linemen from North Dakota State. That’s the extent of my scouting report.

If you’re a Miami fan and dismayed that your team traded up (and paid a pretty price to do so) for an FCS offensive linemen, well, over the three trades, I have Miami up 106 cents on the dollar (in total, the Dolphins sent 50/81/116 for 63/67/125/171).

10) Philadelphia trades the 83rd pick to Houston for the 101st and 141st picks

As you’ve come to see, the trading down teams tend to get the (much) better end of the bargain.  Here, the Eagles picked up 128 cents on the dollar. On the other hand, the Texans move up for Louis Nix III.  This move is okay by me: Nix was a first round pick on some boards, and is a monster nose tackle. Teams can probably neutralize him by double-teaming him, and double-teaming Jadeveon Clowney, and triple-teaming J.J. Watt and yeah I’m okay with what Houston did here.

11) New England trades the 93rd pick to Jacksonville for the 105th and 179th picks

The Patriots receive 116 cents on the dollar here. But again, shouldn’t New England be the team trading up and Jacksonville the one trading down?

12) In what was essentially a mirror of the last deal, San Francisco sent the 94th pick to Cleveland for the 106th and 180th picks.  Here, the 49ers received 112 cents on the dollar.

Jacksonville traded up for Miami (FL) guard Brandon Linder.  Cleveland traded for Towson running back Terrance West.

{ 9 comments }

Round 1 2014 NFL Draft Recap

Let’s get started! As always, I’ll be using my Draft Pick Value Calculator and the JJ Trade Value Calculator to analyze all trades (well, all trades except for one).

1. Houston Texans – Jadeveon Clowney, DE, South Carolina

Little drama at the top. Clowney’s been expected to be the first overall pick in the 2014 draft for about three years.  He’ll be joining J.J. Watt to create a scary front seven in Houston. The Texans need to do something to counter the Colts landing Andrew Luck, and this isn’t too bad of a plan.

2. St. Louis Rams – Greg Robinson, OT, Auburn

Not much of a surprise here, either, at least according to most mocks. Robinson is an incredible athlete and a dominant run blocker. The early word, though, is that he’ll play left guard right away, as Jake Long remains on the left side (Robinson could play the right side, but the Rams may be happy with Joe Barksdale).

3. Jacksonville Jaguars – Blake Bortles, QB, UCF

Surprise! I had the Jaguars taking a quarterback, but Bortles was the first real shock of the draft. That’s a risky move by the Jaguars: Bortles seems to have pretty high bust potential and this pick means the clock is now beginning to tick on the rebuilding project. [continue reading…]

{ 1 comment }

Colleges with the Best Drafts In Each Year

Half of the top four picks in the 2010 draft.

Half of the top four picks in the 2010 draft.

Thanks to the Football Perspective Draft Value Chart, we know the value of each pick in the draft. If we assign the draft value associated with each pick to the college of that player, then we can determine which school produced the most draft value in any given year.  For example, this year, Texas A&M could have three players selected in the top ten: Johnny Manziel, Jake Matthews, and Mike Evans.  In fact, I have the trio all going in the top 8 in my mock draft.

Only three times in the last 25 years has a school had three of its players go in the top ten. Four years ago, Oklahoma had three players go in the top four, with Sam Bradford, Gerald McCoy, and Trent Williams only interrupted by the Lions selection of Ndamukong Suh.  Nine years ago, Auburn running backs Ronnie Brown and Cadillac Williams went in the top five and cornerback Carlos Rogers was selected ninth overall. And in 1995, Penn State sent Ki-Jana Carter, Kerry Collins, and Kyle Brady to the NFL, although the Nittany Lions didn’t even have the best draft of any school that year.

But no school dominated a single draft quite like Notre Dame back in 1946. The Fighting Irish had three of the first five picks (including Jason’s boy, Johnny Lujack and Hall of Famer George Connor), and the 10th and 16th overall selections. And then seven more in the top 135! In more modern times, the Hurricanes’ 2004 class takes the cake.  That year, Miami had six of the top 21 picks (Sean Taylor (5), Kellen Winslow Jr. (6), Jonathan Vilma (12), D.J. Williams (17), Vernon Carey (19) and Vince Wilfork (21))! [continue reading…]

{ 1 comment }

Drafting Diamonds in the Rough

Guest blogger Andrew Healy, an economics professor at Loyola Marymount University, is back and the author of today’s post. As a reminder, there a tag at the site where you can find all of his great work.

Small school defender takes down big school quarterback

Small school defender takes down big school quarterback.

Asante Samuel. Jahri Evans. Robert Mathis. These three players share something in common that offers a hint to finding steals in the middle rounds of the draft. All three eventually made Pro Bowls. Each was drafted in Round 4 or later. And each played for a notable football powerhouse in college: Central Florida [1]In 2003, Central Florida went 3-9 in the MAC. While the Blake Bortles Knights may not be a football powerhouse, either, the 2013 UCF team that went 12-1 in the American Conference bears little … Continue reading, Bloomsburg, Alabama A&M.

The success of these smaller college players relative to their marquee school competitors turns out to be a much more general phenomenon. In the middle rounds of the NFL draft, players from outside the traditional power conferences have been more than twice as likely to eventually make the Pro Bowl as players from the most famous programs. On defense, small school players have been even more likely to make the Pro Bowl than their major school counterparts.

Let’s use the 2003 draft as an example. Only 5% (6 out of 116) of the major college players selected in round 4 or later eventually made it to a Pro Bowl. At the same time, 12% (6 out of 50) of small college players would eventually be selected for Hawaii. At the very least, if you were watching the draft and wanting to know what the chances are that your team drafted a future star, those chances increased in the middle of the draft when your team picked a player from a school like Bloomsburg than when it picked another player from the SEC.

In fact, it’s hard to think of anything else that can match the impact of simply picking small-school players as a way to find stars in the middle rounds. The data suggest that this logic has even applied at the top of the draft for comparisons such as those between Buffalo’s Khalil Mack and South Carolina’s Jadeveon Clowney. But the big gains from focusing on smaller football schools have come from finding the gems that the draft buzz mostly bypasses. Consistently, general managers have wasted picks on players from major conferences, missing chances to find difference-makers―particularly on defense―from schools such as Northern Colorado and Idaho State. [2]Bonus points for getting those players. Aaron Smith was a 4th round pick out of Northern Colorado in 1999 and Jared Allen was a 4th round pick out of Idaho State in 2004.

The Data

I look at all players drafted from 1998-2007, stopping at the later year to give players time to make a Pro Bowl. The measure of excellence is making a Pro Bowl, but I’ll also look at All-Pro selections. I ignore players listed at special teams positions (P, K, and KR), although it’s possible you could make a Pro Bowl as a special teamer after being drafted at an offensive or defensive position. I also did not include fullbacks because it became so easy to make the Pro Bowl at that spot.

Major conferences are defined according to the traditional BCS definitions: Big East/American, Big 10, Big 12, Pac 10, SEC, and ACC. Notre Dame is also included with these bigger (in terms of football) schools. A school such as Wake Forest gets defined as a big football school by this measure and it probably shouldn’t be, but adjustments from this definition would be judgment calls and so this simple rule seems best.

Note that almost none of the middle-round small-school Pro Bowlers during this time period come from schools such as Boise State that were big football schools at the time. The two possible exceptions are Brett Keisel of BYU (drafted in 2002) and Paul Soliai of Utah, who was drafted in 2007 before Utah joined the Pac-12.

Comparing Average Success Across Schools

Small school players get drafted later than big school players, so we need to control for draft position to get a fair comparison between them. Later, I’ll use regression to do that. Here, I’m just going to break down results according to ranges of draft position. The chance of making the Pro Bowl is much higher in the early parts of the draft, so I’ll break things down there according to selection number rather than just the round.

The table below looks at the first three rounds of the draft. Overall, the chances of drafting a Pro Bowler tend to be higher for small school players in the first three rounds. The small school samples are limited in the first round, but the share of small school players who make a Pro Bowl is higher throughout than for big schools. Out of all the rounds, the 2nd round is the only one where we see a small trend the other way.

 Small schoolsBig schools
Round# of selections% Pro Bowlers# of selections% Pro Bowlers
1 (Pick 1-10)771.4%9355.9%
1 (Pick 11-20)850.0%9141.8%
1 (Pick 21-32)1145.5%9929.3%
2 (Pick 33-48)2623.1%13124.4%
2 (Pick 49-64)3511.4%11215.2%
38310.8%2449.0%

The largest differences, and the clearest benefit from drafting players from smaller schools, come in the middle rounds. The table below shows the differences in rounds 4-7. In round 4 over the ten-year period, teams have been about three times more likely to draft a Pro Bowler when picking from a small school rather than a big one. 12.9% of small school draftees in Round 4 have made the Pro Bowl, compared to just 4.1% of big school players.

 Small schoolsBig schools
Round# of selections% Pro Bowlers# of selections% Pro Bowlers
49312.9%2474.1%
51088.3%2283.5%
61353.7%2203.6%
71572.6%2941.7%

In round 5, we see a similarly large difference. Round 5 players from small schools have been more than twice as likely as big school players to make a Pro Bowl. Altogether, across rounds 4 and 5, despite 475 non-special teams players being drafted from big schools, just 18 (3.8%) have made a Pro Bowl. On the other hand, out of just 201 players drafted in those rounds from small schools, 21 (10.5%) made a Pro Bowl. If you wanted to find a future star in rounds 4 or 5, you would have increased your chances by more than double by looking at the Northern Colorados and Alabama A&Ms of college football rather than the USCs and Alabamas.

[Chase note: It is at this point that I decided I needed to stop reading the article.  I trust Andrew, but found his claims too remarkable to just blindly accept. So I decided to open up my database to confirm. I removed punters and kickers but kept everyone else in the database.  To my amazement, the numbers not only seem legit, but perhaps even under-reported.  The average player selected from the 4th or 5th round from a Big School made 0.06 Pro Bowls, compared to 0.22 Pro Bowls for players from non-major schools!]

Regression Results: Controlling for Draft Position in a Flexible Way

To figure out the average bonus small school players offer compared to large school players, we can use linear regression to control for draft position. In the regressions, I predict whether a player became a Pro Bowler with a cubic polynomial in draft position and whether the player went to a major school. The regression results indicate that, looking across rounds and controlling for draft position, players from small schools are about 3 percentage points more likely to become Pro Bowlers. [3]We get almost the same result if we include higher powers of the pick number. We also get similar results if we use a logit instead of a linear regression. The standard error for the estimate is in … Continue reading

All rounds ( N = 2427 (0.014)):

[math]Pro Bowl = f(Pick, Pick^2, Pick^3) + 0.030 *Small School [/math]

The three percentage point bump for small school players is a substantial boost. Across all rounds of the draft, about 11.8% of the main position players made a Pro Bowl. Compared to this baseline, teams increase their chances of drafting a Pro Bowler by about 20% by drafting a small school player.

We can see more of this pattern by breaking things down according to the early and later rounds. If we look at rounds 1-3, nothing statistically significant emerges. The point estimate follows the overall pattern, but the result is not clear, in part due to the relatively small number of small school players drafted in the first three rounds.

Rounds 1-3 (N = 947 (0.034)):

[math]Pro Bowl = f(Pick, Pick^2, Pick^3) + 0.021 *Small School [/math]

On the other hand, in rounds 4-7, we get a very clear impact of picking small school players, an effect that is even more striking given the much smaller share of players who make the Pro Bowl in those rounds compared to earlier ones.

Round 4-7 (N = 1480 (0.011)):

[math]Pro Bowl = f(Pick, Pick^2, Pick^3) + 0.033 *Small School [/math]

We see that, controlling for the selection, small school players are 3.3 percentage points more likely to make the Pro Bowl. [4]The t-statistic is 3.04 and the p-value is .002. This represents about a doubling of the chance that a major school player makes the Pro Bowl. Just 3.1% of major school players drafted in Rounds 4-7 at the main positions made the Pro Bowl. The model predicts that around 6.4% of small school players drafted in those same positions would have made the Pro Bowl.

All-Pro Appearances

So focusing on small school players offers a much better way to draft a future star according to Pro Bowl appearances. And it doesn’t look like this is just about Pro Bowls. Instead, it’s pretty clear that small school players perform better more generally than major school players, once we control for draft position, with these differences primarily driven by the middle rounds, particularly 4 and 5.

Small school players drafted in rounds 4-7 are also about twice as likely to appear on an All-Pro team as their major school counterparts. Controlling for draft position, small school players are about 1.3 percentage points more likely to make an All-Pro team, relative to a baseline where 1.5% of major school players made an All-Pro team.

All-Pro (N = 1480 (0.008)):

[math]All-Pro= f(Pick, Pick^2, Pick^3) + 0.013 *Small School [/math]

Particularly given the relatively small number of players who made an All-Pro team, we can look at this another way by considering the number of appearances a player made on an All-Pro team. Controlling for draft position, players drafted in the middle rounds from small schools have an average of .036 more All-Pro selections than major school players. The mean number of All-Pro selections for major school players is .022, so small school players are predicted to have more than twice the number of All-Pro selections as their major school counterparts. [5]The small school players drafted in rounds 4-7 who made an All-Pro team are (with the number of appearances in parentheses): Adalius Thomas (2), Asante Samuel (3), Brandon Marshall (1), Cortland … Continue reading

Number of All-Pro Appearances (N = 1480 (0.015)):

[math]All-Pro Appearances = f(Pick, Pick^2, Pick^3) + 0.036 *Small School [/math]


The Best Defense Comes from Small Schools

One other interesting pattern in the data is the offense/defense breakdown. All of the above effects are driven by the defense. If we look just at offense, there’s basically no difference between big and small schools, which mimics what Chase found using a different methodology last year.  However, there are large gaps for defensive players.

Take the regression from before for rounds 4-7. Now let’s break it down separately for offense and defense:

Round 4-7, Offense only (N = 749 (0.016)):

[math]Pro Bowl = f(Pick, Pick^2, Pick^3) + 0.003 *Small School [/math]

Round 4-7, Defense only (N = 731 (0.015))::

[math]Pro Bowl = f(Pick, Pick^2, Pick^3) + 0.060 *Small School [/math]

The last gap is pretty enormous. Even if we don’t control for the spot the player is selected―which works against small school players since they get drafted later―we see the huge differences between small and large school defensive players. Out of 499 defensive players drafted in rounds 4-7 from major conference schools between 1998 and 2007, 10 (2.0%) made the Pro Bowl. On the other hand, out of 231 small school players drafted in those same rounds, 18 (7.8%) made the Pro Bowl. The gap for all-pro appearances is similarly large. There were a total of 10 all-pro appearances for the 499 large-school defensive players (.020 per player) and 17 all-pro appearances for the 232 small-school players (.073 per player) drafted in rounds 4-7 during this period.

Even though we have fewer than half as many draftees to pick from compared to major school players, look at the starting 11 we can field from small school players mostly picked in round 4 or later, with two round 3 draftees to fill in a couple of holes:

DE      Robert Mathis
DT      Paul Soliai
DT      Aaron Smith
DE       Jared Allen
OLB    Joey Porter (3)
MLB   Jeremiah Trotter (3)
OLB   Adalius Thomas
CB      Asante Samuel
CB      Cortland Finnegan
FS       Kerry Rhodes [6] Rhodes has actually never made a Pro Bowl, but he was second-team All-Pro in 2006. He did not count in the players from small schools who have made a Pro Bowl.
SS       Antoine Bethea

Note that if you go back a few more years, you can substitute La’Roi Glover (5th round, 1996, San Diego St.) for Soliai and Rodney Harrison (5th round, 1994, Western Illinois) in at SS, sliding Bethea in for Rhodes at FS. That is a pretty sweet defense, all built on middle-to-late round picks from small schools.

Conclusion

The data show that picks in the middle rounds of the draft have been substantially more productive when spent on players from smaller schools. Despite picking major-school players more than twice as frequently, teams have found as many stars from the smaller schools. On defense, they have actually found substantially more stars from schools such as New Hampshire than ones such as LSU. A defensive player taken in round 4 or later has been almost four times more likely to eventually make a Pro Bowl when that player comes from a school outside the traditional power conferences. Stars such as Jared Allen, Asante Samuel, and Robert Mathis are part of a larger pattern. Teams have found those essential mid-round steals by drafting players from smaller schools.

Why has there been this opportunity to do better by picking small school players? One possibility is that there was less information out there about those players, a gap that would have been decreasing as film and televised college games have become ubiquitous. That explanation makes some sense since the benefit to smaller school players emerges in the middle rounds, long after the Brian Urlachers (New Mexico) and Joe Greenes (North Texas) who were impossible to miss had been selected. However, with the sample going from 1998-2007, this explanation seems unsatisfying since teams have had relatively easy access to information about any college player.

The explanation that I think could make more sense is some kind of risk aversion, kind of like the bias that leads to punts on fourth down. Maybe teams in the middle rounds, not seeing clear standouts, felt that it’s safer to pick the player from Alabama instead of the one from Idaho State. Even though it’s anything but safer, general managers can say to themselves that they’re getting a player who’s a known quantity due to the college program he comes from. Picking the major school player might even be the kind of move that’s harder to criticize, putting the general manager in a similar position to the coach facing 4th and 3 at midfield, where the best choice for the team may not be optimal for the decision maker. Whatever the reason, the bias towards major school players in the middle rounds has left available potential stars to the teams that have chosen players from overlooked schools.

However, this potential opportunity may already be gone. Since 2008, six defensive players have made Pro Bowls and were drafted after round three. All six were actually from major schools: Kam Chancellor (Virginia Tech) and Richard Sherman (Stanford) in Seattle, Geno Atkins (Georgia), Henry Melton (Texas), Alterraun Verner (UCLA), and Greg Hardy (Mississippi). Across offense and defense, it’s eight Pro Bowlers for large schools (adding Carl Nicks and Jordan Cameron) versus four for small schools (Alfred Morris, True Receiving Yards champ Antonio Brown, Josh Sitton, and Julius Thomas, and not counting Jerome Felton, who plays FB), about the same ratio as players drafted altogether. Still, the biggest stars here are clearly the big school players.

Even though we need more years of data on all the players in these drafts, it is possible that the previous trend has shifted. Assuming that’s right, why might that have happened? One possibility is that ever more schools are getting national media attention, meaning that small schools aren’t so small anymore. [7]Another possibility is that NFL teams have changed their behavior. There has been almost no change over time, though, in the share of small school defensive players selected at certain points in the … Continue reading    Another possibility that seems even more plausible to me is that the increasing information on high school players means that great players are now less likely to be at small schools in the first place. Even though there will always be some great players who end up at small schools (see Watt, J.J.), maybe Jared Allen would have been recruited more heavily if he played now. There may now be fewer diamonds in the rough than there used to be. That idea suggests there might have been even more diamonds in the rough if we look at earlier years. And that looks like it might be exactly the case. Just looking at rounds 4 and later in some of these earlier drafts is kind of incredible. In 1989, there were five (non-kicker) Pro Bowlers from small schools and only one from a large school. In 1990, there were nine small school Pro Bowlers (including HOFer Shannon Sharpe) compared to just four from major schools. In 1991, it was eight small school Pro Bowlers compared to just two major school players. [8]Some of the late round diamonds in the rough may have become undrafted free agents in later years. For example, James Harrison (Kent State) and London Fletcher (John Carroll) are two small school … Continue reading All of this appears even though substantially more large school players are drafted in rounds 4-8. While the chance to find a small school steal was just on defense from 1998-2007, it seems like the opportunities may have been all over the field in earlier years.

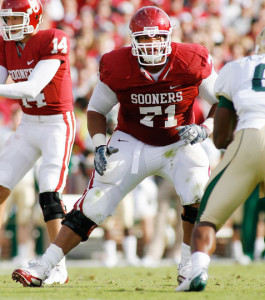
References

References
1 In 2003, Central Florida went 3-9 in the MAC. While the Blake Bortles Knights may not be a football powerhouse, either, the 2013 UCF team that went 12-1 in the American Conference bears little resemblance to where the program was a decade ago.
2 Bonus points for getting those players. Aaron Smith was a 4th round pick out of Northern Colorado in 1999 and Jared Allen was a 4th round pick out of Idaho State in 2004.
3 We get almost the same result if we include higher powers of the pick number. We also get similar results if we use a logit instead of a linear regression. The standard error for the estimate is in parentheses.
4 The t-statistic is 3.04 and the p-value is .002.
5 The small school players drafted in rounds 4-7 who made an All-Pro team are (with the number of appearances in parentheses): Adalius Thomas (2), Asante Samuel (3), Brandon Marshall (1), Cortland Finnegan (1), Jahri Evans (5), Jared Allen (4), Jerry Azumah (1), Lance Schulters (1), Matt Birk (2), Michael Turner (2), Robert Mathis (1), Terrence McGee (2), and Trent Cole (1). Of these, McGee made it as a special teams player. Amongst major college players drafted in rounds 4-7, Dante Hall and Leon Washington made All-Pro teams as special teamers during this time.
6 Rhodes has actually never made a Pro Bowl, but he was second-team All-Pro in 2006. He did not count in the players from small schools who have made a Pro Bowl.
7 Another possibility is that NFL teams have changed their behavior. There has been almost no change over time, though, in the share of small school defensive players selected at certain points in the draft.
8 Some of the late round diamonds in the rough may have become undrafted free agents in later years. For example, James Harrison (Kent State) and London Fletcher (John Carroll) are two small school UDFAs who made Pro Bowls.
{ 13 comments }

The NFL Draft is this week, which means we have something resembling real football to talk about. But how much impact will the players who hear their names called during the 2014 Draft have on the 2014 season? Here’s the short answer: as a group, they will make up about 10% of games played by all players and 8% of all starts.

What do I mean by that? Each year, every team’s players start 352 games, which is the product of 16 (games) and 22 (starters). Players selected during the 2013 Draft started 27 games per team last year, which is in line with the recent average of eight percent. I also looked at the number of games played by all drafted rookies, and divided that by the number of games played by all players on that team. Take a look: the blue line represents games played by drafted rookies and the red line represents games started; both numbers on shown on a percentage basis for the league as a whole. [continue reading…]

{ 9 comments }
Clowney's potential is too tantalizing for Atlanta to ignore

Clowney's potential is too tantalizing for Atlanta to ignore.

1. ***Trade*** Atlanta: Jadeveon Clowney, DE, South Carolina

The Falcons are desperate for a pass rusher and Thomas Dimitroff doesn’t anticipate being this close to landing a top-flight talent like Clowney ever again. After successfully trading up for Julio Jones in 2011, Dimitroff rolls the dice again, sending the 6th pick in the draft along with number 68 (Atlanta’s 3rd rounder), and the team’s 2015 first round and third round picks to Houston.

It’s a heavy price to pay, but the best way for the Falcons to cure their pass-rushing woes.  On the first day of free agency, Atlanta signed three run-stuffing, interior defensive linemen; with Clowney, the Falcons now have a legitimate pass rusher to help them close out games against Drew Brees and Cam Newton. Atlanta is switching to a 3-4/hybrid defense this year, but that won’t deter Dimitroff from making this move.  The Texans like but don’t love Clowney, and just hours before the draft, finally get the ransom they’re demanding.

2. St. Louis (from Washington as part of Robert Griffin III trade): Khalil Mack, OLB, Buffalo

Jeff Fisher was the Titans coach for 16 drafts and has been with the Rams for two more.  In that time, he’s never spent a first round pick on an offensive lineman, and has only twice used a top-80 pick on the position (Michael Roos in 2005 and Jason Layman in 1996). St. Louis really wants to trade down here, but simply can’t find a partner.

Instead, Fisher harkens back to his days with the Bears, and decides one can never have enough pass rushers. Having Robert Quinn, Chris Long, and Michael Brockers is nice, but having them and Mack is even nicer. The Rams drafted Alec Ogletree last year, which leaves Jo-Lonn Dunbar as the odd man out at right outside linebacker. It also means Mack will get to line up behind Quinn, a terrifying prospect for every team that plays the Rams.

[continue reading…]

{ 13 comments }

The Evolution of Quarterbacks

Get your roll on 'Pepp

Get your roll on 'Pepp.

With the NFL draft approaching, you’ll hear a lot of statements about how the quarterback position is changing. Mobile quarterbacks are now “in”, which is a good thing for Johnny Manziel. A 6’4 frame is no longer required, which is a good thing for… well, Manziel, and negates some of the value of a player like Blake Bortles or Tom Savage. And, heck, do you even need to get a quarterback in the first round? If Teddy Bridgewater falls to the second round, how much of an outlier does that make him? What about say, Aaron Murray, who is both short and expected to be a late round pick?

I can’t tell you how any of the prospects in this year’s draft will turn out, but I can walk you through how the quarterback position has changed over the course of NFL history.

Methodology

For all three variables, I will be using the same methodology to measure “league average” in each season.  Each player in each year gets credit for his percentage of league-wide pass attempts in the season multiplied by his value in each variable.  For example, when calculating the 2013 league average, Peyton Manning’s [rushing numbers, height, draft position] was worth 3.6% of the league average, while in 1958, Johnny Unitas’s [rushing, height, draft position] was worth 6.7% of the league average. This gives us a weighted average for each variable, weighted by the number of pass attempts by that quarterback. [continue reading…]

{ 5 comments }

Compensatory Draft Picks From 2003 to 2013

Here’s a good story from Jenny Vrentas about compensatory draft picks in the NFL. The NFL provides extra picks to teams who lose more unrestricted free agents than they sign, and no team has manipulated the system quite like the Ravens.

The NFL’s formula for doling out these compensatory picks is a secret, but in general, the best players and the players signed to the biggest deals yield the best draft picks the following year, although compensatory picks are limited to rounds three through seven. Last year, Baltimore lost Dannell Ellerbe, Paul Kruger, Ed Reed, and Cary Williams to other teams; as a result, the Ravens now have an extra pick at the end of the third round, two at the end of the fourth, and another at the end of the fifth. The maximum number of compensatory picks a team can receive in a year is four, so Baltimore and Ozzie Newsome fared about as well as possible under the system.

The Jets are the only other team that will receive four compensatory picks in the 2014 Draft. New York lost Dustin Keller, Matt Slauson, Yeremiah Bell, Mike DeVito, Shonn Greene and LaRon Landry. Teams get credit for their net free agents lost: with a max of four picks, the Jets could go out and sign two UFAs from other teams in 2013, and that’s exactly what John Idzik did by signing Mike Goodson and Antwan Barnes. As a result, the Jets will get a 4th and three 6th rounders.

Since the actual NFL formula is a secret (and may be tweaked from year to year), nobody knows exactly how the picks will be awarded in any season (Philly.com has a very good article about the process).  One thing to keep in mind is that not all free agent signings will hurt a team in the compensatory picks game.  As Vrentas notes about the Ravens decisions during free agency:

They added receiver Steve Smith and tight end Owen Daniels, but since both players had been cut by their previous teams, they don’t count in the league’s compensatory picks formula. Nor do players signed after June 1, which helped the Ravens last year, when they filled a void at inside linebacker by signing Daryl Smith on June 5.

I did my best to compile all compensatory picks from 2003 to 2013. [1]Why 2003? The compensatory pick scheme began in 1994.  That year, the Eagles received a pick at the end of the first round for losing Reggie White.  The 2002 draft was a bit funky because the … Continue reading Then, I assigned the appropriate AV draft value to each slot to see which teams have fared the best over that time frame when it comes to receiving free picks.

This analysis ignores 2014, but the Ravens easily lead the pack in both picks awarded and draft value awarded.  Take a look:
[continue reading…]

References

References
1 Why 2003? The compensatory pick scheme began in 1994.  That year, the Eagles received a pick at the end of the first round for losing Reggie White.  The 2002 draft was a bit funky because the Texans received several supplemental picks in the middle of rounds, so the 2003 cutoff was a result of me being lazy.  By limiting the sample from ’03 to ’13, I was able to label all picks after 32 in each round as compensatory picks — which works, in theory.  Of course, you then need to include compensatory picks that are earlier than 32 in a round because a team used a supplemental draft pick in the prior year.  I’ve done that, but it’s a bit tricky, and there’s a non-zero chance I’ve erred.  That’s why I’ve presented the full list in this post.
{ 1 comment }

As part of the new collective bargaining agreement, most rookies sign four-year contracts. But as further evidence of the owners’ success during negotiations in connection with the 2011 lockout, teams were granted a club option for a fifth year for all players selected in the first round. The option is only guaranteed for injury, however, so a team can exercise the option for 2011 first round picks and still release the player after the 2014 season.

For players in the top ten, that fifth year salary is equal to an average of the top ten highest-paid players at their position from the prior year. For players selected with picks 11 through 32 — and boy, that number 11 pick never looked as valuable as it did in 2011 — the fifth-year deal is worth an average of the salaries of the players with the 3rd through 25th highest salaries at their position.

The deadline for exercising the fifth-year option on 2011 first rounders is tomorrow, May 3rd.  As a reminder, here is a review of the first round of the 2011 Draft: [continue reading…]

{ 7 comments }
Previous Posts