≡ Menu

A full one-quarter of all NFL teams have opening day starters who have won a Super Bowl: New England (Tom Brady), Pittsburgh (Ben Roethlisberger), Baltimore (Joe Flacco), Denver (Peyton Manning), New York Giants (Eli Manning), Green Bay (Aaron Rodgers), New Orleans (Drew Brees) and Seattle (Russell Wilson) all sport Super Bowl winning passers.

That’s pretty rare. In 1991, Jeff Hostetler was the only quarterback starting in week 1 who had a Lombardi Trophy on his resume. [1]Phil Simms was the team’s backup, Joe Montana missed the entire year with an elbow injury, Doug Williams had retired, Jim McMahon was the backup in Philadelphia, Jim Plunkett and Joe  … Continue reading From 1993 to 2012, an average of 4.0 week 1 starters had previously won a title. Having a Super Bowl winning quarterback is nice, but it doesn’t exactly make a team unique. At least not for 2014.

YearWk 1 SB QBsQuarterbacks
20148Tom Brady; Ben Roethlisberger; Peyton Manning; Eli Manning; Drew Brees; Aaron Rodgers; Joe Flacco; Russell Wilson
20137Tom Brady; Ben Roethlisberger; Peyton Manning; Eli Manning; Drew Brees; Aaron Rodgers; Joe Flacco
20126Tom Brady; Ben Roethlisberger; Peyton Manning; Eli Manning; Drew Brees; Aaron Rodgers
20115Tom Brady; Ben Roethlisberger; Eli Manning; Drew Brees; Aaron Rodgers
20105Brett Favre; Tom Brady; Peyton Manning; Eli Manning; Drew Brees
20096Brett Favre; Kurt Warner; Tom Brady; Ben Roethlisberger; Peyton Manning; Eli Manning
20086Brett Favre; Kurt Warner; Tom Brady; Ben Roethlisberger; Peyton Manning; Eli Manning
20074Brett Favre; Tom Brady; Ben Roethlisberger; Peyton Manning
20064Brett Favre; Kurt Warner; Tom Brady; Brad Johnson
20054Brett Favre; Kurt Warner; Trent Dilfer; Tom Brady
20044Brett Favre; Kurt Warner; Tom Brady; Brad Johnson
20034Brett Favre; Kurt Warner; Tom Brady; Brad Johnson
20023Brett Favre; Kurt Warner; Tom Brady
20012Brett Favre; Kurt Warner
20003Troy Aikman; Brett Favre; Kurt Warner
19993Troy Aikman; Steve Young; Brett Favre
19984Troy Aikman; Steve Young; Brett Favre; John Elway
19973Troy Aikman; Steve Young; Brett Favre
19962Troy Aikman; Steve Young
19953Jeff Hostetler; Troy Aikman; Steve Young
19943Joe Montana; Jeff Hostetler; Troy Aikman
19936Joe Montana; Jim McMahon; Phil Simms; Jeff Hostetler; Mark Rypien; Troy Aikman
19922Phil Simms; Mark Rypien
19911Jeff Hostetler
19902Joe Montana; Phil Simms
19893Joe Montana; Jim McMahon; Phil Simms
19884Joe Montana; Jim McMahon; Phil Simms; Doug Williams
19872Joe Montana; Phil Simms
19862Joe Montana; Jim McMahon
19853Jim Plunkett; Joe Montana; Joe Theismann
19843Jim Plunkett; Joe Montana; Joe Theismann
19834Ken Stabler; Jim Plunkett; Joe Montana; Joe Theismann
19824Terry Bradshaw; Ken Stabler; Jim Plunkett; Joe Montana
19813Terry Bradshaw; Ken Stabler; Jim Plunkett
19803Bob Griese; Terry Bradshaw; Ken Stabler
19794Roger Staubach; Bob Griese; Terry Bradshaw; Ken Stabler
19783Roger Staubach; Terry Bradshaw; Ken Stabler
19775Joe Namath; Roger Staubach; Bob Griese; Terry Bradshaw; Ken Stabler
19764Joe Namath; Roger Staubach; Bob Griese; Terry Bradshaw
19754Joe Namath; Roger Staubach; Bob Griese; Terry Bradshaw
19744Joe Namath; Len Dawson; Roger Staubach; Bob Griese
19734Joe Namath; Johnny Unitas; Roger Staubach; Bob Griese
19723Joe Namath; Len Dawson; Johnny Unitas
19711Len Dawson
19703Bart Starr; Joe Namath; Len Dawson
19692Bart Starr; Joe Namath
19681Bart Starr
19671Bart Starr

References

References
1 Phil Simms was the team’s backup, Joe Montana missed the entire year with an elbow injury, Doug Williams had retired, Jim McMahon was the backup in Philadelphia, Jim Plunkett and Joe Theismann had long been retired, and that takes us all the way back to 1979.
{ 10 comments }

Guest Trivia: High and Low Points Scored In a Season

Some trivia today from longtime commenter Jason Winter. Jason is a former sports blogger (http://jasonwinter.blogspot.com/) who’s shifted his focus to video games (http://jasonwinter.wordpress.com/).

1) In a 16-game regular season, what team has the highest low point total in their games? In other words, this is the only team to score 24 or more points in every game.

Trivia hint 1 Show


Trivia hint 2 Show


Trivia hint 3 Show


Click 'Show' for the Answer Show

2) After reading Jason’s first trivia, I decided to do some digging. Since 1940, only two other teams scored more than 20 points in every game, including the postseason. Both teams were from the ’50s.

Click 'Show' for the Answer Show

[continue reading…]

{ 6 comments }

Prop Joe’s Favorite NFL Prop Bets

I think I’m one of eight billion people who love “The Wire” and “Breaking Bad.” Those are the two best TV shows I’ve seen and it isn’t particularly close. [1]“Seinfeld” is all alone in third with a pretty big gap after that, too. “The Wire” had an amazing volume of unforgettably vivid characters. Below is my list of memorable “Wire” characters. To be a real test of unforgettableness, it’s got to be off the top of my head, so I’m sure I’m going to forget somebody, but here goes and I’ll include the first thought that jumps to mind:

Omar (“man’s gotta have a code”), Bunk (“f***”), McNulty (“f***”), DeAngelo (library), Stringer (mastermind), Avon (winner), Brother Mouzone (bow tie), Cedric (good posture), Garcetti (that’s actually the mayor of LA, I mean the Baltimore mayor), Clay Davis (“sheeeeeet”), Bunny (“New Hamsterdam”), Keisha (car chase scene), Lester (wood carving), Bodie (corner), Prop Joe (large), …

Ah, Prop Joe. Prop Joe was a very large and very reasonable drug kingpin. His name apparently stemmed from saying “I’ve got a proposition for you,” so we could certainly see him getting into prop bets. So, in honor of Prop Joe, I’ll cover some intriguing season prop bets. [2]The actor who played Prop Joe, Robert F. Chew, sadly passed away in January 2013. Most of these bets are only available online, which continues to be a legal gray area. Like Prop Joe, I would never directly touch anything slightly questionable, so I will be referring to bets made by my good friend Rawls. [3]Definitely not this Rawls who is the enemy of all that is good. We’ll start with his favorite prop bet for 2014 and go from there in descending order.

Rawls’s Prop Bet #1: $76 On Any Team To Win at Least 14 Games (Odds: 3/1)

At first glance this bet seems to have a lot of merit. Since the 1987 strike, at least one team won 14 games 15 out of 26 times (57.7%). In the last 15 years, it’s even better, hitting 10 out of 15 times (66.7%). The bet only needs to win 25% of the time to break even, so this looks fantastic.

But Chase brought up a point that Rawls missed: schedule strength. The years without a 14-game winner in the last 15 years include 2012 and 2013. Rawls dismissed that as a blip, but it comes in part from two of the best teams in football playing in the same division. Moreover, the last run of years without a 14-game winner (1993-1997) also happened during a time of NFC dominance, at least until ‘97. The Cowboys played the Packers and Niners every year during that span, for example. This season, the best teams in football may have it even tougher. The Niners and Seahawks have to play each other twice, and each has one of the four hardest schedules in football this year. The Broncos get the NFC West, the Saints have the sixth-hardest schedule, and the Packers have above-average schedule strength. Only the Patriots have an easy schedule amongst the main threats to win 14 games. [continue reading…]

References

References
1 “Seinfeld” is all alone in third with a pretty big gap after that, too.
2 The actor who played Prop Joe, Robert F. Chew, sadly passed away in January 2013.
3 Definitely not this Rawls who is the enemy of all that is good.
{ 8 comments }

Unstable Divisions

The AFC East was a very stable division over the past two years. The Patriots won 12 games in 2012 and 12 more in 2013. The Bills, with six wins in 2013, also repeated their 2012 win total. Miami won 7 games in 2012, and then 8 last year. And the Jets followed up a 6-10 season in 2012 with an 8-8 season last year. That’s about as stable as a division can get. The four teams saw their win totals move by an aggregate of just three wins, making the 2012-2013 AFC East the most stable division since realignment.

On the other end of the spectrum: the NFC South. The Falcons dropped from 13 wins in 2012 to just four last year. The Panthers jumped from 7 wins in 2012 to 12 last year, and it didn’t even take Bill Parcells to do it. New Orleans also won seven games in 2012, but jumped to 12 wins in 2013. The team that saw the least movement in the NFC South last year was Tampa Bay, but the Bucs still fell from 7 wins to 4 wins, matching the total movement by all AFC East teams. As a group, NFC South teams had a change of 21 wins from 2012 to 2013, the most of any division since realignment.

That’s hardly new for the NFC South, or for that matter, the AFC East. Since realignment, the NFC South has easily been the league’s most unstable division: the Falcons, Saints, Bucs, and Panthers have seen their win totals fluctuate by an average total of 18.8 wins per year, beginning with the 2002-2003 seasons. The AFC East has been incredibly stable: no team has ever finished with more wins than New England, while the Bills have finished last or tied for last eight times since realignment. As a result, the average movement among AFC East teams — in the aggregate — has been just 6.3 wins.

RkDivisionChange in Wins/YrChange # Wins/Tm Yr
1NFC South15.73.9
2NFC North13.33.3
3AFC West11.93.3
4AFC North11.93.0
5AFC South11.72.9
6NFC East11.32.8
7NFC West10.82.7
8AFC East10.82.7

[continue reading…]

{ 1 comment }

Great Offenses and Missing the Playoffs

A common sight on any fall Sunday in the early '00s.

A common sight on any fall Sunday in the early '00s.

From 2002 to 2005, Peyton Manning was the best quarterback in the NFL, at least statistically, by a wide margin. But the #2 quarterback in Adjusted Net Yards per Attempt was Trent Green, and there was a wide gap between Green and all other quarterbacks not named Manning.  Over that same period, Tony Gonzalez led all tight ends in receptions, receiving yards, and touchdowns. And the Chiefs rushed for 34 more touchdowns than any other team, in addition to ranking third in rushing yards and fourth in yards per carry.

Kansas City ranked 4th in Adjusted Net Yards per Attempt in 2002, 1st in 2003, 3rd in 2004, and 2nd in 2005.  In terms of Adjusted Yards per Carry, the Chiefs were 2nd in 2002, 3rd in 2003, 1st in 2004, and 3rd in 2005. That’s an incredible streak of not just dominance, but balanced dominance. And Kansas City missed the playoffs in three of those four years! (pours one out for Jason Lisk).

On Monday, we looked at some great defenses that missed the playoffs. Today, a look at some of the best offenses to stay home for the winter. And in the last 15 years, the 2002 Chiefs, 2004 Chiefs, and 2005 Chiefs are the only teams to rank in the top five in both ANY/A and AYPC and miss the playoffs.

What other teams since the merger met those criteria? [continue reading…]

{ 6 comments }

Just above these words, it says “posted by Chase.” And it was literally posted by Chase, but the words below the line belong to Bryan Frye, a longtime reader and commenter who has agreed to write this guest post for us. And I thank him for it. Bryan lives in Yorktown, Virginia, and operates his own great site at http://www.thegridfe.com/, where he focuses on NFL stats and history.


In February, Chase used a regressed version of Football Outsiders’ DVOA metric to derive 2014 expected wins. If you are reading this site, you probably have some familiarity with Football Outsiders and DVOA, FO’s main efficiency statistic. Given the granularity of DVOA, it is no surprise that Year N DVOA correlates more strongly with Year N + 1 wins (correlation coefficient of .39) than Year N wins does (correlation coefficient of .32).

By now, even casual NFL fans probably have at least heard of Pythagorean wins, and regular readers of this site are certainly familiar with the concept. Typically, an analyst uses Pythagorean records to see which teams overachieved and underachieved, which can help us predict next year’s sleepers and paper tigers. Well, I wondered what would happen if we combined the two formulae to make a “DVOA-adjusted Pythagorean Expectation” (or something cooler sounding; you be the judge).

Going back to 1989, the earliest year for DVOA, I used the offensive, defensive, and special teams components of DVOA to adjust the normal input for Pythagorean wins (points). Because DVOA is measured as a percentage, I adjusted the league average points per team game accordingly (I split special teams DVOA between offense and defense). Let’s use Seattle, which led the league in DVOA in 2013, as an example.

In 2013, the league average points per game was 23.4. Last year, Seattle had an offensive DVOA of 9.4% and a defensive DVOA of -25.9% (in Football Outsiders’ world, a negative DVOA is better for defenses).  The Seahawks also had a special teams DVOA of 4.7%.  So to calculate Seattle’s DVOA-adjusted points per game average, we would use the following formula:

23.4 + [23.4 * (9.4% + 4.7%/2)] = 26.15 DVOA-adjusted PPG scored

And to calculate the team’s DVOA-adjusted PPG allowed average, we would perform the following calculation: [continue reading…]

{ 13 comments }

538: NFC West Preview Articles

Yesterday, Neil Paine previewed the NFC East teams over at FiveThirtyEight. Today, yours truly is up with a look at the NFC West.

The Cardinals won 10 games last year, only the second time the team reached double digits in victories since moving to Arizona in 1988. Their run defense was the key. The Cardinals allowed just 1,351 rushing yards, the fewest in the NFL. They ranked first in rushing defense DVOA, Football Outsiders’ main defensive statistic, and stuffed opposing ball-carriers for no gain or a loss on 28 percent of runs, the most in the NFL.

But three of the key players responsible for that success are gone, including inside linebacker Karlos Dansby. Dansby was one of just two players in 2013 to record 100 tackles, more than four sacks, and more than four interceptions. He is a very good run defender, but he is also a strong pass-rusher and is excellent in pass coverage. Of course, that’s why the Cleveland Browns signed him to a four-year, $24 million deal on the first day of free agency.

The Cardinals were prepared for Dansby’s departure, but the other two exits left the team with little time to find a solution. In June, starting inside linebacker Daryl Washington was suspended for the season for (again) violating the league’s substance abuse policy. Like Dansby, Washington is a versatile player: He’s a great pass-rusher (his nine sacks in 2012 were the most by an inside linebacker since Bart Scott’s 9.5 in 2006) and above-average in coverage, in addition to being a strong run-defender.

And last Monday, defensive end Darnell Dockett was lost for the season after tearing the ACL in his right knee. Dockett is not just an above-average 3-4 defensive end against the run, but a team leader and — along with superstar wide receiver Larry Fitzgerald — the player on the team with the longest tenure.

You can read the full article here.

{ 7 comments }

Great Defenses and Missing the Playoffs

Lewis finds out his quarterback is Kyle Boller

Lewis finds out his quarterback is Kyle Boller.

Ten years ago, the teams with three of the four best defenses in football missed the playoffs. The Buffalo Bills ranked 1st in Adjusted Net Yards per Attempt allowed and 2nd in Adjusted Yards per Carry allowed. That year, Sam Adams, Takeo Spikes, Terrence McGee, and Nate Clements made the Pro Bowl, while Aaron Schobel had 8 sacks and London Fletcher was London Fletcher but younger. The team ranked 1st in DVOA by a good margin, but finished 9-7, narrowly missing the playoffs.

That year, Baltimore ranked 4th in ANY/A allowed, 3rd in AYPC allowed, and 2nd in DVOA. The Ravens weren’t quite as good on defense as the ’00 or ’06 iterations, but still had Terrell Suggs, Ray Lewis, Adalius Thomas, Chris McAlister, and Ed Reed (not to mention a 37-year-old Deion Sanders). Of course, this was the Ravens team that was one of the most one-sided team in NFL history. Baltimore also finished 9-7 in a year where six AFC teams won double-digit games.

Over in the NFC, Washington’s defense ranked 1st in Adjusted YPC and 3rd in ANY/A in Joe Gibbs’ first season back in D.C. Marcus Washington was the team’s only Pro Bowler, but the defense featured a rookie Sean Taylor, Ryan Clark, Shawn Springs, Antonio Pierce, and Cornelius Griffin. Despite ranking 4th in defensive DVOA, the team won just six games.

So why today are we looking at these three teams, nearly ten years later? It’s not to remind you that Drew Bledsoe, Kyle Boller, and Mark Brunell failed to guide those teams to the playoffs. As it turns out, these are the last three teams to finish in the top five in both ANY/A allowed and AYPC allowed and still miss the playoffs. In fact, since 1970, just nine other teams have managed to pull off that feat.

  • In 2002, Miami ranked 5th in both ANY/A and AYPC allowed, while the Panthers ranked 4th in both categories. Carolina was a year away from a Super Bowl appearance, while the Dolphins were nearing the end of their Jason TaylorZach ThomasSam Madison run.
  • In 1999, a year before The Year, the Ravens ranked 2nd in both metrics but finished just 8-8.
  • You know all about the 1991 Eagles, so of course they are on this list.
  • The 1987 Giants, a year after winning the Super Bowl, still produced a Super Bowl caliber defense behind Lawrence Taylor, Carl Banks, Pepper Johnson, and Harry Carson, but the team’s offensive line (3rd most sacks allowed, 2nd worst YPC average) torpedoed the offense.
  • In 1978, a year before nearly carrying the team to the Super Bowl, Lee Roy Selmon and Dave Pear helped Tampa Bay rank 1st in AYPC allowed and 3rd in ANY/A allowed. But a miserable offense led to a losing record in the franchise’s third season.
  • The 1974 Packers ranked 5th in both categories. The defense sent Ted Hendricks, Willie Buchanon, and Ken Ellis to the Pro Bowl, but if you think this is just a thinly-veiled reason to bring up John Hadl, you are a regular reader of this blog.

Since 2004, six teams have ranked 1st or 2nd in AYPC allowed but missed the playoffs. Two of those seasons occurred last year, with the Jets and Cardinals, respectively. The 2006 and 2007 Vikings also join that list, along with the 2007 Ravens (a year after a magnificent season) and the 2010 49ers (a year before a magnificent season).

Having a dominant pass defense is even more likely to send a team to the playoffs. Since 2004, only one team — the 2012 Bears — ranked 1st in ANY/A allowed but missed the playoffs. The 2009 Bills are the only team to rank 2nd in ANY/A allowed and miss the playoffs, while the 2013 Bills, 2010 Chargers, and ’05 Jets are the only teams since ’04 to rank 3rd in ANY/A allowed and still fail to make it to January.

Too Long; Didn’t Read

  • The 2004 season was kind of crazy.
  • Since 2002, 24 teams have ranked in the top five in both pass defense and rush defense; five of those teams missed the playoffs, although the last 16 teams pull off this feat have made the postseason.
  • Of the 36 teams to rank in the top 3 in Adjusted Yards per Carry allowed since 2002, only 19 of those teams made the playoffs. Although it’s worth noting that eight of the 17 teams to miss the playoffs out of this group ranked 20th or worse in ANY/A allowed.
  • 28 of the 36 teams to rank in the top 3 in ANY/A allowed made the playoffs.
{ 4 comments }

Call for Guest Writers

There’s no more enjoyable community than the Football Perspective community. Over the past few months, I’ve been devoting more time to my day job, which is a very good thing. The only downside, of course, is that it leaves less time for me to devote to Football Perspective. And while The Streak is still alive, it would be nice to have guest posts from time to time.

For awhile, I was lucky to have the uber-talented Neil Paine as a guest writer at Football Perspective, but then 538 snatched him away. Then, Andrew Healy emerged out of nowhere and has been a fantastic guest writer in his own right. Well, the ink isn’t dry, but I’m hoping that Andrew has leveraged his exposure here at Football Perspective into another great gig. I’ll be sure to let you know if that happens, although I hope regardless we’ll still be seeing some of Andrew around here. [1]Is this an unbashed way of saying contributing at Football Perspective is a good way to get noticed? Absolutely! But it sure wouldn’t hurt to have another writer or two who was willing to contribute.

To be clear, Football Perspective has always encouraged guest submissions: Steve Buzzard was a fan of the site and submitted a couple of guest posts. [2]And Steve has since been hired by Footballguys.com. And, of course, there was Shattenjager’s legendary post on the Swamp Fox. But in case you weren’t clear, Football Perspective willingly accepts guest post submissions. If you ever want to submit a guest post, all you need to do is write it and email it to me at chase[at]footballperspective[dotcom]. I don’t need a bio or an explanation for why you should be considered for a guest post: at Football Perspective, content trumps all.

References

References
1 Is this an unbashed way of saying contributing at Football Perspective is a good way to get noticed? Absolutely!
2 And Steve has since been hired by Footballguys.com.
{ 8 comments }

Lynch leads the league in Skittles eaten over average

Lynch leads the league in Skittles eaten over average.

Over the last three years, no player has recorded more carries than Marshawn Lynch. But while Lynch’s 901 carries may lead the league, that’s a pretty low number, at least in modern history. The 2011-2013 seasons very nearly became the first three-year period where no running back had 900 carries since 1989 to 1991, which was essentially the post-Eric Dickerson/pre-stud running back era. This jives with what we’ve seen on a broader level, in that the NFL is both veering away from rushing and towards running back committees, two factors which have combined to torpedo running back value.

The table below shows the leader in rush attempts for every three year period beginning with the AFL-NFL merger. Here’s how to lead the Lynch line: From 2011 to 2013, Lynch, who was 27 in 2013, led the NFL in carries. Over that period, he rushed 901 times for 4,051 yards, a 4.50 yards per carry average. [continue reading…]

{ 6 comments }

Sons of Anarchy

Sons of Anarchy.

I’ve already spent some time this off-season discussing the Rams fantastic front four. Robert Quinn made the Pro Bowl last season, and he’s a good bet to make the trip to Hawaii again this year as long as he stays healthy. Adding Aaron Donald to a line that also has Chris Long and Michael Brockers means St. Louis should have the best 4-3 defensive line in the NFL this year.

The best 3-4 defensive line? That honor probably belongs to the New York Jets. Muhammad Wilkerson made the Pro Bowl last year and would have been a second-team AP All-Pro choice if that organization knew anything about how to create a ballot. The other defensive end, Sheldon Richardson, was the AP Defensive Rookie of the Year. The nose tackle, Damon Harrison, was easily the top run-stuffing tackle in the NFL last year according to Pro Football Focus, and was PFF’s highest-graded nose tackle overall.  You will probably find this hard to believe, but Rex Ryan has said that he wants to have all three of the Jets starting defensive linemen make the Pro Bowl.

How rare is that? Pretty rare — in fact, a 3-4 line has never sent all three players to the Pro Bowl. But even among 4-3 teams, sending three defensive linemen to Hawaii is a very rare feat. Although you might be surprised about when it last happened.

Trivia hint 1 Show


Trivia hint 2 Show


Trivia hint 3 Show

Click 'Show' for the Answer Show

What other teams have sent three defensive linemen to the Pro Bowl during the Super Bowl era? [continue reading…]

{ 2 comments }

Mick Tingelhoff is the 2015 Senior Committee Nominee

Another HOF battery?

Another HOF battery?

Dermontti Dawson is the only Hall of Fame center to play in the NFL in the last 20 years. Go back 30 years, and the only other HOF centers are Mike Webster and Dwight Stephenson. Go back a few more years, and you only get to add Jim Langer. In fact, since 1975, the only teams to have Hall of Fame centers were the Steelers and Dolphins. [1]Yes, I know Webster’s career ended with the Chiefs and Langer’s with the Vikings. And that Bruce Matthews played a little bit of center, too.

Go all the way back to 1960, and the only other Hall of Fame centers to play in the NFL were Jim Ringo and Jim Otto. In other words, the Pro Football Hall of Fame has a center problem. And the nomination of Mick Tingelhoff for induction into the HOF is one small step towards fixing that problem.

This year, the Pro Football Hall of Fame has named Tingelhoff the 2015 Senior Committee Nominee.  Tingelhoff still needs to have 80% of the voters give him the thumbs up, but unlike other players, he won’t be “competing” against the rest of the field for the right to earn a bust. Tingelhoff’s candidacy will be handled via a simple yes or no vote.

Hall of Fame fans may wonder why I’m talking about the Senior nominee, because there are generally two nominees from the Senior Committee.  But things have changed for this year:

A bylaws modification to the selection process was approved earlier this month by which a Contributor – defined as an individual who has “made outstanding contributions to professional football in capacities other than playing or coaching” – will automatically be included among the annual list of finalists for election. The Contributor finalist will also be voted on for election independent of all other finalists.

The Hall of Fame’s Board of Trustees, in an effort to address the backlog of deserving Contributor candidates, also approved a temporary measure allowing for two Contributor finalists in years one (starting with the Class of 2015), three and five, of the next five years. In years two and four of that same period, there will be just one Contributor finalist. To keep the maximum number of nominees elected at no more than eight per year, the Senior finalists will be reduced from two to one per year in years one, three and five of the same five-year period. In years two and four and each year thereafter, there will be two Senior finalists.

[continue reading…]

References

References
1 Yes, I know Webster’s career ended with the Chiefs and Langer’s with the Vikings. And that Bruce Matthews played a little bit of center, too.
{ 29 comments }

Football Perspective/FanDuel Promotion

Football Perspective is teaming up again with the fine folks at FanDuel to provide another promotion for our readers. As you know, Football Perspective turns down just about advertising requests. But this is different, and frankly, this isn’t even advertising. Because we’ve got a great community here, FanDuel is happy to bring a fun promotion to those readers who may be interested in playing.

For the uninitiated, FanDuel is fantasy football with a twist: you compete for real money by selecting any player you want each week under a salary cap format. Each player has a price, so the goal is to figure out who are the undervalued players and fit nine starters under a salary cap. Instead of drafting a team for a season, you draft a team for a week, as frequently or infrequently as you like (i.e., you can enter every week, or play in week 1, week 3, and then every week the rest of the year starting in week 10 — and not be behind the curve). You can compete in games for as little as $1 or as much as $535 per game. Once you play around with the site, you’ll see all the different options: head-to-head games, 50/50 games, 3-man, 5-man, 10-man, 20-man, or big tournament games.

That’s cool, but what’s really cool is that because FanDuel is a fan of Football Perspective, the site is offering a great promotion. If you haven’t deposited money with FanDuel before, a 100% deposit bonus (for up to $200) will be provided to Football Perspective readers. Click here to sign up by clicking the orange “Play Now” button, and the promo code PERSPECTIVE will be entered for you.  If you put down $100, you’ll now have $200 to play with.  Deposit $200, and you’ll get $400. That’s a pretty sweet deal. If you have experience any problems, please post a note here in the comments or email support[at]fanduel[dot]com.

Another cool feature: if there’s enough interest, FanDuel has offered to set up some a weekly tournament among Football Perspective readers.  In any event, I plan on competing most weeks this year — and, of course, blogging about it — as I think the daily game space is one of the most exciting parts of fantasy football. I’ll be competing as ChasePerspective.

So how do you play? You pick 1 QB, 2 RB, 3 WR, 1 TE, 1 PK, and 1 DT each week. There’s a salary cap of $60K. And that’s pretty much all you need to know.  Of course, here are some of my thoughts on strategy: [continue reading…]

{ 7 comments }

Over at Five Thirty Eight, I look at whether the Broncos pass offense, or the Seahawks pass defense, is more immune from regression to the mean.

 As a general rule, elite offenses are further from league average than great defenses, so offensive regression isn’t as likely as defensive regression. It helps, too, that research has shown offenses to be more consistent from year to year than defenses. All else being equal, we would expect the Broncos to be the more likely team to repeat last year’s brilliant performance.But all else isn’t equal. Denver produced 2013’s record-breaking numbers while playing defenses from the AFC South and the NFC East; those will be replaced this year by the AFC East and the NFC West, divisions that present much more formidable challenges. That’s a significant change.

According to Football Outsiders, Denver played the third-easiest slate of opposing defenses in 2013. Based purely on adjusted net yards per attempt, the average defense Manning faced last year was 0.44 ANY/A below average, and that’s after adjusting those defenses’ ratings for the fact that they played Manning. Only Alex Smith and Robert Griffin III faced more cupcakes. Last year, Manning didn’t Omaha against a single defense that ranked in the top eight in strength-of-schedule ANY/A; this year, he’s set to face six opponents that ranked in the top eight in that metric in 2013.

You can read the full article here.

{ 20 comments }

Is Quarterback Stability on the Rise?

This time last year:

Brady will be the Patriots week 1 starting quarterback for the 13th year in a row.

Brady will be the Patriots week 1 starting quarterback for the 13th year in a row.

It’s easy to remember those times and think “man, life moves pretty fast.” But I’m going to take the opposite approach.

Twenty-five teams — twenty-five teams! — are bringing back the same week 1 starting quarterback from week 1, 2013. That, of course, doesn’t include Foles or Henne, who ended last year as starters. Last year, twenty-six teams had the same week one starter as they did in 2012. As it turns out, the past two seasons have seen the highest week 1 starting QB retention rate of any seasons since the merger. [continue reading…]

{ 2 comments }

Not Tim Couch

Not Tim Couch.

The preseason is meaningless, right? Well, as it turns out, it might give us a window into quarterback development, despite what you might think. The threshold for whether the preseason is useful is whether including that information tells us anything about a quarterback’s potential that we don’t already know from his draft position (or perhaps certain analytics). I have been putting together data from preseason box scores going back to 1997. The data show that, for some quarterbacks, the preseason is not quite meaningless.

Neil Paine showed some interesting evidence relating to this idea on Friday. Looking at team performance since 2009 for teams with new quarterbacks, Neil showed that preseason passing efficiency helps predict regular season passing efficiency. It’s important to note that part of this result may have been pretty predictable even before we watched those preseason games. The 2012 Redskins replaced Rex Grossman and John Beck with the #2 pick in the draft who would have been #1 in an average year. So we would expect a big improvement to come just by way of moving from Grossman to a healthy RGIII. [continue reading…]

{ 12 comments }

Updated: Vegas Futures Wins Totals

Some background links:

Today I want to look at the latest odds from Vegas on NFL futures, this time courtesy of Bovada.  While we often focus on the number of wins a team is projected to have, the payouts associated with each bet are also key sources of information. Consider the Bears and the Panthers, two teams Bovada has pegged at 8.5 wins. You might think Chicago projects as a better team than Carolina this year; as it turns out, so does Bovada.

If you want to bet on Chicago winning more than 8.5 games this year, Bovada is requiring you bet $155 just to win $100 in the event the Bears win nine games. Of course, if you’re brave enough to suggest that the Bears will win eight or fewer games, Bovada would pay you $125 for your $100 bet. While Chicago is at -155(o)/+125(u), the Panthers are at +145(o), -175(u). So if you think the Panthers are overvalued at 8.5 wins, well, you need to bet $175 on the under just to win $100 if Carolina falls short of that number. On the other hand, Bovada would pay you $145 if you want to take the Panthers winning nine or more games.

Based on those numbers, we can conclude that Vegas thinks Chicago has a 58.2% chance of going over 8.5 wins [1]The -155 implies a 60.8% chance of going over 8.5 wins (155/255), while the +125 on the under implies a 55.5% chance of going over 8.5 wins (1 – [100/225]).  The average of 0.555 and 0.608 is … Continue reading, while Carolina has just a 38.6% chance of going over 8.5 wins. [2]An over line of +145 implies a 40.8% chance of going over (100/245), while an under of -175 implies just a 36.4% chance of going over (1 – [175/275] The table below shows the number of projected wins for each team in the NFL this year, along with the lines associated with their over and under bets. The final column shows the implied likelihood (by the over/under lines) of the team going over their win total; that column was used to break ties between teams with the same number of projected wins.

[continue reading…]

References

References
1 The -155 implies a 60.8% chance of going over 8.5 wins (155/255), while the +125 on the under implies a 55.5% chance of going over 8.5 wins (1 – [100/225]).  The average of 0.555 and 0.608 is .582.
2 An over line of +145 implies a 40.8% chance of going over (100/245), while an under of -175 implies just a 36.4% chance of going over (1 – [175/275]
{ 12 comments }

The Rams and First Round Linemen

Robert Quinn finds out who the team's offensive coordinator is

Robert Quinn finds out who the team's offensive coordinator is.

Bill Barnwell and Robert Mays do a great job on their NFL podcasts. Yesterday, I listened to their NFC West preview, and it’s just stunning the amount of highly drafted talent the Rams have on both lines. We already know that the Rams have four former first rounders on the team’s starting defensive line, making them the first team since the 2012 Saints to pull off that feat. With Robert Quinn, Chris Long, Michael Brockers, and Aaron Donald, St. Louis has the best defensive line (at least on paper) in the NFL.

But the Rams also have two former first round picks on the offensive line, too, with Jake Long and Greg Robinson, the team’s first overall pick this year.  In fact, consider:

  • St. Louis has three linemen who were first or second overall picks: Long, Long, and Robinson. (Imagine if the Jason Smith pick worked out?)
  • The Rams also have three other linemen drafted in the top fourteen in Quinn, Brockers, and Donald.
  • Add in Rodger Saffold, and seven of the Rams’ starting nine linemen were drafted in the top 33. The exceptions: Scott Wells and Joe Barksdale.

[continue reading…]

{ 6 comments }

Site News: Call For Help

As regular readers know, this website has been experiencing some significant issues over the past couple of days. For long stretches, the website was down, and certain pages have been unavailable throughout this period.

Why? That’s the tricky part. I’m not a tech guy, but as best I can tell, there were two issues:

1) Server trouble

The site is run on HostGator, and their customer support has been as effective as the Cowboys defense. I was informed that HG had temporarily restricted access to MySQL, which turned into several long stretches of temporary restrictions. I was also told that HG could not tell me what the problem was.

Initially, I was told that I had too many active plugins. I was using 20 plugins, and all seemed pretty useful, but I deactivated a few in hopes of fixing this problem. It did not. It may have been because traffic has been spiking (good news/bad news!), or it could be because I was using too many resources. I was basically told to go figure it out myself.

One solution would be to move the account to a dedicated server. A cheaper option would be to figure out how to optimize MySQL resource usage. I’ve also been told by some friends that there are even “simpler” solutions, including using a caching plugin. So I’ve tried doing that now, too, although that of course involves using another plugin.

Right now, the site is working just fine. And I’ve got a caching plugin going, which hopefully works. I also have tried to deactivate some other plugins. Will this fix the problem? I have no idea.

How you can help

I have no tech experience. When I started this site a little over two years ago, my biggest concern was the tech side of things. I’ve been able to survive with only a few bumps along the way, but I could really use a few helping hands. If you know are a developer, or understand what MySQL resource usage means, or have thoughts on how to fix things, they would be greatly appreciated. And if you can provide help with issue #2, that would be great, too.

2) Spammers

One IP address in Turkey tried to access the site 1210 times in one hour. This was the cause of the most recent restriction imposed by HG, and I think HG for actually telling me the reason this time. They also went ahead and banned that IP address.

Has this been happening before? Are other IP addresses trying to spam the site? As I understand it, certain countries are notorious for this, so some similar sites have been any IP address from those countries. To the extent you guys could help me figure out how to do this, or if this is an issue for my site, that would be great, too (I think you can do this in Cpanel, although again, this is not my area of expertise).

Summary

I could use some tech help. I’m doing my best to keep things running, but I have a day job that demands a significant amount of my time. As you can imagine, writing takes up quite a bit of time, too. As a result, there’s no time left over for me to handle tech issues. What’s the solution? I’m working on a couple, but a great short-term solution would be if any Football Perspective fans could offer some tech guidance.

Thanks, and I apologize for the intermittent site issues over the past few days.

Chase

{ 10 comments }

Over the last three seasons, Calvin Johnson has caught 5,137 yards of passes. That’s an incredible amount, and the most by a player over any three-year span in NFL history. That stat by itself isn’t proof of Johnson’s greatness – after all, Detroit has thrown 2,040 passes over the last three years, also the most in any three-year span in football history. But records are not just about greatness: records are a function of era, teammates, and many more elements than pure ability.

So can Calvin Johnson break Jerry Rice’s career receiving yards record? The odds are very long that Johnson will go down in history as a better receiver than Rice, but his odds at breaking his receiving yards record – almost by definition – are a little higher. The man known as Megatron has 9,328 career receiving yards, the third most of any player through his age 28 season. That gives him a 1,462-yard lead on Rice at this age, although Johnson will have to keep up his outstanding pace for a very long time if he wants to capture the record. As the graph below shows, Johnson has had an edge on Rice in career receiving yards through every age of his career to date, but it was Rice’s work in his thirties that separated the GOAT from the pack: [continue reading…]

{ 18 comments }
Gronk can catch, block, and spike. But can he do all that without getting injured?

Gronk can catch, block, and spike. But can he do all that without getting injured?

In the 2011 AFC Championship Game against the Ravens, Bernard Pollard happened to Rob Gronkowski. And the Patriots offense ground to a halt for the rest of the game before being held to just 17 points in the Super Bowl. [1]Yes, a very limited Gronk played in SB XLVI, but he had only two catches and jumped like me when battling Chase Blackburn on Brady’s underthrown fourth quarter pick. In 2012, it was a freak injury on an extra point and then a reinjury in the divisional playoffs against the Texans. After that, the Patriots offense put up only 14 against the Ravens in the 2012 AFC Championship Game. Last year against the Browns, he took one of those horrible hits that make you cringe and want to keep him away from running seam routes in any regular season game. [2]The link is of Gronk shopping for groceries instead of the hit, because who wants to see that again? And the Pats put up 16 points against a mediocre and banged-up Broncos defense in the AFC Championship game. [3]The only two games all season where the Broncos gave up fewer points were against Houston and Oakland.

The Gronkowski injuries provide a tantalizing set of what-ifs. The Patriots have been within two games of a title the last three years. A healthy Gronkowski could have made the difference in any of those years. The Football Outsiders’ Almanac shows that the Pats’ offense was actually pretty good late in the season without Gronk, but they were terrible early in the year―they actually had a negative DVOA without him. Over the last two regular seasons, the Pats have averaged 34 PPG with Gronkowski, but six points fewer in New England’s 14 Gronk-less games.

And as much as I believe in stats, I’m not sure we really need them to tell us that Gronkowski is one of the most important non-quarterbacks in football. If he’s healthy through the playoffs, the Patriots seem likely to be neck-and-neck with the Broncos. With a defense that may be one of the best in football, I’d argue that the Pats should be a little better than the Broncos, even. [4]Unless Manning is just much better than Brady, I guess. I’m not seeing that. Denver’s only other big advantage is at receiver. Fine, but a healthy Gronkowski seems to even up a fair bit of that. … Continue reading Regardless, the Pats offense has been uniformly excellent with a healthy Gronkowski since 2010. Taking just the games where Gronk played, the Pats have ranked 1st, 3rd, 1st, and 2nd in offensive DVOA over the last four years.

That means one of the most important questions in the NFL in 2014 is whether we’ll see a healthy Gronkowski through the end of the season and into the playoffs. At this point, I think the reflexive answer is to assume that the answer is “no.” It certainly doesn’t feel like he’s going to be healthy. But previous examples of players getting hurt can provide some insight into Gronkowski’s actual chances.

Recovery for Injured Young-and-Excellent Players

In his second year, Gronkowski had an Approximate Value (AV) of 14. He then played only parts of the next two seasons due to injury. Considering players who started their careers since 1970, there have been 34 who had an AV season of at least 13 in their first two years and who then did not start at least 25% of the games in the following two years. This is a reasonable list of young-and-excellent players who then missed significant time in years 3 & 4. Most of these players missed time due to injuries, although some of those cases were a bit debatable. [5]In addition, I omitted two players who were obviously benched for other reasons: Shaun King and Derek Anderson. And Joe Cribbs, who went to the USFL for the fifth year of his pro career. Regardless, the conclusions are pretty much the same if we drop some of those cases. [continue reading…]

References

References
1 Yes, a very limited Gronk played in SB XLVI, but he had only two catches and jumped like me when battling Chase Blackburn on Brady’s underthrown fourth quarter pick.
2 The link is of Gronk shopping for groceries instead of the hit, because who wants to see that again?
3 The only two games all season where the Broncos gave up fewer points were against Houston and Oakland.
4 Unless Manning is just much better than Brady, I guess. I’m not seeing that. Denver’s only other big advantage is at receiver. Fine, but a healthy Gronkowski seems to even up a fair bit of that. And then there’s Brandon LaFell’s impending record-breaking season. I’m about to get shouted down. [Chase note: I don’t know how much longer I can stomach Andrew writing for Football Perspective.]
5 In addition, I omitted two players who were obviously benched for other reasons: Shaun King and Derek Anderson. And Joe Cribbs, who went to the USFL for the fifth year of his pro career.
{ 6 comments }

Yesterday, I looked at how long it took the best quarterbacks to break out. Today, I want to apply what we learned from that post to 15 current NFL quarterbacks with fewer than 50 starts, all of whom were 26 years old or younger during the 2013 season.
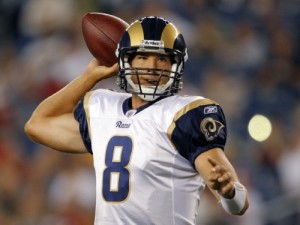
Bradford looks to check down

Bradford looks to check down.

Sam Bradford (49 career starts): Career Relative Adjusted Net Yards per Attempt of -0.68.

Bradford was overrated after he put up good counting stats but weak efficiency numbers as a rookie; he posted a -1.0 RANY/A in 2010, a -1.4 average in 10 starts in 2011, was at -0.3 in 16 starts in 2012, and then +0.2 in seven starts last year. Yesterday, we noted that great quarterbacks who came to terrible teams (Warren Moon and Drew Brees, in addition to former number one picks like Troy Aikman, Terry Bradshaw, Vinny Testaverde, and Steve Young) struggled initially. Bradford would seem to fit that mold, although he’s now 49 starts into his career. Are there other reasons to give him a pass?

St. Louis had the third-youngest offense in the NFL last year, and the man who has gained the most yards from Bradford over the last four years is Brandon Gibson. The former first overall pick has received very little help, and been saddled with a revolving door of mediocre receivers.

On the other hand, Kellen Clemens posted better numbers than Bradford last year, at least when you adjust for strength of schedule. As Bill Barnwell pointed out last week, Bradford’s big problem is his inability to throw the ball down the field, which jives with some of the work I’ve done Bradford’s historically low yards per completion averages.  If not for Bradford’s first season of above-average work last year, I’d say his odds of ever being a franchise quarterback are very low.  But there has been some progression, and he does fit the mold of number one pick being saddled with bad teammates.  Of course, the presence of Brian Schottenheimer is enough to make me skeptical of Bradford’s ability to put it all together this year.  Perhaps the best case scenario is a Testaverde-like revival with another team years from now.

Cam Newton (48 career starts): Career RANY/A of +0.30.

Not much to see here. Newton’s RANY/A has moved from +0.3 as a rookie to +0.7 in 2012 to -0.2 last year; it went under the radar because #QBWINZ, but Newton did have a down season in 2013.  It’s hard to find any reasons for optimism for the Panthers this year after a mass exodus in the offseason, but that doesn’t say much about Newton’s long-term prospects.   Add in his rushing ability, and Newton has shown enough to say that he’s still in contention (if he’s not already there) to go down as a franchise quarterback.

Andy Dalton (48 career starts): Career RANY/A of -0.01.

Look at that, Dalton is almost perfectly average! Bill Barnwell did a nice job profiling Dalton last week, and it does seem like what you see is what you will get from Dalton.  After posting slightly below-average RANY/A numbers in 2011 and 2012, he was above-average (+0.4) last year.  But the Bengals have one of the most talented offenses in the NFL if you exclude the quarterback position; at this point, you’d be hard-pressed to find many folks who believe Dalton will turn into a future star.

Of the 42 quarterbacks I looked at yesterday, 13 failed to be significantly above-average during any of their first three 16-game samples.  Dalton doesn’t really resemble any of them: Bradshaw/Testaverde/Elway/Vick were former number one picks; Brady/Favre/Krieg/Kelly were on the border of being good enough on to not make the list, and were certainly ahead of where Dalton is now; McNabb and Cunningham were running quarterbacks.  Moon played for a terrible team, and Gannon and Theismann sat for long stretches.  That’s the full thirteen. The best case scenario may be that Dalton turns into a Krieg or a poor man’s Jim Kelly.  Of course, he could also win a Super Bowl by riding the coattails of one of the more talented (and youngest) rosters in the league.

Christian Ponder (35 career starts): Career RANY/A of -1.19.

There are always excuses to be made for bad quarterbacks, and I’m sure that there are still some Vikings fans who believe in Ponder.  He produced a -1.7 RANY/A as a rookie, improved to -0.9 in 2012, but was back at -1.1 in nine starts last year.  Minnesota may not have a ton of talent at wide receiver, but Ponder’s failure to produce even with Greg Jennings is yet another strike against him. The Vikings drafted Teddy Bridgewater at the end of the first round in the 2014 draft, which seems like the beginning of the end for the former Florida State star.
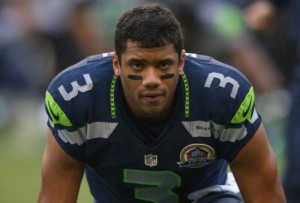
Wilson is watching game tape right now.

Wilson is watching game tape right now.

Russell Wilson (32 career starts): Career RANY/A of +1.15.

Franchise quarterback achievement badge mode: unlocked.

Ryan Tannehill (32 career starts): Career RANY/A of -0.80.

Tannehill was at -0.7 RANY/A in 2012 and at -0.9 RANY/A last year; neither of those numbers put his future prospects in a positive light.  There are excuses, to be sure: he was a raw prospect, the Dolphins offensive line was the worst in the NFL, he and Mike Wallace have the chemistry of a pair of tomatoes, etc., but the numbers are bleak enough to cast doubt on Tannehill’s future.  Unless the argument is that Tannehill landed on one of the very worst offenses in the league — which would allow you to lump him in with the Aikmans, Bradshaws, Breeses, and Testaverdes of the world — there is simply no precedent for a quarterback being this below average for this long and then turning into a franchise passer. [1]I suppose one could point to Phil Simms, but I’d object for a couple of reasons. For one, Simms didn’t crack my initial list, checking in at #86 in my GQBOAT series.  Then again, … Continue reading Barnwell is a little (and only a little) more bullish on Tannehill than I am, but 2014 would appear to be Tannehill’s last chance to convince the Dolphins that he was not a wasted pick.  There are a couple of mitigating factors here — the running game has been terrible, and as an immediate starter, Tannehill is at a disadvantage relative to other quarterbacks on this list — but I’m not going to lose sleep over whether this prediction will look bad in a few years.

Andrew Luck (32 career starts): Career RANY/A of -0.06.

Since starting this site, Luck has been one of the quarterbacks I’ve profiled the most.  He wins without much help and is an ESPN QBR star, but he’s below average in ANY/A.  I’m inclined to grade Luck on a curve — after all, the Colts team he inherited didn’t look any better than the ’70 Steelers or ’89 Cowboys or ’87 Bucs.  On the other hand, Reggie Wayne and T.Y. Hilton have given Luck some excellent targets, which has probably been enough to boost his ANY/A to league-average proportions.

Perhaps the best comparison will be to another quarterback drafted first overall by the Colts who had a magical history of producing comebacks: John Elway.  In any event, Luck’s already a franchise quarterback.
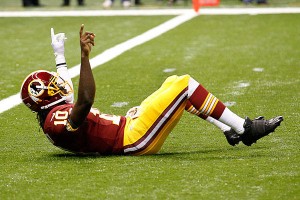
Can RG3 get up from a disastrous 2013?

Can RG3 get up from a disastrous 2013?

Robert Griffin III (29 career starts): Career RANY/A of +0.5.

Griffin’s career RANY/A is like measuring the temperature of a person with a foot in the freezer and a foot in a frying pan.  As a rookie, he had a RANY/A of +1.5; last year, it was -0.4, and that number doesn’t begin to explain how ugly things were in D.C.  The simplest explanation is that Griffin is a franchise quarterback who struggled last year as he recovered from ACL surgery and dealt with an ego-maniacal head coach.  But it’s hard to just assume Griffin is a franchise quarterback after 2013.  If Griffin one day turns into a Hall of Famer, we’ll remember that it was obvious from the start, as he had one of the greatest rookie seasons ever.  If he flames out, the first chapter of that book has already been written, too.

Blaine Gabbert (27 career starts): Career RANY/A of -2.15.

Spoiler alert: Gabbert is not a franchise quarterback.  He started at -2.2 RANY/A as a rookie on a team not dissimilar from the ’89 Cowboys; he’s followed that up, however, with a -1.2 RANY/A in 2012 and a -4.7 RANY/A over three starts last year. Suffice it to say if Gabbert turns into a franchise quarterback, it will have taken the greatest reclamation project in NFL history.

Colin Kaepernick (23 career starts): Career RANY/A of +1.06.

Kaepernick was mind-bogglingly efficient in 2012, producing a +1.6 RANY/A over 13 games and seven starts.  That number dropped to +0.8 RANY/A last year, but much of that is due to the loss of Michael Crabtree.  With an all-star crew of receivers set to take the field in 2014, I expect another very strong year out of Kaepernick. He may not be a finished product, but he already has the label (and contract) of a franchise quarterback.

Jake Locker (18 career starts): Career RANY/A of -0.25.

Maybe it’s because I’m a college football guy, too, but doesn’t it feel like Locker has already been around forever? I can’t believe he only has 18 career starts. And his RANY/A is nearly league-average, even if it doesn’t feel like Locker has been even that good.  I was not a fan of him as a prospect, but he has been better than I feared.  While we shouldn’t compare Locker’s first 18 starts to those of a quarterback who started immediately, I think Locker has shown enough that you can’t just write him off just yet.  On the other hand, his numbers last year were a bit inflated by one of the NFL’s easiest schedules. Like Tannehill, this is the crucial season for Locker, who also carries with him the injury prone label. But if Locker can stay healthy and produce strong numbers, Ken Whisenhunt may prove that he really is a quarterback whisperer (to the extent he’s not whispering to someone named Skelton, or Kolb, or Anderson, or Leinart, or Lindley, or Hall….)

Nick Foles (16 career starts): Career RANY/A of +1.45

Foles had a rookie RANY/A of -0.8 before posting an absurd +3.3 RANY/A in 2013. Even the bigger Eagles homer would admit that much of Foles’ success was due to good fortune, the presence of Chip Kelly, or both.  Foles may not have arrived just yet as a franchise quarterback, but if he turns into one, nobody will ever question when we first saw a glimpse of that ability.

Geno Smith (16 career starts): Career RANY/A of -1.70.

Smith was bad — really bad — for long stretches as a rookie.  But he finished the season well, and terrible rookie numbers on a talent-deficient offense are not the death knell for a quarterback’s career.  The Jets need to see a lot more from him this year, though, and he’ll need to produce roughly league-average numbers to make the Jets think he’s not just another Mark Sanchez.

Mike Glennon (13 career starts): Career RANY/A of -0.9.

Glennon had a very different rookie campaign than Smith, but the acquisition of Josh McCown sends Glennon to the bench, at least for now.  We don’t know how he’ll fare in (or when he’ll see) his next three starts, but Glennon’s performance through 16 starts likely won’t be enough to write him off.

EJ Manuel (10 career starts): Career RANY/A of -1.0.

Manuel had a rough rookie year, especially when you consider how much worse he looked than Thaddeus Lewis. On the other hand, ten starts of bad (but not horrendous) play certainly isn’t enough to write off Manuel, not when Smith was worse for a longer stretch.  Still, as with Smith, this is a big year for Manuel, especially after the team went out and acquired Clemson’s Sammy Watkins.

References

References
1 I suppose one could point to Phil Simms, but I’d object for a couple of reasons. For one, Simms didn’t crack my initial list, checking in at #86 in my GQBOAT series.  Then again, I’ve made the argument that Simms’ numbers underrate him because of his terrible receivers, so I would morally classify Simms as a franchise quarterback. However, the Giants teams of the late ’70s and early ’80s were so terrible that he really has more in common with the Aikmans of the world than someone like Tannehill. Here is how Simms fared compared to the other Giants quarterbacks during Simms’ first three years and 1978, the year before he came to New York. That’s U-G-L-Y. But if Dolphins fans want to point to Simms as a pro-Tannehill example, so be it.
{ 9 comments }

A couple of years ago, I asked how long it should have taken the Jaguars to move on from Blaine Gabbert. Today I want to revisit that general idea, but look at how long it takes the best quarterbacks to identify themselves as top-tier players. A couple of months ago, I looked at the greatest quarterbacks of all time. Using the top 75 quarterbacks from that list, I removed any player whose career began before the merger; that left me with 42 passers.

First, I looked at how each quarterback fared in relative Adjusted Net Yards per Attempt — i.e., ANY/A relative to league average — through their first 16 starts. Just over two-thirds of these passers were above average during their first 16 starts, with 1/3 of those quarterbacks being at least 1 ANY/A better than league average.  That group of fourteen quarterbacks — which Aaron Rodgers just falls shy of joining — can be categorized as above-average quarterbacks from the beginning. They are Kurt Warner, Dan Marino, Daunte Culpepper, Chad Pennington, Tony Romo, Mark Rypien, Jeff Garcia, Boomer Esiason, Ben Roethlisberger, Philip Rivers, Matt Ryan, Joe Montana, Steve McNair, and Ken Stabler. Obviously a number of those quarterbacks were not immediate starters in the NFL, but they did excel as soon as they became starters.

The graph below shows each of the 42 quarterbacks’ Relative ANY/A through their first 16 starts. The X-Axis represents the quarterback’s first year, and the Y-Axis shows their RANY/A value through 16 starts.

QB breakout 1

Now, let’s remove the 14 quarterbacks who had a RANY/A of at least +1.0 through their first sixteen starts. How did the other 28 quarterbacks fare in starts 17 through 32 in RANY/A? Eleven of them produced a RANY/A of at least +1.0 in their next sixteen starts: Bert Jones, Matt Schaub, Ken Anderson, Peyton Manning, Aaron Rodgers, Brad Johnson, Carson Palmer, Jim Everett, Steve Young, Dan Fouts, and Steve Grogan.

[continue reading…]

{ 24 comments }

Super Bowl Champions and Top-Heavy Divisions

The NFL realigned its divisions in 2002, placing four divisions of four teams each in each conference. Some divisions have been top-heavy, with the most obvious example being the 2007 AFC East. The Patriots won 16 games, while the Jets, Dolphins, and Bills combined to win just twelve games (with six of those twelve wins by the Bills or Jets against the Dolphins or Jets). That means New England was responsible for 57% of all wins by AFC East teams in 2007, easily the highest percentage of any team in a division since realignment.

Having an easy division brings some advantages: being the best team in a bad division makes it easier to get the best record in the conference, which leads to a bye week and home field advantage.  It also could allow a team to rest its starters at the end of the year.  Conversely, there’s the notion that teams in tough divisions “beat up on each other,” so presumably that’s another benefit to being the best team in a bad division.

But New England, of course, didn’t win the Super Bowl in ’07.  That year, the title went to the NFC East, which was not a top-heavy division; the Cowboys had just 33% of NFC East wins that year, placing it as the 3rd least top-heavy division in the NFL.  The last three years, things have been even more stark:

  • The NFC West was one of the strongest divisions in NFL history last year; but while the Seahawks may have been beaten up by the 49ers, Cardinals, and Rams, that didn’t stop Seattle from winning the Super Bowl.  Seattle won “just” 31% of the games won by the NFC West last year — only the NFC North (Green Bay, 29%) was less top-heavy.
  • The least top-heavy division in football in 2012 was the AFC North. Baltimore won 10 games, but so did Cincinnati, and the Steelers (8) and Browns (5) were not pushovers, either. The Ravens won just 30% of all games won by AFC North teams in 2012, but finished the year by hoisting the Lombardi Trophy.
  • In 2011, the Giants won a competitive NFC East with a 9-7 record; Philadelphia and Dallas were just one game behind, and New York won only 30% of all games won by NFC East teams that year. Only the Tim Tebow-infected AFC West was less top-heavy (Denver won 26% of all AFC West games, just barely above the minimum threshold for a division champ) that year.

The graph below displays all eight divisions for each year since 2002.  The Y-axis shows the percentage of games won by the top team in the division as a percentage of the total wins by that division.  The X-axis represents the year; the red dot represents the division with the eventual Super Bowl champ, with the blue dot for all other divisions. [continue reading…]

{ 8 comments }

Jerome Bettis is a polarizing Hall of Fame candidate. I’m on the fence with the Bus; I don’t think he’s as deserving as Steelers fans think, but he’s a more deserving candidate than those who mostly remember end-of-career-Bus remember. One thing I’ve heard from time to time about Bus is that he was the greatest “big” back of all time. That’s undoubtedly true, assuming you set the weight [1]Try the veal. high enough. Bettis had an official playing weight of 252 pounds, and no running near that weight can match his resume. Cookie Gilchrist, Pete Johnson, Marion Butts, Christian Okoye, Natrone Means, and Mike Alstott had short bursts of success, but they can’t match Bettis’ longevity. Players like Jamal Lewis, Michael Turner, Larry Csonka, Eddie George, Jim Brown, Franco Harris, John Riggins, and Earl Campbell carried the “big back” label, but all were 10-25 pounds lighter than the Bus.

I looked at every running back in history, and calculated his number of rushing yards over 500 in each season (to avoid giving undue weight to compilers). After adjusting for season length, I then calculated career grades in this statistic. In the graph below, the Y-Axis shows this career rushing grade, while the X-axis displays weights. Bettis is represented on the far right with the code “BettJe00.”

[continue reading…]

References

References
1 Try the veal.
{ 28 comments }

Footballguys.com – Why You Should Subscribe

Regular readers know that I’m one of the writers at Footballguys.com. I think regular readers know that I’m not a very good salesman, either. But if you are a hardcore fantasy footballer, you probably already know that Footballguys.com is the single best source for fantasy football information. If you are a more casual fantasy football player, you’ll find that the tools available at Footballguys will make life much, much easier for you to win your league(s). Either way, I think a Footballguys.com subscription is a fantastic value for $29.95. Also fantastic values: the Footballguys Draft Dominator for mobile devices, which costs $4.99.

I don’t make extra money if more people sign up for Footballguys or buy an app, but I hope my readers subscribe because I think a subscription is a really good deal. If you play fantasy football and want to win your competitive league or save hours doing research for your local league, a Footballguys subscription is well worth it. For $29.95, you get:

  • Always up to date and informed projections and rankings, along with 50,000 + pages of Footballguys Insider content.
  • The Footballguys Draft Dominator (the single most valuable tool in all of fantasy football, IMO), along with the Lineup Dominator and Projections Dominator. Even if you don’t sign up for Footballguys, you can play around with Doug Drinen’s ultra-cool Rate My Team application for free.
  • The Footballguys Insiders contest, giving you a chance at over $35,000 in prizes — this is 100% free to subscribers.
  • During the season, My FBG is a fantastic customizable tool that makes roster management incredibly easy. If you’re in multiple fantasy leagues, this is a lifesaver, and can be fully integrated with certain league management systems.
  • I won’t list every reason to sign up, but you can check out the Why Subscribe? link or just play around on the FBG homepage.
  • In addition to everything else, a money-back guarantee. In the 11 years I’ve been at Footballguys, they’ve always offered this feature, and it’s almost never used. There’s a reason for that.

Anyway, I’m not very good at the salesman thing, so I’ll wrap things up.

{ 3 comments }

Some teams, like the Rams have done a good job of fielding a very young roster; others, like the Raiders, have made a conscious effort to head in the other direction. Overall, the Rams are more representative of the current trend. NFL teams have made a shift towards younger players in the last three years, although you might be surprised by just how dramatic and sudden the change has been. The drop in Approximate Value (AV)-weighted ages of NFL rosters in the last three years is more than 50% larger than in any other three-year period in NFL history.

healy 1

Looking at the graph, there are two seismic shifts that changed the age distribution of the NFL in the Super Bowl era: the increase that started in the late ‘80s and the decrease in the last five years. These changes tell us about how changes in the collective bargaining agreement can change the NFL landscape in both subtle and dramatic ways.

First, the increase in NFL roster age in the 1980s coincides pretty closely with the introduction of Plan B free agency in 1989. It looks like the increase maybe starts a year too early. Remember, though, that the 1987 age may be skewed a bit by the three games with replacement players. Taking that point in mind, the increase from 1988 through 1993 coincides exactly with the introduction of limited free agency. [continue reading…]

{ 15 comments }

Leading Receivers Trivia

The GOAT

The GOAT.

Roger Craig, 1985.

Terrell Owens, 1999.
Terrell Owens, 2000.
Tim Brown, 2001.

Neil Paine wrote a fantastic post today at 538 about wide receivers competing with their teammates for production. That inspired me to start crunching some numbers. From 1985 to 2003, Jerry Rice played in at least 8 games in 18 different seasons. In fourteen of those seasons — including every year from age 24 through age 36, inclusive — Rice led his team in receiving yards per game. In the other four years, Rice ranked 2nd on his team in receiving yards per game, and usually not far behind the number one man. [1]In ’85, Craig averaged 63.5 YPG, while Rice averaged 57.9. In 2000, Rice led the team in receiving yards, but Owens averaged 53.9 yards per game, Rice 51.9. Owens blew Rice out of the water … Continue reading Rice finished his career with a forgettable season in Seattle, where three more players — Darrell Jackson, Koren Robinson, and Bobby Engram — out-gained a 42-year-old Rice in receiving yards per game.

What about Marvin Harrison? He led the Colts in receiving yards per game in nine of his 12 seasons in which he played in at least eight games. In 1997, Sean Dawkins edged a Harrison by 3.3 yards per game. In 2004, Reggie Wayne bested Harrison by six yards per game. And in Harrison’s final year, both Wayne and Dallas Clark outgained Harrison. [continue reading…]

References

References
1 In ’85, Craig averaged 63.5 YPG, while Rice averaged 57.9. In 2000, Rice led the team in receiving yards, but Owens averaged 53.9 yards per game, Rice 51.9. Owens blew Rice out of the water in 2000; in 2001, Brown edged him, 72.8-71.2.
{ 10 comments }

According to Football Outsiders, over the last three years, 60% of all passes have gone to wide receivers, 21% to tight ends, and 19% to running backs. There are some players who are position hybrids, of course, but as a general rule, wide receiers catch about 56.3% of passes, tight ends have a 63.1% catch rate, and running backs record a reception on 72.4% of their targets. In theory, those numbers should help us figure out which teams (and passers) have completion percentages that are artificially high (or low) because of a high number of passes to running backs (or receivers).

Let’s use the 2013 Chiefs as an example. Last year, 57% of Kansas City passes went to wide receivers, 28% to running backs, and 15% to tight ends. If we use the league-average numbers on passes to players at each position, we would “expect” Kansas City to complete about 61.9% of their passes if the Chiefs were an average passing team. That’s a number that’s slightly higher than league-average rates because the Chiefs threw very often to running backs and not so often to wide receivers. [continue reading…]

{ 12 comments }

In the Super Bowl era, there has been just one team that was both the youngest in the league and one of the five best teams in football: the 2012 Seattle Seahawks. As friend of Football Perspective Neil Paine recently pointed out, being young and great has historically been a good predictor of teams that have become dynasties. Consider the table below. It captures every team since 1966 that ranked amongst the five youngest teams by Approximate Value (AV)-weighted age and had at least 12 Pythagenpat wins, adjusting everything to a 16-game schedule. [1]My AV-weighted age calculations are very similar to Chase’s, but not always exactly the same. For example, I have Seattle third in 2013, while he has them second. We both had Seattle at 26 years, … Continue reading

TeamYearPyth WinsAV-wtd ageAge Rank
PIT197213.525.65
DAL199212.626.42
DAL199312.426.74
STL199914.226.65
CHI200112.426.55
SDG200612.626.55
IND200712.826.74
SEA201212.625.81
SEA201313.1263

There are seven unique teams on this list, not counting the two repeaters. When trying to predict what’s going to happen with the Seahawks, there are two different ways to look at this list. The first looks good for their dynasty potential. The first two teams on the list, the ’72 Steelers and the ’92 Cowboys went on to win multiple Super Bowls. The closest comparison in terms of age also looks pretty good. Teams used to be younger, so the best comparison probably isn’t the ’72 Steelers, who were even younger by age but were only the fifth-youngest team in 1972, but the ’92-’93 Cowboys. They are the only other team on this list to be so young and so good.

Of course, even the Cowboys had a pretty short run. Their stay at the top was nothing like the ’70s Steelers or ’80s Niners, who were also quite young. [2]They were the third-youngest team in 1981, their first championship year. Free agency helped to minimize their time on top. The ’90s Cowboys were the first great team in the free agency era. Players gained full freedom of movement only in the year after their first Super Bowl. Plan B free agency allowed limited movement starting in 1989.

Free agency and the salary cap help to explain the path of the other four teams on the list. They point towards a more cautious prediction about the Seahawks’ dynasty hopes. Between them, the ’99 Rams, ’01 Bears, ’06 Chargers, and ’07 Colts won one Super Bowl and played in two others. Within three years of their great-and-young season, only the Chargers were significantly better than league-average.

These more recent examples may do a better job of predicting the Seahawks future success. Before the beginning of full free agency in 1993, good-and-relatively-young teams appear to have generally followed a clear and sustained upwards trajectory over the long term. Since then, however, success has generally been less sustainable. The table below looks at teams’ strengths over time according to PFR’s Simple Rating System. [3]I thank Bryan Frye for sharing his SRS dataset. Here I’ve made the cutoff any team that was in the five youngest teams in a given year and also had a SRS rating of at least 6. The table shows the trend in strength for the previous season and the following three seasons.

TeamYearSRS (t-1)SRS (t)SRS (t+1)SRS (t+2)SRS Wins (t+3)AV-wtd ageAge Rank
PIT1972-3.6108.26.814.225.65
BAL1975-8.78.69.85-8.825.95
SFO1981-6.26.2-2.48.712.725.83
NOR1987010.11.54.6-1.3264
DAL19924.49.99.610.19.726.42
Average-2.828.965.347.045.325.943.8
TeamYearSRS (t-1)SRS (t)SRS (t+1)SRS (t+2)SRS (t+3)AV-wtd ageAge Rank
DAL19939.99.610.19.72.426.74
IND1999-5.46.17.9-3.81.225.61
STL1999-2.311.93.113.4-3.326.65
IND20006.17.9-3.81.2726.33
CHI2001-6.37.9-5.3-3.5-8.226.55
BAL2003-2.16.36.1-1.89.326.43
IND20031.2711.410.85.926.54
SDG2004-6.89.19.910.28.826.52
BAL20046.36.1-1.89.3-6.726.73
SDG20059.19.910.28.8526.85
JAX20064.87.56.8-2.5-6.526.52
SDG20069.910.28.856.626.55
SDG200710.28.856.64.826.42
IND20075.9126.55.92.926.74
SEA20120.812.21325.81
SEA201312.213263
Average3.349.095.864.952.0926.413.25

One surprising pattern in these data is just how infrequently young teams won in the past. From 1966-1992, only five teams were among the five youngest and still had an SRS of at least 6. Since 1993, it’s happened 16 times. In the past, teams had more of an opportunity to gradually build strength. So it looks like there was a greater share of young teams building for something and old teams trying to stay on top. Since 1993, the standard deviation of team ages is about 20% smaller than it was before that. In the last ten years, the standard deviation is about 30% smaller than it was before 1993. The ages of rosters are more compressed than they used to be.

The other thing to take away from these tables is the dropoff in years 2 and 3 since full free agency. For the pre-1993 teams, the good-and-young teams held much of their value. After starting at an average SRS of 8.96, they were still at 7.04 two years later and then 5.3 three years later. Since 1993, teams have deteriorated more quickly. From an average of 9.09, the more recent high quality young teams fell to 4.95 two years later and all the way to 2.09 three years later.

Since there are only five teams in the pre-1993 group, we want to be careful with interpreting too much into the earlier data. It’s possible that the ’72 Steelers and ’81 Niners are anomalies. At the same time, the success three years later is skewed downwards by the ’75 Colts, who would have been much stronger in ’78 if they had a healthy Bert Jones.

With the bigger set of more recent teams, the clear takeaway is that in the current era, even very good and young teams are just slightly better than average than three years later. The Seahawks may buck this trend, but they probably won’t. With Russell Wilson to sign and long-term cap hits for players like Richard Sherman and Earl Thomas, they’re more likely to have a brief run than a long one.

Another alternative may be available, though. If Wilson makes the leap into the Brady-Manning class (he may) and Pete Carroll turns out to be a truly elite coach (also possible), they may be able to fashion a New England-kind of dynasty. That sort of dynasty is not really built on youth. Consider the aging patterns of the last five teams of the decade.

healy age

The ‘60s Packers, ‘70s Steelers, ’80s Niners, ‘90s Cowboys all showed the same pattern of being relatively young and then progressively aging during their runs. On the other hand, the Patriots show an entirely different pattern. They’re the only dynasty to actually not age as their run progressed. They started old and stayed old through their Super Bowl years. While the Seahawks are starting off younger than those Patriots teams, excellence at QB and coach still offers them their best hope of building a dynasty in the current NFL. The benefits of being young and good are much more fleeting than they used to be.

References

References
1 My AV-weighted age calculations are very similar to Chase’s, but not always exactly the same. For example, I have Seattle third in 2013, while he has them second. We both had Seattle at 26 years, but I have Cleveland also at 26, instead of 26.1.
2 They were the third-youngest team in 1981, their first championship year.
3 I thank Bryan Frye for sharing his SRS dataset.
{ 12 comments }
Previous Posts