≡ Menu

The Pro-Rex Ryan Argument

Rex Ryan’s sixth year as head coach of the Jets will almost certainly end the way each of his last three seasons ended: with New York missing the playoffs. While that lack of success often leads to a coach getting fired after just a couple of down seasons, Ryan’s career in New York — in many more ways than what will be described below — has been a unique one. If so inclined, one could argue that no coach has done more with less than Ryan.

To make that statement, one simply needs to define “more” as “win games” and “less” to mean “having an efficient passing offense.” From 2009 to 2013, the Jets averaged just 4.60 Adjusted Net Yards per Attempt, which was 1.21 ANY/A below league average. That was the 2nd worst performance over that period, ahead (just barely) of the Cleveland Browns. [1]And from 2009 through eight weeks of the 2014 season, no team has a worse ANY/A average than New York.

The metric ANY/A correlates very strongly with winning percentage, but here’s the weird part: New York has averaged 8.4 wins per year over those five years, making the Jets a slightly above average team. For reference, the other four teams in the bottom five in ANY/A averaged just 5.6 wins per season. New York has been a crazy outlier: none of the other teams that ranked in the bottom 12 in ANY/A posted a winning record during that time span.

Take a look at the graph below. The Y-Axis shows wins per year, while the X-Axis depicts ANY/A relative to league average from 2009 to 2013. The Jets are the biggest outlier in that group, with only the Ravens coming anywhere near the Jets level of “overachievement.” [continue reading…]

References

References
1 And from 2009 through eight weeks of the 2014 season, no team has a worse ANY/A average than New York.
{ 25 comments }

Week Eight Game Scripts: The New Comeback of the Year

If you watched the Lions/Falcons game — you know, the Wembly WhyamIwatchingthisgame — you probably left with the feeling that neither team deserved a win. The game was a disaster of epic proportions at the coaching level, but the game was also notable for another reason: after trailing 14-0 at the end of the first quarter and 21-0 at halftime, the Lions came back to win, 22-21. Detroit posted a Game Script of -11.3, making it the largest comeback of the year.

The biggest blowout of the week was in Foxboro, where the Bears lost by 28 points and posted a Game Script of -21.0. In a weird twist, though, both teams had pretty similar pass/run ratios. Was this due to New England being pass-happy despite leading, Chicago being run-heavy despite trailing, or a combination of both? As it turns out, both teams veered off their expected pass/run ratios by about 10%. A team with a Game Script of +21.0 should be expected to pass on about 45% of plays, while the Patriots 56% of the time. On the flip side, the Bears would have been projected to pass 70% of the time, but wound up throwing on just 59% of all plays. Chicago ran well — Matt Forte and Ka’Deem Carey combined for 147 yards on 25 carries — while New England was passing uh, very well, with Tom Brady completing 30 of 35 passes and throwing five touchdowns.

The table below lists the Game Scripts from each game in week 8: [continue reading…]

{ 2 comments }

Let’s start with the SRS ratings for every team in the NFL. The SRS ratings are generated based off of the points scored, points allowed, home field, and opponent for each game. In its simplest form, the SRS is just an SOS-adjusted version of points differential, although the devil is in the details. After running hundreds of iterations to get the ratings to converge (and awarding 3 points to the home team), below are the ratings through week 8: [continue reading…]

{ 2 comments }

This week at the New York Times, I look at what may be the greatest class of rookie receivers in NFL history.

In fact, through eight weeks, wide receivers from the class of 2014 have caught 38 touchdown passes. That number may not mean much out of context, but consider that no other class of receivers can match that total.

The class of 2010 receivers — players in their fifth season — are next. That group has 37 receiving touchdowns, and is led by Antonio Brown (seven touchdowns), Demaryius Thomas (six), Dez Bryant (five) and Emmanuel Sanders and Brandon LaFell (four each).

Third- and fourth-year wideouts, who entered the league in 2012 and 2011, are tied for third place with 30 touchdowns for each class. The third-year receivers are a deep group: Kendall Wright has four touchdown catches, while Mohamed Sanu, Travis Benjamin, Brian Quick and Alshon Jeffery each have three scores. The 2011 class is more top-heavy, and led by Randall Cobb (nine), Andre Holmes (four), Torrey Smith (four) and Julio Jones (three).

But no class can match what is being done by the 2014 rookies, at least when it comes to receiving touchdowns. And the performance of the group is not impressive only among current players; this level of production is a historical outlier, too. Last year, rookie wide receivers caught 58 touchdowns, the most by any class of N.F.L. rookies in history (excluding the 1987 rookies who were replacement players).

The 2014 class is on a pace to exceed that mark, but it is striking how far rookies have come in such a short time. It was just 2006 when rookie wide receivers were responsible for only 26 receiving touchdowns all year. That number increased to 28 in 2007 and 31 a year later, marks that have been eclipsed by this rookie class before the calendar hit November.

You can read the full article here.

{ 0 comments }
It was criminal how good Ben was on Sunday

It was criminal how good Ben was on Sunday

Against Indianapolis in week 8, Ben Roethlisberger was close to perfect. He completed 40 of 49 passes for 522 yards. He threw six touchdowns, and didn’t throw an interception or take a sack. That’s a magnificent performance: in fact, among players with an 80% completion percentage in a game, he set a record for completions. It goes without saying that 500+ yard games are rare, and 6+ TD games are rare, and the combination of both are really rare.

But was it the best passing game ever? Not so fast. Let’s start by calculating his Adjusted Net Yards per Attempt, which gives a 20-yard bonus for touchdown passes, a 45-yard penalty for interceptions, and deducts sack yardage from the numerator (and adds sacks to the denominator). Roethlisberger averaged 13.10 ANY/A, a sparkling number. That’s an outstanding number that needs no qualifier, but it’s even more impressive when you consider the opponent. Entering the day, the Colts were allowing just 5.52 ANY/A to opposing passers.

Therefore, the Steelers star averaged 7.58 more ANY/A against the Colts than the average passer in 2014. Over the course of 49 dropbacks, this means Roethlisberger produced a whopping 372 Adjusted Net Yards above average, with average being defined as what all other passers did against Indianapolis.

That number may not mean much in the abstract. But if the Colts defense continues to allow just 5.52 ANY/A to all other passers year, that would give Roethlisberger the 7th best passing game since 1960. [continue reading…]

{ 24 comments }

In many ways, week 9 was an uneventful week of college football. Of the top 18 teams in last week’s SRS, only one lost in week 9. On the surface, the loss by Ole Miss — ranked 2nd in the SRS last week and 3rd in the polls — was a big loss. But as long as the Rebels keep winning, it wasn’t a big deal at all. Ole Miss, like Mississippi State, like Alabama, like Georgia, and like Auburn (more on them later) all control their own destiny for the playoffs. Ole Miss still has to play Auburn, Arkansas, and MSU, so it’s not as though things will be easy for the Rebels; but they do control their own destiny, just as they did a week ago.

Among top-30 SRS teams last week, only three others lost, and in two of those games it was to fellow top-30 teams. Utah (#22 in last week’s SRS) defeated Southern Cal (#19) on a touchdown pass with 8 seconds left, to give the Utes a 24-21 home win. Tennessee (#24 last week) lost at home to Alabama in the Lane Kiffin Bowl. The one real surprise was Virginia Tech (#29) losing 30-6 at home to a Miami team that was just 43rd in the SRS entering week 9.

The table below shows the SRS ratings through nine weeks. Breaking up the SEC West stranglehold at the top is TCU, and the Horned Frogs now lead the nation in scoring. It appears as though style points may not be an issue, so for TCU, the biggest hurdle may just be finishing the year 11-1. For the Horned Frogs, the toughest two games remaining are the next two: at West Virginia next week, and against Kansas State a week later. As always thanks to Dr. Peter R. Wolfe for providing the weekly game logs. Some more playoff thoughts about the jump: [continue reading…]

{ 0 comments }

Every week, I publish my college football Simple Rating System scores for each of the 128 FBS teams. But to run the calculation — using this methodology — I also have to derive ratings for each non-FBS school, too.

Below are the SRS Ratings for all non-FBS college football teams through nine weeks. [continue reading…]

{ 0 comments }

Nelson has (still) been the league's best receiver in 2014

Nelson has (still) been the league’s best receiver in 2014

On October 1st, I looked at the leaders in Adjusted Catch Yards per Team Attempt. Today, I re-ran the numbers, which are through week 7 but also include the Broncos/Chargers game from Thursday night.

The formula is simple: Begin with receiving yards; add 9 yards for each first down reception, and 11 additional yards if that first down went for a touchdown. Then, divide that number by the player’s team’s number of pass attempts (including sacks). You can read more about the methodology here.

One player worth highlighting is Dez Bryant. Chances are, you’ve heard lots about DeMarco Murray and the Cowboys offensive line; you’ve also probably read something about the efficient season Tony Romo is having, and the shockingly decent performance from the Dallas defense. But Bryant is having a remarkably efficient year, too. The Cowboys are the second most run-heavy team in the NFL; as a result, Bryant ranks 9th with 590 yards through seven games, but he’s been much more productive than that on a per-attempt basis. [continue reading…]

{ 9 comments }

Pass Identities Through Seven Weeks

I’ve published the Game Scripts data from every game this year at the 2014 Game Scripts page, available here. What would it look like if we plotted Game Script score (on the X-Axis) against Pass Ratio (on the Y-Axis) for every game this year? Something like this:

game scripts
As you move from a more negative Game Script to a more positive one, the expected Pass Ratio decreases. But the relationship is not purely linear: in extreme cases, the Pass Ratios tend to move a bit more towards league average, and I think that trend is probably even stronger than it might appear on this graph. In any event, you can derive a best-fit polynomial equation from that data, which could give us an expected Pass Ratio.

Luck's Colts have been very pass-heavy in 2014

Luck’s Colts have been very pass-heavy in 2014

For example, with a Game Script of +3.0, teams should be expected to pass on 56.3% of all plays. But in the Eagles/49ers game, Philadelphia passed on 78.6% of all plays. At the time, I thought it was an oddly pass-happy performance, as it turns out, it was the most pass-heavy game of the year, with a pass rate 22.3% higher than expectation.

If we perform that calculation for every game this year, we can derive season grades. Let’s look at the Colts line in the table below. In 7 games this year, Indianapolis has an average Game Script of +7.9, which happens to be the highest in the NFL (the table is fully sortable). Based on how each game has unfolded, Indianapolis would be expected to pass on just 52.7% of all plays if it was an average team; however, the Colts have passed on 59.4% of all plays. That means the Colts have passed 6.7% above expectation, the second highest rate in the NFL this year. The table below lists that data for each team through week 7: [continue reading…]

{ 12 comments }

Week 7 (2014) Game Scripts: Packers Lead the Way

For the second straight week, a pair of blowouts registered Game Scripts of at least +17.0 points. This time, two 2013 NFC playoff teams were on the losing side of things, as the Packers (+22.8) crushed the Panthers in the afternoon before the Broncos obliterated the 49ers (+18.0) at night. Aaron Rodgers was his absurdly hyper efficient self, completing 19 of 22 passes for 255 yards and 3 touchdowns. Peyton Manning, in addition to setting the career passing touchdowns record, threw for a first down on 14 of his 28 dropbacks. That’s pretty darn good. [1]The best rate this year was Matt Ryan against Tampa Bay, when he picked up a first down on 60% of his dropbacks.

There were only two teams to win in week 7 with a negative Game Script.  The most shocking comeback of the day came in Detroit, where the Lions overcame a 13-point deficit with five minutes remaining to win, 24-23. In Buffalo, the Bills drove 80 yards in just over three minutes and defeated the Vikings when Kyle Orton hit Sammy Watkins for a touchdown with just one second left in the game.

In the “misleading final scores” category, the Browns/Jaguars game takes first prize. The Jaguars posted a Game Script of just +1.5 in the team’s 24-6 win; the Browns actually led for most of the first half and had the ball in Jacksonville territory in the middle of the fourth quarter tailing by just four points. Alas, two late touchdowns, and it turned into a Jaguars blowout. On the other side of the coin, the Rams won by just two points, but were in control for most of the game in the upset victory over Seattle. St. Louis had a 21-3 first half lead, before Russell Wilson second-half magic nearly altered the result. For the day, Wilson became the first player to ever pass for 300 yards and rush for 100 yards in the same game.

The table below lists the Game Scripts data from each game in week 7.

[continue reading…]

References

References
1 The best rate this year was Matt Ryan against Tampa Bay, when he picked up a first down on 60% of his dropbacks.
{ 8 comments }

Passing Kings, From Friedman to Manning

Friend-of-the-program Bryan Frye has contributed a fantastic guest post for us today. Bryan lives in Yorktown, Virginia, and operates his own great site at http://www.thegridfe.com/, where he focuses on NFL stats and history. Be sure to check out Bryan’s site, and let him know your thoughts on today’s posts in the comments.


Last Sunday, Peyton Manning broke the record for career touchdown passes. You may have heard about it. Rather than add more flotsam and jetsam to the vast sea of internet articles dedicated to Manning, I thought I would instead focus on the rich history of the record itself.

[continue reading…]

{ 27 comments }

This week at the New York Times, I look at some of Seattle’s struggles to win as defending champs.

Staying on top of the football mountain is often more difficult than getting there. That is a lesson the defending champion Seattle Seahawks have been painfully experiencing this season. The Seahawks often face each opponent’s best effort, and that reality was clear against the St. Louis Rams on Sunday.

The Rams pulled off a 28-26 victory powered by a pair of special teams trick plays; these are the sort of plays that teams hold back for years before unveiling them at a key time against a significant rival, and Seattle played the guinea pig in Week 7.

In the first half, St. Louis called an unusual punt return fake, in which the team sent both Tavon Austin and Stedman Bailey as potential returners. The punt went in the direction of Bailey, but Rams blockers crossed the field to set up for a return by Austin as if that was where the ball was heading. The Seahawks, following the blockers and not the ball, wound up out of position. The end result was an easy touchdown on a play St. Louis will not be able to use again for years.

As I’m wont to do, I end with a look at some quirky stats from the season to date. Including, of course, a depressing Jets stat. You can read the full article here.

{ 0 comments }

In early September, Adam Steele, a longtime reader and commenter known by the username “Red” introduced us to his concept of Marginal Yards after the Catch. Today is Part II to that post. Adam lives in Superior, Colorado and enjoys digging beneath quarterback narratives to discover the truth; hey, who can blame him?


Introducing Marginal Air Yards

There are three components of Y/A: Completion %, Air Yards/Completion, and YAC/Completion. In my last post I looked at YAC, so today, let’s look at the other two components. By multiplying completion percentage and air yards per completion, we get air yards per attempt, which we can then modify to create Marginal Air Yards (mAir):

mAir = (Air Yards/Attempt – LgAvg Air Yards/Attempt)*Attempts

Here are the yearly Air Yard rates since 1992, with the table sorted by Air Yards per Attempt:: [continue reading…]

{ 15 comments }

Last week, three Big 12 teams occupied the 4-5-6 spots in the rankings, making the Big 12 look like an obvious contender to take one of the four spots in college football’s first ever playoff. Then week 7 happened.

Yesterday, West Virginia won at home against Baylor, 41-27, while Oklahoma lost in Manhattan to Kansas State, 31-30. [1]The Sooners not only missed an extra point, but a 19-yard field goal in the game’s final minutes. TCU blew out Oklahoma State, 42-9, which only increases the pain associated with how the Horned Frogs blew the Baylor game a week ago. When SEC teams beat up each other, it shows the strength of the conference. When every other conference beats up each other, it shows how the conference isn’t as good as we thought. That’s an extreme version of the narrative, but that does seem to be the thought process for many in the media. After week 7, the Big 12’s big three is now a big four with Kansas State [2]Why not West Virginia? Sure, the Mountaineers are 5-2 with only losses to Alabama and Oklahoma, but the SRS so far thinks WVA belongs in a lower tier than the top teams in the conference. joining the mix. All four are in the top 12, but none are in the top 4. More importantly, TCU, the top Big 12 team, ends the season with Kansas, Texas, and Iowa State. It’s going to be tough for TCU to gain a lot of momentum in December with that finish to the schedule, and will TCU look that much different than say, the winner of the Oklahoma/Baylor game? Kansas State could wind up undefeated in the conference, but what will that say about the Big 12 relative to the SEC if KSU’s only loss was to Auburn?

It’s definitely too early to really think through possible scenarios, but that doesn’t make it any less fun. Below are the week 8 ratings. As always thanks to Dr. Peter R. Wolfe for providing the weekly game logs. Some more playoff thoughts about the jump: [continue reading…]

References

References
1 The Sooners not only missed an extra point, but a 19-yard field goal in the game’s final minutes.
2 Why not West Virginia? Sure, the Mountaineers are 5-2 with only losses to Alabama and Oklahoma, but the SRS so far thinks WVA belongs in a lower tier than the top teams in the conference.
{ 3 comments }

Seattle trades Percy Harvin to the Jets

When John Schneider sent a 1st round draft pick [1]And a little more. As it turned out, the Vikings drafted Xavier Rhodes, Jerick McKinnon, and Travis Bond with those picks. That looks even better today than it did a year and a half ago. to Minnesota for the right to pay Percy Harvin $67M over six years, it looked like a risky move that might pay off if a whole bunch of “ifs” came true. Today? After paying Harvin more than eighteen (18!) million dollars and getting little in return, the Seahawks are sending him to the Jets for a conditional pick (rumored to be a 2nd, 3rd, or 4th, depending on what exactly those conditions are). The 2012 transaction now looks like one of the worst trades in recent NFL history. What was Seattle thinking?

Let’s travel back in time to October 31, 2012. Would you be shocked to learn that Percy Harvin may have been the best wide receiver in football? To measure this, I looked at how all receivers had performed over the trailing 365 days. The table below shows the production for each receiver from week 9 of the 2011 season through week 8 of the 2012 season. I’ve also calculated each wideout’s fantasy points, with 0.5 points given for each reception, 0.1 points for each yard from scrimmage, and 6 points for each offensive touchdown. Since, due to bye weeks, some receivers could have played between 15 and 17 games, the table includes the 20 wide receivers with the most fantasy points but is sorted by FP/G: [continue reading…]

References

References
1 And a little more. As it turned out, the Vikings drafted Xavier Rhodes, Jerick McKinnon, and Travis Bond with those picks. That looks even better today than it did a year and a half ago.
{ 9 comments }

In Between Pete Metzelaars and Scott Chandler

Chandler tries out for the role of Ivan Drago

Chandler tries out for the role of Ivan Drago

The early 1990s were a simpler time. That’s doubly true when it comes to passing statistics, and triply true for tight ends. In week 2, the Bills and 49ers played a famous game in which neither team punted. In week 4 of the 2014 season, the Bears and Packers played just the second game in NFL history with no punts. A streak of 22 years and 2 weeks is pretty long, but that’s not even the longest streak to come out of that Buffalo/San Francisco game.

The Bills defeated the 49ers in no small part thanks to Pete Metzelaars, who caught four passes for 113 yards and 2 touchdowns. And until last Sunday, that was the last time a Buffalo Bills tight end gained 100 yards in a game. In 1993, Metzelaars had a 98-yard game; Lonnie Johnson had an 86-yard game two years later, and gained 90 yards in a 1996 game. Jay Riemersma had three 80+ yard games for the Bills, but that was about it. For over 22 years, no Buffalo Bills tight end hit the hundred yard mark until Scott Chandler caught 6 passes for 105 yards against New England.

In between Metzelaars and Chandler, there were 289 games where a tight end gained at least 100 receiving yards in a game. Unsurprisingly, the Patriots lead the way with 29 of those games, with Rob Gronkowski and Ben Coates responsible for 22 such performances. The table below shows — for each franchise — the number of tight ends who gained 100 receiving yards between week 3 of the ’92 season and week 5 of this year.  I have also included (in parentheses) the number of 100-yard games recorded by each tight end for that franchise: [continue reading…]

{ 9 comments }

Week 6 (2014) Game Scripts: Bucs Blown out Again

It was only back in week 3 when the Falcons posted a Game Script of 32.5 against the Bucs. In week 6, the Ravens nearly duplicated that effort in Tampa Bay!

Joe Flacco threw two touchdowns to Torrey Smith in the first 6 minutes of the game. He would hit Kamar Aiken and Michael Campanaro before the quarter was over, becoming just the second quarterback in NFL history with four first-quarter touchdown passes. The other? Tommy Kramer in 1986 against the Packers.

Baltimore’s Game Script produced the 2nd best Game Script of the year; meanwhile the Eagles’ 27-0 shutout against the Giants came with a Game Script of +17.1, the 7th highest mark this season.

The table below lists the Game Scripts data from each game in week 6. As is customary around these parts, I’ve highlighted the Bengals/Panthers game in blue as a result of their tie (you can move your cursor over that row to see it more clearly, not that I know why you would want to). [continue reading…]

{ 3 comments }

Just above these words, it says “posted by Chase.” And it was literally posted by Chase, but the words below the line belong to Bryan Frye, a longtime reader and commenter who has agreed to write this guest post for us. And I thank him for it. Bryan lives in Yorktown, Virginia, and operates his own great site at http://www.thegridfe.com/, where he focuses on NFL stats and history.


With six weeks behind us, we should be at the point where we can figure out who teams are. [1]For a counter view, see this post by Chase. However, this season seems to be a parity lover’s dream. Although many teams near the poles are who we thought they were, others (such as New Orleans and Dallas and perhaps San Diego) are far from their preseason projections. The middle ranks are a jumble of average and indiscernible teams, and no team was even able to make it to 4-0. [2]Think that’s crazy? In 1961, the Cowboys, Lions, and Eagles were the last undefeated teams in the NFL, at 2-0. With half of the NFL’s teams lingering around 1-2 losses, how can we tell the petty tyrants from those with legitimate claims to the throne? I recently began working on a model to do just that.

[continue reading…]

References

References
1 For a counter view, see this post by Chase.
2 Think that’s crazy? In 1961, the Cowboys, Lions, and Eagles were the last undefeated teams in the NFL, at 2-0.
{ 13 comments }

New York Times, Post Week-6 (2014): Big D in Detroit

This week at the New York Times, I looked at the dominant Detroit defense.

It is a new football era in Detroit. For five years, the Lions were known as a talented but undisciplined squad that failed to reach its potential under Jim Schwartz. The defense, in particular, was high on names but low on production. And while the offense had its moments, it was asked to do too much: In five years Detroit won only two games when it failed to score 20 points, the second fewest in the N.F.L. over that span behind San Diego.

But this year the new-look Lions have already won a pair of low-scoring affairs against division rivals. In Week 3, Detroit held the Packers to 7 points, the fewest in any game that Green Bay quarterback Aaron Rodgers started and finished. The Lions also held Green Bay to 223 yards, the fewest in any game with Rodgers since 2008. On Sunday, Detroit’s defense was outstanding: It recorded eight sacks and three interceptions against Minnesota Vikings quarterback Teddy Bridgewater and forced five three-and-outs with a sixth drive ending in a four-and-out.

You can read the full article here.

{ 2 comments }
Mike Smith, thinking about kicking or punting.

Mike Smith, thinking about kicking or punting.

With just under five minutes left in last Sunday’s game against the Giants and his team trailing 27-20, Mike Smith went for it on 4th and 1 from his own 29 yard line. As was the case on repeated 4th down attempts the last time his team visited MetLife Stadium to face the Giants, the decision to be aggressive did not work out well. Matt Ryan was sacked for a nine-yard loss that effectively ended the game. If his previous behavior is any guide, Smith may learn the wrong lesson from that outcome and choose not to go for it again when the next similar opportunity arises. Smith illustrates better than any other coach the potential for fourth down failure to lead to future fourth down timidity.

Before those two failed Ryan fourth down sneaks against the Giants in that 2011 playoff game, Smith actually was one of the more enlightened coaches on fourth down strategy. From 2008-2011, Smith was the third-most aggressive coach of the last twenty years, at least according to Football Outsiders’ Aggressiveness Index. Dating Smith’s turning point is a little tough. He got burned going for it in Week 10 of the 2011 regular season, when he tried a sneak on 4th and inches from his own 29 in overtime against the Saints. He punted in a couple of situations where he usually went for it late in the 2011 season, but then was aggressive closer in against the Giants. By the 2012 regular season, Smith hadn’t just abandoned his prior tendency for aggressive strategy. He entirely reversed it. In 2012, he was the least aggressive coach in football, only going for it once in 91 qualifying fourth-down tries. He was similarly passive in 2013. His fourth down decision last Sunday was surprising given that trend.

To see Smith’s evolution on fourth down strategy, consider his decisions on 4th and 3 or less when between the opponent’s 10- and 40-yard lines. To consider only situations where there was a real choice while keeping things as simple as possible, I look only at first-half decisions along with third-quarter decisions where the margin was ten points or less. [continue reading…]

{ 8 comments }

Appearance on Three-Cone Drill Podcast

I went on the Three Cone Drill Podcast with Rivers McCown and Danny Tuccitto to talk when, football and stats. You can listen to it below.

For you twitter folks, you can follow the Three-Cone Drill Podcast here, Rivers here, and Danny here. And be sure to check the Three-Cone Drill website, which updates regularly with podcasts (iTunes page is here) and posts. Thanks again to Rivers and Danny for having me on.

{ 0 comments }

Eli Manning and the Hall of Fame

Let’s worry about axes and labels later. For now, take a look at the graph below. The red dots represent Hall of Fame quarterbacks (or players not yet eligible but very likely to wind up in Canton). The blue dots represent non-HOF quarterbacks. The black dot? That’s Eli Manning.

hof

Okay, so what the heck is this chart? What it’s *not*, is the most sophisticated way to measure the value of a quarterback. Instead, it’s a quick-and-dirty method I calculated to measure quarterback dominance.

  • Step 1) Calculate each quarterback’s ANY/A for each season of his career where he had enough pass attempts to qualify for the passing title (14 attempts per team game). ANY/A, of course, is calculated as follows: (Passing Yards + PassTDs * 20 – INTs * 45 – Sack Yards Lost) / (Pass Attempts + Sacks).
  • Step 2) For each quarterback, award him 10 points if he led the league [1]For purposes of this post, I have excluded AAFC stats, but combined the AFL and NFL as one league. in ANY/A, 9 points if he finished 2nd, 8 points if he finished 3rd, … and 1 point if he finished 10th. A quarterback receives 0 points if he does not finish in the top 10 in ANY/A or does not have enough pass attempts to qualify.
  • Step 3) For each quarterback, add his “points” from each season to produce a career grade.

[continue reading…]

References

References
1 For purposes of this post, I have excluded AAFC stats, but combined the AFL and NFL as one league.
{ 43 comments }

The Bulldogs pushed aside the Tigers in week 7; just not in the SRS

MSU pushed aside Auburn in week 7; (but not in the SRS).

In last week’s rankings, Auburn stood head and shoulders above the rest of college football. As a result, even a 15-point loss on the road against Mississippi State wasn’t enough to nudge the Tigers from the top spot. Is this a problem? Not really. The SRS ratings are predictive; they are not designed to tell you which teams are the most deserving or which schools have accomplished the most. Instead, they are intended to give you an idea of what might happen in a future game between any two teams.

Auburn’s rating is amplified by a 41-7 victory against LSU, which stands out as the most dominant performance of the year. The Tigers also crushed Arkansas by 24, a margin that looks more impressive every week. Other than yesterday’s loss, Auburn’s “worst” performance of the year by SRS standards was a 6-point win on the road against Kansas State (#14 in the SRS), which would be the best game of the year for all but a handful of teams.

The Mississippi schools check in at #2 and #3 in the SRS this week; Alabama and Texas A&M are #8 and #9, giving the SEC West five teams in the top ten yet again. Auburn, with the double-edged sword of a brutal schedule, will have no problem getting back into the playoff discussion if the Tigers can win out. Georgia, fresh off a 34-0 thumping of Missouri, is now 7th in the SRS. But I want to focus on schools 4, 5, and 6 in the ratings. All are from the Big 12, a conference doesn’t appear to be getting much respect nationally.

The ten-team conference plays a round robin schedule, meaning each team gets nine division games. That leaves only 3 nonconference games for each school, and the class of the conference — Baylor, Oklahoma, and TCU — are already done with that part of their schedule. It makes sense to analyze these teams as a group, because for SRS purposes (and based on the two head-to-head games), these three teams are all about equal. In their nine nonconference games, they went 9-0 with an average margin of victory of 41 points, and all wins came by at least 23. Of course, that schedule was loaded with cupcakes: other than Tennessee (currently 12th in the SRS), the only semi-respectable opponents were Minnesota (#38) and Louisiana Tech (#50). And the Vols game is certainly helping: Tennessee is 3-3, but the losses were by 1 point to Florida, 4 to Georgia, and 24 to Oklahoma. [continue reading…]

{ 1 comment }

Thoughts on SEC West schedules

The SEC West is the best division in all of college football. The division is 31-6 this year, with all six losses coming at the hands of other SEC West teams. There have been only three inter-divisional games in the SEC this year, and the West teams came away with three blowout victories: Alabama over Florida (42-21), Texas A&M over South Carolina (52-28), and Ole Miss over Vanderbilt (41-3). In Power 5 play, Arkansas, Alabama, and Auburn have notched wins over Texas Tech, West Virginia, and Kansas State, while LSU knocked off Wisconsin. And Ole Miss defeated Boise State and Memphis, too.

Auburn, Mississippi, MSU, Alabama, and A&M all are in the top 10 of the SRS, and LSU and Arkansas are in the top 20. So what happens if these teams beat up on each other? Each school plays each of the other six SEC West teams. While there’s a good chance at least one of these schools goes 5-1 or 6-0 in division play, there’s also a chance we end up with a multi-team tie atop the division at 4-2. The actual tiebreakers are the typical boring type that you can imagine, but we need not restrict ourselves to the creativity capacity of executives of the Southeastern Conference. So today, I’m ranking schedules. Since this is not the tiebreaker that the SEC would actually use, you can think of this as how-to guide to rooting for people who have morals: [continue reading…]

{ 1 comment }

Antone Smith and Long Touchdowns

Allow me to present to you Atlanta running back Antone Smith’s 2014 play-by-play log in its entirety:

Week 1 vs. NO
QtrTimeScoreDown/DistYardlineDescription
211:400 - 132nd-and-10own 20rushed for 2 yards
209:160 - 131st-and-10opp 31rushed for 5 yards
300:3317 - 202nd-and-9own 46caught pass for 54 yards TOUCHDOWN
Week 2 vs. CIN
QtrTimeScoreDown/DistYardlineDescription
214:49417011st-and-10own 28caught pass for 4 yards
201:14417083rd-and-4own 38target of incomplete pass
410:23417221st-and-10opp 35caught pass for 15 yards (first down)
400:54419361st-and-10own 41target of incomplete pass
Week 3 vs. TB
QtrTimeScoreDown/DistYardlineDescription
104:21367081st-and-9opp 9rushed for 4 yards
209:0028 - 01st-and-10opp 11rushed for 10 yards (first down)
302:3649 - 01st-and-10opp 36rushed for -2 yards
301:5949 - 02nd-and-12opp 38rushed for 38 yards TOUCHDOWN
Week 4 vs. MIN
QtrTimeScoreDown/DistYardlineDescription
105:230 - 73rd-and-2opp 29rushed for 2 yards (first down)
104:470 - 71st-and-10opp 27rushed for 3 yards
214:55418342nd-and-10own 31rushed for 9 yards
301:4021 - 271st-and-10opp 48rushed for 48 yards TOUCHDOWN
Week 5 vs. NYG
QtrTimeScoreDown/DistYardlineDescription
103:420 - 71st-and-10opp 23rushed for 2 yards
214:59418273rd-and-4opp 4caught pass for 1 yards
212:33419191st-and-10own 25caught pass for 8 yards
305:5113 - 103rd-and-4own 26caught pass for 74 yards TOUCHDOWN

That’s four long touchdowns on 17 offensive touches.  On his four scoring plays, Smith has gained an incredible 214 yards.  That’s the most in the NFL so far, with Steve Smith (162 yards) and Jordy Nelson (160) rounding out the top three.  Perhaps even more incredible is that Smith has gained 214 yards on scoring plays despite gaining only 63 yards on non-scoring plays.  Here’s a chart I tweeted a couple of days ago, showing yards gained on TDs on the X-axis and yards gained on all other plays on the Y-axis: [continue reading…]

{ 5 comments }

There's been a long drought in Cleveland

There’s been a long drought in Cleveland

October 27, 1991. The 4-3 Browns were hosting the 3-4 Steelers, and Vegas oddsmakers set the Browns as 1.5-point favorites. Bernie Kosar would complete 21 of 29 passes for 179 yards and a score, while Kevin Mack would lead the team with 54 yards rushing on 19 carries. It was not a great offensive day for the Browns, but the team managed to pick off Neil O’Donnell two times, and held Merrill Hoge to just 48 yards on 12 carries (the factor back chipped in with 56 receiving yards, too). Clay Matthews — the middle one — had one sack, Louis Lipps led all players with 69 receiving yards, and the only thing that would trick you into thinking that this game didn’t take place generations ago was that Matt Stover started the scoring with a 34-yard field goal. [continue reading…]

{ 8 comments }

Brian Football

Brian Football.

Last week in this space, we bemoaned the large number of blowouts and the lack of exciting comebacks. Apparently, bemoaning works.

After falling behind against Atlanta by a score of 20-10, the Giants scored the final 20 points of the game to steal the win. The Saints jumped out to a 13-0 lead against Tampa Bay, but the Bucs responded by going on a 31-7 run. With the season teetering on the edge, New Orleans responded by scoring 17 straight points to pull off the rare come from ahead comeback.

In Detroit, the Lions jumped out to a 14-0 lead. But the Bills scored 17 straight, and won with a Game Script of -6.4. In Carolina, the Bears took an early 21-7 lead, but the Panthers scored 24 of the game’s final 27 points, winning with a -3.8 Game Script. But by far the biggest comeback of the day came in Tennessee, when the 2014 edition of the Kardiac Kids pulled off the largest road comeback in NFL history.

With 2:55 left in the first half, the Titans led the Browns, 28-3. But from that point forward, Brian Hoyer completed 16 of 27 passes for 259 yards and 3 touchdowns, while Ben Tate, Isaiah Crowell, and Terrance West rushed 24 times for 107 yards. By the end of the day, Cleveland had won 29-28 despite a Game Script of -10.5. That checks in as the worst Game Script by a winning team since the Colts won with a -11.0 against the Texans in week 9 of last season.

The table below shows all the Game Scripts data from week 5:

[continue reading…]

{ 8 comments }

New York Times, Post Week-5 (2014): From 0-2 to 3-2

This week at the New York Times, I look at a pair of teams that have gone from 0-2 to 3-2, a statistical rarity, and a league-wide passing trend:

About three weeks ago, you probably heard some variation on the following statistic: Since 1990, only 12 percent of teams that started 0-2 ended up making the playoffs. Seven teams started 0-2 this season, but two of those have rebounded with three-game winning streaks.

Andrew Luck leads the N.F.L. in passing yards and touchdowns while posting a 100 passer rating. His Colts lead the league in points scored, and Indianapolis has the second-best point differential in the N.F.L., behind the San Diego Chargers. The Colts, division champions in 2013, are back on top of the A.F.C. South, tied with the Houston Texans for the division’s best record. As a result, it is probably hard to even remember that only three weeks ago, the Colts were one of those struggling 0-2 teams.

The A.F.C. South was the worst division in football last year, and not much has changed in 2014. In interdivision games, A.F.C. South teams are 5-11, the worst record of any division. That is one of the biggest reasons the Colts were able to jump from last to first place so quickly. Indianapolis has feasted on its poor division.

You can read the full article here.

{ 0 comments }

Andrew Healy joining Football Outsiders

Congrats to Andrew Healy, who is now working with Football Outsiders. His first post went up today.

Since 1979, teams have covered the point spread by more than 17 points almost exactly 10 percent of the time. Going back to 2003, the New England Patriots have now done it half the time (5 out of 10) after losing the previous game by more than 14 points. We want to be cautious with this kind of split given the small sample size, but this is pretty remarkable given how rarely teams exceed expectations by so much….

To put how unusual this is into context, take an average team that beats the spread by 17-plus points exactly 10 percent of the time. What is the chance that team would beat the spread by 17-plus points five (or more) times out of ten? 0.2 percent! So this is a case where a small sample size really does tell us something. Over the last decade, the Patriots have been completely on their own island in their propensity for following big losses with surprisingly strong wins. And it looks like more than randomness. Note that I am counting 2008, too. If we only include the Brady era, following big losses the Patriots have beaten the point spread by more than 17 points four out of seven times.

You can read the full article here. And you can view all of Andrew’s posts at Football Perspective here or here.

And again, congrats Andrew! I’m sure he would appreciate some love from you guys in the comments, either here or over at FO.

{ 10 comments }

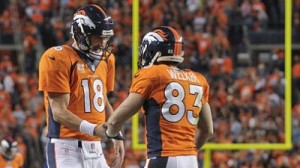
500 touchdown passes

No one is more prolific at touchdowns than Manning

No one is more prolific at touchdowns than Manning.

Yesterday, Peyton Manning threw four touchdown passes against Arizona. In the process, he joined Brett Favre as the only players in NFL history to throw 500 career touchdown passes. In previewing that game, Mike Tanier noted that it would require us to travel back to 1987 to collect 500 Cardinals touchdown throws.

Naturally, that made me wonder how far back we would have to go to calculate the last 500 touchdown passes for each franchise. The four most recent expansion franchises — Houston, Jacksonville, Carolina, and Baltimore — have yet to throw even 400 touchdown passes. For Manning, of course, he’s thrown 500 passes beginning in the 1998 season. That’s better than any franchise in the NFL; the closest team would be the Packers. To count 500 Green Bay touchdown throws, you would need to start on November 23, 1997. Beginning on that date, Favre would throw another 269 touchdowns for the Packers, Aaron Rodgers would chip in with 200, and a handful of other Green Bay players would combine for 31 scoring throws. [continue reading…]

{ 38 comments }
Previous Posts