≡ Menu
Brady likes the second half of the season

Brady likes the second half of the season

When we think about the most dominant teams of all time, the New England Patriots of the last few years don’t leap immediately to mind. Yet, their performance late in the year has been mind-bogglingly good. From 2010-13, New England went 29-3 in the final eight games of each season, a record that no other team since 1960 can match over any four-year period. Including their three games this year, the Patriots are on a 32-3 run in regular-season games in the second half of the season. From 2010-2013, the Patriots also have the biggest four-year point differential in second-half games in the history of football.

Part of that huge point differential comes from the higher point totals that teams have than they did in the past, and from New England’s offensive-centric philosophy. As a result, when we look at Pythagenpat records, the Patriots are not as dominant. [1]I used 0.251 as the value in the Pythagenpat formula to find exponents for each team-year. Here are the hundred best late-season teams over any four-year period, according to Pythagenpat record. The Patriots from 2010-13 rank only 38th on the list, behind four other recent Patriots’ runs, some of those overlapping with 2010-13. The Patriots have been great and it is an unlikely outcome that they’d have no Super Bowls in the decade so far, but they also have not been quite as strong in terms of their true strength as their second-half records would suggest. As a high-scoring team, we would have expected them to lose more of their regular season games than they have. [continue reading…]

References

References
1 I used 0.251 as the value in the Pythagenpat formula to find exponents for each team-year.
{ 3 comments }

The AFC North is 10-1-1 Against the NFC South

The NFC South has been miserable this season: the Falcons, Saints, Panthers, and Bucs are now 6-23-1 (0.217) in games outside of the division. If Atlanta, New Orleans, Carolina, and Tampa Bay combine to go 3-7 in their ten remaining non-division games, they would eclipse the 2008 NFC West and become the worst division in modern history (at least, by record).

The NFC South has been particularly bad against the AFC North, going 1-10-1 this year. The two non-losses were the shocking upset by Tampa Bay in Pittsburgh in week 4, and the tie between the Bengals and Panthers in week 6 (which ended, you may recall, with Cincinnati kicker Mike Nugent missing a 36-yarder as time expired).

The remaining games between these two divisions in 2014 are: Cincinnati at Tampa Bay, Cleveland at Carolina, Pittsburgh vs. New Orleans, and Pittsburgh at Atlanta.  If the AFC North can go 3-1, that would up its record to 13-2-1, which would set the post-2002 mark for the best record by one division against another in a single season.

The current record? A mark of 13-3, set five times in the current era.  It was most recently done by the NFC West last year, when the only losses it had against the AFC South came versus the Colts (in the case of the 49ers and Seahawks) or the Titans (Rams).

What if the AFC North went on a clean sweep the rest of the way, finishing 14-1-1? That would be the best mark since the merger, but not the best mark of all time.  That honor belongs to the 1965 NFL West: that year, the division went 13-1 against the NFL East.  That’s going to be a tough mark to ever eclipse, as it would require a 15-1 mark given the current format. How about the best mark of the post-merger era by one division against another?

The honor belongs to the AFC West, which went 31-9 outside of its division in 1984. The division really beat up on the NFC Central, going a collective 15-2 in such games. Not surprisingly, the two losses were against the Bears (by Denver and Los Angeles).

Measuring success by one division against another across eras is complicated due to differing number of games. One tweak we can make is to use True Winning Percentage, which adds 11 games of 0.500 ball to any record. If your record is 1-0, True Winning Percentage will strongly regress that 1.000 winning percentage to the mean; if your record is 90-10, not so much: we add 5.5 wins and 5.5 loss regardless of your record. Using that methodology here would translate the AFC North’s record against the NFC South in 2014 from 10-1-1 to 15-6-2 (or 16-7), equivalent to a 0.696 winning percentage. That would be the 5th best in NFL history, and the 3rd best since the merger:

RankYearDivDivRecordWin%True Win%
11965NFL WestNFL East13-10.9290.74
21984AFC WestNFC Central15-20.8820.732
31991NFC EastAFC Central14-20.8750.722
41936NFL WestNFL East18-40.8180.712
51935NFL WestNFL East16-40.80.694
61993AFC WestAFC East9-10.90.69
72013NFC WestAFC South13-30.8130.685
72010NFC SouthNFC West13-30.8130.685
72008NFC SouthNFC North13-30.8130.685
72007AFC SouthNFC South13-30.8130.685
72004AFC EastNFC West13-30.8130.685
71989NFC WestAFC East13-30.8130.685
71980AFC CentralNFC Central13-30.8130.685
71979AFC WestNFC West13-30.8130.685
151934NFL WestNFL East15-40.7890.683
161946AAFC WestAAFC East22-7-30.7340.674
171983NFC WestNFC Central10-20.8330.674
171976NFC EastNFC West10-20.8330.674
171975AFC CentralAFC West10-20.8330.674
171949AAFC WestAAFC9-1-20.8330.674
211950NFL AmericanNFL National11-30.7860.66
221969AFL WestAFL East20-7-30.7170.659
231999AFC EastAFC Central7-10.8750.658
231975NFC EastNFC West7-10.8750.658
251970NFC EastAFC Central5-010.656
261960NFL EastNFL West9-2-10.7920.652
272009AFC SouthNFC West12-40.750.648
272008NFC EastNFC West12-40.750.648
272008AFC EastAFC West12-40.750.648
272007NFC NorthAFC West12-40.750.648
272007AFC SouthAFC West12-40.750.648
272006AFC EastNFC North12-40.750.648
272005AFC NorthNFC North12-40.750.648
272004AFC NorthNFC East12-40.750.648
271988AFC CentralNFC East12-40.750.648
271969NFL CapitalNFL Century12-40.750.648
371968AFL WestAFL East21-90.70.646
381999NFC CentralNFC West8-20.80.643
381994AFC EastAFC West8-20.80.643
381991AFC WestAFC East8-20.80.643
381990NFC EastNFC Central8-20.80.643
381989AFC WestAFC East8-20.80.643
381987AFC CentralAFC West8-20.80.643
381979NFC EastNFC Central8-20.80.643
381978AFC EastAFC West8-20.80.643

The 1991 NFC East was what TV executives apparently think that division will always be. That year, teams from the NFC East went 14-2 against the NFC Central, with both losses coming by three points (Giants at Bengals), with one going to overtime (Dallas at Houston).

A 3-1 finish would give the AFC North a 13-2-1 record, good enough for a 0.704 true winning percentage.  One more loss would knock it behind the five 13-3 teams of the post-2002 era, but so far this year, the AFC North has been dominating the NFC South at a historic level.

{ 0 comments }

The Travis Kelce Post

Last year, Jeff Cumberland finished #2 in DVOA among all tight ends.  This really happened.  Of course, that required some digging, so I wrote the following about Cumberland in the 2014 Football Outsiders Almanac:

What’s going on here? How did Cumberland produce such strong numbers, and wind up second in DVOA among tight ends? Among the 52 tight ends with at least 20 targets, Cumberland ranked fifth in yards gained through the air (per reception) and seventh in yards gained after the catch (per reception). Incredibly, [Ladarius] Green ranked first in both of those metrics, but there’s generally an inverse relationship between those two statistics: you either catch passes downfield, or you gain a lot of yards after the catch, but rarely both. In fact, Green and Cumberland were the only two tight ends to rank in the top 15 in both categories, which underscores just how impressive Cumberland’s efficiency numbers were in 2013.

So is Cumberland coming off a sneaky strong season and about to break out? There’s no denying that his efficiency numbers were great, but sometimes, the best course of action is to take a step back and look at the bigger picture. In 2012, Cumberland finished second on the team with 53 targets. In the offseason, New York allowed Dustin Keller to head to Miami, but instead of handing the job to Cumberland, signed Kellen Winslow. As a result, Cumberland wound up seeing only 40 targets in 2013. If the Jets were as high on Cumberland as his numbers would suggest, he would have managed to pick up more than 2.5 targets per game in one of the league’s most anemic passing attacks. Then, New York drafted Jace Amaro in the second round of the 2014 draft. Efficiency numbers are fun to look at, but the revealed preference of the Jets organization would seem to trump those metrics. And it appears as though the organization views Cumberland as a role player and little more.

Cumberland split time with Winslow, and his low target numbers were a strong indicator that he was an average talent. [1]In his defense, Cumberland was tied for 11th in yards per route run, but that’s (1) still a far cry from #2 and (2) more a reflection of the weakness of the 2013 Jets supporting cast. Yards per target is not a good stat because it is not very sticky; yards per route run is quite a bit better.  After all, a route run is more the analog of a “pass attempt” than a target, so YPRR is really the receiver’s version of yards per attempt.

The next great tight end?

The next great tight end?

This year, as he did in 2013, and 2012, and nearly in 2011, Rob Gronkowski leads all tight ends in yards per route run. He is averaging 2.67 yards per route run on his 304 routes, and the only receivers with a higher yards per route run average on over 225 routes are Demaryius Thomas (2.77) and Jordy Nelson (2.84). In short, Gronkowski is the man.

But, assuming you read the title to this post, you know that today we want to focus not on Gronk, but on baby Gronk. Kansas City’s Travis Kelce is second among tight ends in yards per route run, with a 2.49 average over 218 snaps. Those are incredible numbers, and a reflection that Kelce is already one of the top playmaking tight ends in football.

The Chiefs star hase has 542 yards on 52 targets, and his 10.4 yards/target average is the best among all tight ends.  But remember, Y/T is not a good stat: Cumberland ranked 3rd last season in yards per target, with a 10.2 average. Cumberland’s issue was that he wasn’t targeted very much despite being on the field.  As a result, his yards/target average overstated his value. Let’s throw some math into this equation: in 2013, Gronkowski was targeted on 30% of his routes, the best rate among all tight ends; Cumberland was targeted on 16% of his routes, the 35th best rate among tight ends.

Kelce isn’t the best receiving tight end in football because he leads with a 10.4 yards/target average.  It’s not just about what you do per target, it’s how often you get targeted. As he did last year, Gronk leads all tight ends in targets per route run, as he has been targeted on 28% of his pass routes.  But Kelce ranks 4th — and just a hair behind Jimmy Graham for 3rd place [2]Jordan Reed is second. — in targets per route run! He’s not having a fluky season at all, or at least, not in the way Cumberland did. The Chiefs are throwing to Kelce very often when he’s running routes, which is a very good sign that he’s the real deal.

So why is Kelce “only” 6th in receiving yards among tight ends? Because he’s just 28th in pass routes run by tight ends this year. And that’s the real conundrum: he simply isn’t getting much playing time. For the 2013 Jets, Cumberland was on the field for more offensive plays than any Jets player other than the quarterback and offensive linemen. Kelce simply doesn’t get the same level of playing time, as he ranks 4th among non-OL/QBs for Chiefs offensive players in snaps.

The other problem for him is that Kansas City ranks just 31st in pass attempts this year, which is going to depress his raw totals. But the good news is his playing time is on the rise — he was on the field for 63 of 67 snaps in week 12 and 50/52 in week 11. He can’t do anything about how often the Chiefs pass, but in his case — unlike Cumberland’s — the organization seems to be buying into the numbers. Kelce’s been dominant on a per-route basis this year, and now, Kansas City keeps giving him more playing time. The next big question is whether he can maintain his level of production as a full time starter, but the hunch here is that he can. And hey, maybe we just identified the first undervalued fantasy player of 2015.

References

References
1 In his defense, Cumberland was tied for 11th in yards per route run, but that’s (1) still a far cry from #2 and (2) more a reflection of the weakness of the 2013 Jets supporting cast.
2 Jordan Reed is second.
{ 4 comments }

College Football Rivalry Weekend

A couple of quick notes on rivalry weekend, using the latest SRS ratings. All rankings come from the College Football Playoff.

#15 Auburn at #1 Alabama (-8.5)

In the SRS, Alabama is first overall with a rating of 61.7; Auburn is 7th overall, which may surprise some folks, courtesy of a 57.5 rating. Given that the game is in Tuscaloosa, that would imply a spread of -7.2, not too far off of the 8.5-point line. Auburn is probably a top ten team in Vegas’ ratings as well, so this Iron Bowl may be closer than some experts think.

Florida at #2 Florida State (-7.5)

Sure, FSU is ranked #2 in the country while Florida is an unranked and disappointing 6-4. But the teams are pretty close in the SRS, with the Seminoles at #17 (51.6) and the Gators at #24 (49.4). We would expect the spread in Tallahassee to be FSU -5.2, again, closer than you might think. A Florida upset would be surprising, but not shocking.

#3 Oregon at Oregon State (+19.5)

This one should not be all that close: Oregon has a 60.3 in the SRS, which would imply a 23.8-point spread over the Beavers (33.5). Don’t believe anyone who invokes the phrase “throw the records out” when they preview this game.

#4 Mississippi State at Ole Miss (+2.5)

The SRS narrlowly prefers Ole Miss despite the worse record: the Rebels should be 3.6-point favorites given the ratings of each team. This game is a true toss up, but also one where the spread is about 6 points off of the SRS.

#5 TCU at Texas (+5)

Given the records for each team — 9-1 for the Horned Frogs, 6-5 for the Longhorns — you might be surprised that the spread is just five points. TCU has an SRS rating of 59.4, while Texas is down at 44.4. We would expect TCU to be 12-point favorites, so the spread being off by a full touchdown here is an eye-opener. On the other hand, Texas has been playing better of late, so the upset watch is on in Austin.

Michigan at #6 Ohio State (-21)

This is one spread that lines up perfectly with the SRS: Ohio State is 17.7 points better than Michigan on a neutral field, so being three touchdown favorites at home makes sense.

#7 Baylor vs. Texas Tech (+24.5)

Baylor (59.5) is 4th overall in the SRS, while the Red RAiders are down at #82 (32.4). That would imply a home spread of Baylor -30, so I guess Vegas views this game as ever-so-slightly more competitive than the SRS.

Stanford at #8 UCLA (-5.5)

UCLA has an SRS of 53.5, good enough for 15th overall. Stanford is a competitive 6-5, but the Cardinal’s 46.6 rating puts them down at 32nd in the SRS. Given that the game is in LA, a 10-point spread would make sense. The Bruins have a very uphill battle to crack the top 4, but a win over Stanford is the first domino that must fall (well, a Texas win tonight would help, too).

{ 0 comments }

Guest Post: Bryan Frye and Win Contribution Rating

Bryan Frye is back with another fun guest post.  Bryan, as you may recall, owns and operates his own great site at http://www.thegridfe.com/, where he focuses on NFL stats and history.  You can view all of Bryan’s guest posts at Football Perspective at this link.

Oh, and Happy Thanksgiving to all the loyal Football Perspective readers!


Win Contribution Rating

It’s Thanksgiving. I don’t have a ton of time to write; you don’t have a ton of time to read. Let’s make this snappy.

A few months ago, I began using a rating that I feel better describes a quarterback’s contributions to helping his team win. I am terrible at coming up with names for stuff like that, but Football Guy Adam Harstad swooped in like a guardian angel and suggested the name “Win Contribution Rating.” I liked it, and I began using it without delay.

I used three metrics that correlate highly with future wins: Brian Burke’s EPA/P, Football Outsiders’ DVOA, and my Adjusted Yards per Play (AYP). [1]Please note that the difference between the 45 yard penalty Chase uses and the 50 yard penalty I use for interceptions is based on this article by Brian Burke. I chose 50 as a compromise between the … Continue reading  The correlation coefficients with future wins (i.e., Year N+1 wins) for the individual metrics are .273 for EPA/P, .265 for DVOA, and .256 for AYP. [2]This includes all quarterbacks for which data is available from both FO and AFA, from 1999-2012. I did not include 2013 because I didn’t know year N + 1 wins; I’m not in the fortune telling … Continue reading When I ran those in a multiple regression, I got the following best fit equation (rounded):

Win% = .5 + EPA/P *.39 + DVOA * .13 + AYP * .008

Because the basis of this regression is win percentage, the equation spits out small decimals that I find aren’t relatable to most of the casual fans I know. To transform this into a number that resembles the NFL passer rating that people already know, I simply multiply by 140 to find the Win Contribution Rating. [3]This may seem strange, but keep in mind that the NFL multiples by 16.67 to achieve its final passer rating.

The highest score since 1999 belongs to Peyton Manning in his virtuoso 2004 performance. Let’s take a look at his rating:

EPA/P: .38
DVOA: 58.9%
AYP: 9.1
WCR = (.5 + .38 * .39 + .589 * .13 + 9.1 * .008) * 140 = 111.7 [continue reading…]

References

References
1 Please note that the difference between the 45 yard penalty Chase uses and the 50 yard penalty I use for interceptions is based on this article by Brian Burke. I chose 50 as a compromise between the traditional and the new research. For fumbles, I used the standard 50 yard penalty and divided it in half to account for the randomness of recovery.
2 This includes all quarterbacks for which data is available from both FO and AFA, from 1999-2012. I did not include 2013 because I didn’t know year N + 1 wins; I’m not in the fortune telling business.
3 This may seem strange, but keep in mind that the NFL multiples by 16.67 to achieve its final passer rating.
{ 6 comments }

Last week, the Game Script winners went 14-0. In week 12, there were two moderately-sized comebacks:

  • In New York, the Giants jumped out to 14-3 and 21-10 leads, fueled in part by Odell Beckham being ridiculous. But then the Cowboys offensive line got ridiculous, and Dallas went on a 21-7 run to win the game despite posting a Game Script of -4.0.
  • In Denver, the the Dolphins controlled the game for most of the first three quarters. Miami led 21-10 with two minutes left in the first half, and later took a 28-17 lead into the fourth quarter. But the Broncos scored three straight touchdowns to put the game out of reach, despite finishing with a Game Script of -4.3.

Denver had posted a Game Script of at least +5.0 in 6 of the team’s first 7 games, after doing so in 10 of 16 games in 2013. But things have changed drastically in Denver over the last month: the Broncos have had Game Scripts of -11.5, -7.7, and now -4.3 in three of the team’s last four games.

On the positive Game Script side, the Eagles (+14.3) and Bills (+14.2) were the big producers this week, although New England’s +11.2 against Detroit might have been the most impressive when you consider strength of schedule. The table below shows the week 12 Game Scripts data: [continue reading…]

{ 1 comment }

New York Times, Post Week-12 (2014): Total QBR

This week at the New York Times, I take my annual look at ESPN’s Total QBR:

In 2011, ESPN introduced Total QBR, or Total Quarterback Rating, a proprietary statistic intended to capture several of the hidden aspects of quarterback play. The next year, the Indianapolis Colts drafted quarterback Andrew Luck. And while he has helped revitalize the franchise, he has also served as one of the shining examples of how Total QBR credits players for positive plays that are otherwise ignored.

As a rookie, Luck ranked 26th in passer rating but ninth in Total QBR; last year he finished 18th in passer rating but eighth in Total QBR. So what was traditional passer rating missing when it came to Luck? In both years, he ranked in the top three in value added via penalties and on the ground. He did the little things — drawing a significant number of penalties (including value pass interference flags), making key contributions with his legs — that traditional passer rating ignored.

This year, though, Luck ranks slightly higher in passer rating (seventh) than Total QBR (eighth). Alok Pattani and Sharon Katz of ESPN Stats & Information, via email, shed some light on Luck’s season, along with other quarterbacks who have exhibited key differences between their Total QBR and passer rating numbers.

While Luck is having a breakout year via traditional metrics — he leads the N.F.L. in passing yards and is on a pace to set career highs in completion percentage, passer rating and touchdown percentage — he has taken a step back in some of the areas in which he used to excel. Luck picked up a first down on 78 percent of his rushes last year, but that number has dropped to 40 percent in 2014. Scrambles represent the majority of his rushes, and he gained a first down on 75 percent of them last year, compared with 29 percent of them this year. He also ranked third among quarterbacks in Expected Points Added via penalties in 2012 (+12.6), in part because he drew 13 defensive pass interference plays for 238 yards. This year Luck ranks 14th in penalty E.P.A. (+3.5), with five pass interference calls for 104 yards

You can read the full article here.

Finally, a Brian Hoyer note or two that made its way to the cutting room floor. Hoyer ranks 10th in ANY/A but 23rd in Total QBR. I was curious about that, and here is what Alok and Sharon were able to tell me:

  • Hoyer has really struggled on third downs. He ranks 2nd-to-last among qualifiers in completion percentage (49%), Y/A (5.7), and first down pct (32%) on 3rd downs.  Not coincidentally, the Browns rank 2nd-to-last in NFL in 3rd down conversion rate.
  • Hoyer has also been really bad at running, with 4 yards on 22 carries (only 4 1st downs).  Total rush EPA of -5.6 is lowest in NFL this season.
  • Hoyer’s also getting bad grades for the context of his interceptions: five of his interceptions cost his team 4+ EPA, including two of his picks against Falcons.  Only Cutler, Bortles, and Dalton have more “really bad” interceptions.
{ 4 comments }

Rookie Quarterbacks: It Is Not 2012 Anymore

It's been a rough year for rookies like Blake Bortles

It’s been a rough year for rookies like Blake Bortles

Jets second-year quarterback Geno Smith has averaged 3.88 Adjusted Net Yards per Attempt this year, which has resulted in him being benched for Michael Vick. That 3.88 ANY/A average is the worst of the 34 qualifying quarterbacks this season. In fact, only three other quarterbacks have averaged fewer than five Adjusted Net Yards per Attempt this year: Derek Carr (4.93), Teddy Bridgewater (4.75), and Blake Bortles (4.16). Those three, along with Johnny Manziel, were selected in the top 40 of the 2014 Draft. Since Manziel has been on the bench most of the season, and Zach Mettenberger does not yet have enough attempts to qualify, this means the only three rookie quarterbacks in the NFL this season have been terrible. With a capital T.

Which maybe isn’t too surprising. But it is a bit different. In 2008, Matt Ryan and Joe Flacco played well as rookies, with Ryan posting outstanding numbers and Flacco making it to the AFC Championship Game. In 2009, Mark Sanchez made it to the AFC Championship Game, too. In 2010, Sam Bradford set some volume-based passing records, and helped St. Louis go from 1-15 to 7-9. In 2011, Cam Newton and Andy Dalton had varying degrees of success, and generally exceeded expectations. [continue reading…]

{ 4 comments }

In Minnesota, Aaron Rodgers and Richard Rodgers combined for an incredible touchdown. No really, take a look (h/t Aaron Nagler): [continue reading…]

{ 11 comments }

The week 13 college football slate was not very exciting, so let’s just get straight to the updated rankings:

RkTeamConfConf RkGMOVSOSSRSREC
1AlabamaSEC11117.444.361.710-1
2OregonP1211119.540.860.310-1
3GeorgiaSEC21118.341.659.99-2
4BaylorB1211022.936.659.59-1
5TCUB1221019.340.159.49-1
6MississippiSEC31114.243.8588-3
7AuburnSEC4119.847.757.58-3
8Mississippi StSEC5111740.457.410-1
9Michigan StB1011118.538.156.69-2
10Ohio StateB102111838.256.210-1
11OklahomaB1231112.842.955.78-3
12Kansas StB1241012.64254.58-2
13WisconsinB1031117.43754.49-2
14ArkansasSEC6119.644.253.86-5
15UCLAP122117.945.653.59-2
16LSUSEC7117.945.253.17-4
17Florida StACC11113.138.551.611-0
18Georgia TechACC21112.838.150.99-2
19MissouriSEC8119.141.550.69-2
20ArizonaP1231110.839.750.59-2
21Southern CalP124118.741.750.47-4
22TennesseeSEC9111.747.949.65-6
23MarshallCUSA11124.924.749.611-0
24FloridaSEC10107.641.849.46-4
25Texas A&MSEC11116.742.549.27-4
26NebraskaB104111138.249.28-3
27Arizona StP1251110.238.648.89-2
28LouisvilleACC31111.436.948.38-3
29West VirginiaB125114.543.848.36-5
30ClemsonACC4119.337.947.28-3
31Miami FLACC5116.540.5476-5
32StanfordP126117.139.546.66-5
33UtahP127113.54346.47-4
34Notre DameInd1115.440.946.37-4
35MinnesotaB10511639.245.28-3
36TexasB126112.242.144.46-5
37South CarolinaSEC12112.341.844.16-5
38WashingtonP12812539.144.17-5
39DukeACC6119.834.143.98-3
40Boise StMWC11110.533.443.99-2
41Colorado StMWC21112.929.942.810-1
42MemphisAmer11113.329.442.78-3
43Virginia TechACC7112.240.342.55-6
44IowaB106114.637.842.57-4
45MarylandB107111.54142.57-4
46Boston CollegeACC811438.442.36-5
47VirginiaACC9110.841.542.35-6
48Louisiana TechCUSA2119.532.642.17-4
49North CarolinaACC1011-0.941.540.66-5
50Utah StMWC3129.630.940.59-3
51East CarolinaAmer21011.129.240.37-3
52CincinnatiAmer3107.732.139.87-3
53PittsburghACC11112.936.739.75-6
54CaliforniaP12911-2.44239.65-6
55NorthwesternB10811-140.639.55-6
56KentuckySEC1311-2.641.839.25-6
57Penn StateB109113.136396-5
58MichiganB101011-0.939.338.55-6
59Brigham YoungInd2118.629.738.47-4
60Georgia SouthernSun11113.822.936.78-3
61Central FloridaAmer4108.328.436.77-3
62Oklahoma StB12711-5.34236.65-6
63Western MichiganMAC11111.724.936.68-3
64NavyInd3103.432.936.35-5
65North Carolina StACC1211-0.236.2366-5
66Washington StP121011-6.341.435.13-8
67Arkansas StSun2115.329.434.76-5
68Western KentuckyCUSA3114.929.734.66-5
69NevadaMWC4110.733.634.46-5
70RutgersB101111-4.338.634.36-5
71ToledoMAC2112.431.834.27-4
72RiceCUSA4112.731.233.87-4
73HoustonAmer5107.126.533.66-4
74Alabama-BirminghamCUSA5110.732.833.55-6
75Oregon StP121111-437.533.55-6
76SyracuseACC1311-7.140.433.33-8
77PurdueB101211-942333-8
78TempleAmer6104.428.6335-5
79IllinoisB101311-8.241.132.95-6
80Air ForceMWC5117.425.332.78-3
81ColoradoP121211-10.643.132.52-9
82Texas TechB12811-1042.432.44-7
83IndianaB101411-840.232.23-8
84Northern IllinoisMAC3115.726.432.29-2
85Iowa StB12910-11.443.4322-8
86San Diego StMWC6112.828.331.26-5
87Central MichiganMAC4122.928.231.17-5
88UTEPCUSA6110.429.930.36-5
89KansasB121011-11.441.530.23-8
90Louisiana-LafayetteSun3110.928.929.87-4
91Fresno StMWC711-3.33329.75-6
92Middle Tennessee StCUSA711-0.630.129.56-5
93Appalachian StSun4115.123.9296-5
94Bowling GreenMAC5110.428.228.67-4
95WyomingMWC811-9.437.528.14-7
96Florida Int'lCUSA812-2.33027.74-8
97Hawai`iMWC912-6.633.6274-8
98VanderbiltSEC1411-15.141.926.83-8
99South AlabamaSun511-2.529.326.76-5
100San José StMWC1011-733.326.33-8
101Florida AtlanticCUSA911-8.434.526.13-8
102Texas St-San MarcosSun6112.423.726.16-5
103AkronMAC611-0.526.425.95-6
104Ball StMAC711-1.827.325.54-7
105Louisiana-MonroeSun711-5.330.425.14-7
106Wake ForestACC1411-10.635.625.13-8
107South FloridaAmer711-8.232.724.54-7
108Ohio U.MAC811-529.524.45-6
109Old DominionCUSA1011-5.629.724.15-6
110MassachusettsMAC911-427.823.83-8
111New MexicoMWC1111-8.832.323.53-8
112TulaneAmer811-12.135.623.43-8
113Texas-San AntonioCUSA1111-9.632.923.33-8
114Southern MissCUSA1211-12.935.9233-8
115BuffaloMAC1010-1.324.2234-6
116North TexasCUSA1311-4.626.922.34-7
117Miami OHMAC1111-9.63121.32-9
118ArmyInd411-7.827.8204-7
119TulsaAmer911-12.732.419.72-9
120ConnecticutAmer1010-12.831.718.92-8
121Kent StMAC1210-12.33118.71-9
122TroySun811-10.528.5183-8
123UNLVMWC1212-14.331.116.72-10
124New Mexico StSun911-11.526.6152-9
125IdahoSun1010-12.527.5151-9
126Georgia StSun1111-17.43012.61-10
127SMUAmer1110-27.439.412.10-10
128Eastern MichiganMAC1311-19.63111.42-9

[continue reading…]

{ 1 comment }

Comparing the Pac-12 South and the SEC West

The Pac-12 South now has 5 teams in the top 20 of the college football playoff rankings: UCLA at #9, Arizona State at 13, Arizona at 15, Utah at 17, and USC at 19. All five teams also appear in the top 25 of the AP Poll, with 2-8 Colorado being the only Pac-12 South team left out in the cold. Meanwhile, the SEC West has lost some of its luster after a disastrous week 11: only four of seven SEC West teams are in either sets of rankings, with LSU, Texas A&M, and Arkansas now unranked.

Simple math tells us that placing 5 out of 6 teams in the top 25 is more impressive than 4 out of 7; on the other hand, 25 is a pretty arbitrary cut-off point. Three SEC West teams appear in the top 8 of the playoff rankings, compared to zero Pac-12 teams. The same is true of the AP Poll, where Alabama, Mississippi State, and Ole Miss are all ahead of #11 UCLA, the highest-ranked Pac-12 South squad. If you were to combine the two divisions, the rankings would look something like this:

  • SEC West (Alabama)
  • SEC West (MSU)
  • SEC West (Ole Miss)
  • P-12 South (UCLA)
  • P-12 South (Arizona State)
  • P-12 South (Arizona)
  • SEC West (Auburn)
  • P-12 South (Utah)
  • P-12 South (USC)
  • SEC West (LSU)
  • SEC West (Texas A&M)
  • SEC West (Arkansas)
  • P-12 South (Colorado)

From that vantage point, the Pac-12 South doesn’t look so hot: the #1 team in the SECW is ahead of the #1 team in the P-12S, the #2 is ahead of #2, #3 is ahead of #3, #4 is ahead of #4, and the 6th and 7th best teams are ahead of the 6th best team.  The only advantage the Pac-12 South has, perhaps, is that it’s 5th best team — USC — has a slightly better resume than that of the 5th best team — LSU — in the SEC West.

But all of the above is based solely on the rankings.  When you look deeper at each team’s season, the differences become more stark.

For starters, Colorado is a terrible team, while the SEC West boasts no bad teams.  Arkansas is 5-5, courtesy of a 1-4 record in the SEC West and a loss to Georgia; on the other hand, the Razorbacks also blew out Alabama-Birmingham, Texas Tech, and Northern Illinois, three teams that are very comparable to Colorado.  Against Alabama, Georgia, and Mississippi State — three top ten teams — the Hogs are 0-3 but with an average margin of defeat of just 7 points.

If we want to just look at the quality teams in each division, then, we are looking at 5 teams in the Pac-12 South and 7 in the SEC West.  It’s probably unfair to do such a comparison to the SEC West, but let’s do it anyway.

Head to Head

Let this be a good reminder of how frustrating college football analysis can be: not only have there been zero games this year between the SEC West and the Pac-12 South, but there have been no interconference games at all between the SEC and the Pac-12. In fact, there’s only one team in the country that’s even played a team from both divisions: Memphis, which lost 24-3 in Oxford and 42-35 at the Rose Bowl.

Losses

The seven SEC West teams have just three losses in non-division play this year, which is three times as many as it had week ago.  Those three loses were by Arkansas and Auburn to a very good Georgia team, and by Texas A&M to a pretty good Missouri squad.

The five Pac-12 teams have five interdivision losses: UCLA and Utah both lost to an excellent Oregon team, which is pretty understandable.  From there, though, the wheels fall off the track pretty quickly: USC lost to 6-4 Boston College, Arizona State lost to a 4-6 Oregon State, and Utah lost at home to a 3-7 Washington State team.  The Utes led 21-0 in that game and 27-14 in the 4th quarter, but wound up losing 28-27 in one of the more inexplicable losses of the year.

Judged solely by losses, the SEC West is the far superior division.  The biggest wart is probably Auburn’s blow out loss against UGA, but Utah also lost by 24 at home to Oregon, so the Pac-12 South can’t say it has avoided blow outs, either.

Wins

The most impressive non-division win from either set of schools this year probably belongs to the Pac-12: [1]At least if you exclude Margin of Victory. If you include that, one could make the case for the 34-3 win by Ole Miss over Tennessee, which registered a whopping 79 on the SRS, the 9th best result … Continue reading Arizona’s 7-point win in Eugene over the Ducks. After that, though, one could argue that the next seven best wins came from the SEC West.

Close calls aside, there’s nothing to criticize about when it comes to wins on the road against Kansas State (Auburn) or on a neutral field against Wisconsin (LSU). Those two teams a combined 15-2 in all other games. A neutral site victory against 6-5 West Virginia (Alabama) counts for something, too.  Tennessee and Florida are both inconsistent SEC East teams, but (1) the SRS has both teams in the top 25, and (2) both teams are in the top 30 of Sagarin’s pure predictor ratings.  The Football Outsiders ratings have both squads slightly lower, but in any event, SEC West teams have registered a 4-0 record against those two teams.

What about the Pac-12? After Oregon, the next best win is either: (1) any of the wins by ASU, Southern Cal, or Utah against Stanford, (2) Arizona State against Notre Dame, or (3) UCLA against Texas.  Those are all solid wins, but those five are pretty comparable to the five against West Virginia, Tennessee, and Florida.

Conclusion

The Pac-12 South now has five top 25 teams, but the number 25 is a pretty arbitrary bench mark. The SEC West, despite having an additional team, is stronger top to bottom. The SEC West has entirely avoided losses to bad teams, something the Pac-12 South can’t quite represent. And when it comes to non-division wins, it’s a close call, but the SEC West probably has the better case to be made. The Pac-12 South remains a great division, but it’s clear that even after a rough week 11, the SEC West is still the top division in college football.

References

References
1 At least if you exclude Margin of Victory. If you include that, one could make the case for the 34-3 win by Ole Miss over Tennessee, which registered a whopping 79 on the SRS, the 9th best result this year.
{ 0 comments }

Checkdowns: College Football QB ANY/A, 2014

Adjusted Net Yards per Attempt is the basic measure I use to measure quarterback performance. ANY/A, of course, is calculated as follows:

(Passing Yards + 20*PassingTDs – 45*INTs – SackYardsLost) / (Sacks + Attempts)

Finding college football sack data is notoriously challenging, but ESPN does at least list sack numbers (but not sack yardage lost) for quarterback. But if we assume each quarterback loses 6.7 yards per sack [1]Based on the results here., then we can calculated estimated ANY/A. And we can also calculate estimated value.

This year in college football, the average ANY/A is 6.13. Let’s use Oregon’s Marcus Mariota as an example. The Heisman frontrunner has thrown for 2,780 yards and 29 touchdowns on 277 attempts, while being sacked 23 times and throwing just two interceptions. As a result, Mariota has an ANY/A of 10.39. That’s 4.26 ANY/A above average, and over the course of Mariota’s 300 dropbacks, that means he’s provided 1,278 of Adjusted Net Yards of value over average. As it turns out, that’s the most in college football. The table below is fully sortable and searchable, and it lists the 172 quarterbacks this season with at least 50 pass attempts:

RKPLAYERTEAMCOMPATTYDSTDINTSACKANY/AVALUE
1Marcus MariotaORE18627727802922310.391278
2Garrett GraysonCSU2043113024265209.621157
3Cody KesslerUSC2383392919293228.911005
4Jared GoffCAL2624193398304238.29956
5Brandon DoughtyWKU2844253507318178.26945
6Rakeem CatoMRSH1682842613267119.3937
7Zach TerrellWMU1932772668196139.28914
8Blake SimsALA170276245418379.3898
9Connor CookMSU159274246619589.1839
10Bryce PettyBAY1642832421213138.85805
11J.T. BarrettOSU1652582356298208.78739
12Gunner KielCIN1682792485241078.63716
13Trevone BoykinTCU2293863021245177.85693
14Kenny HillTA&M2143212649238157.88590
15Shane CardenECU2634183216205197.47586
16Brad KaayaMIA16026724032210148.18577
17Jake WatersKSU1882952569145207.9560
18Kale PearsonAFA86140134213299.74539
19Connor HallidayWSU35452638733211207.11538
20Deshaun WatsonCLEM791181197122810.27521
21Dak PrescottMSST17328725212010157.85520
22Bo WallaceMISS1902972554228237.75519
23Justin ThomasGT75145139615499.45512
24Everett GolsonND22737430442712217.35483
25Brett HundleyUCLA2203052547174297.52466
26Drew HareNIU141230172014178.05456
27Jameis WinstonFSU22133628441812147.34426
28Gary NovaRUTG13923922121610167.74412
29Seth RussellBAY406872271012.01400
30Blake FrohnapfelUMASS24143733452310226.99395
31Wes LuntILL1412161671143107.74364
32Nick MarshallAUB125210168814587.75354
33Grant HedrickBSU23032227951713187.15346
34Dylan ThompsonSC21736127942210187.03341
35Taylor HeinickeODU22836728922511247340
36Driphus JacksonRICE1412451960154197.4335
37Cody SokolLT20033725132410146.98298
38Hutson MasonUGA1502221638163137.39296
39Clint TrickettWVU28141932851810266.79294
40Mike BercoviciASU101164132210377.84292
41Trevor KnightOKLA162279219714967.13286
42Cooper RushCMU1912932416189237.02281
43Marquise WilliamsUNC2343692773208226.82270
44Davis WebbTTU2113452539241346.9269
45Anu SolomonARIZ2564413058257226.69259
46Joe LicataBUFF20431823922511156.9256
47Taylor LambAPP157253196313787.1255
48Will GardnerLOU1272211669123137.21253
49Paxton LynchMEM1953032299126136.9246
50Darell GarretsonUSU9113511408397.67222
51Joshua DobbsTENN61997907228.18208
52Luke FalkWSU841209038177.65193
53Treon HarrisFLA33565654159.29193
54Jaquez JohnsonFAU1522631778153126.77178
55Travis WilsonUTAH1322211558132166.84169
56Cyler MilesWASH1512291627122176.76156
57Brandon AllenARK1602761905155116.64148
58Michael CummingsKU113195149273136.78135
59Phillip ElyTOL41685414128.04134
60Taylor KellyASU1131971498145176.72128
61Kent MyersUSU43575314178.11127
62Nick ArbuckleGAST21435428121912286.45124
63Cody ClementsUAB1542281910118206.6116
64Kevin EllisonGASO631098655347.11111
65Jake RudockIOWA1722691863124136.51108
66Logan WoodsideTOL151252177314776.53104
67Tommy Armstrong Jr.NEB1282481889149126.4890
68Jacoby BrissettNCST1973332278195246.3685
69Chad VoytikPITT1362201688126186.4679
70Kevin HoganSTAN1872932155157216.3775
71Lamar JordanUNM50946995256.8269
72Andrew HendrixM-OH2074203062228396.2868
73Caleb RoweMD34544895417.3165
74Justin HolmanUCF14525520091610206.3560
75Tyler JonesTXST2203442403207266.2547
76C.J. BeathardIOWA39695003146.6941
77Chad ChalichIDHO36644912216.6836
78Derrius VickOHIO8414210356396.3634
79Austin GrammerMTU19229522981510246.2333
80Munchie LegauxCIN41624063126.3715
81Matt JohnsUVA8615610448516.1910
82Nate SudfeldIND10116711516386.1910
83Patrick MahomesTTU52946216266.11-2
84Fredi KnightenARST2313802578175296.11-7
85Johnny McCraryVAN611148069626.06-8
86Taysom HillBYU8813297573146.07-8
87Blake JurichSJSU52816295455.99-11
88Dontreal PruittTROY44775331145.94-15
89Kyle AllenTA&M7913088411585.98-20
90Dajon WilliamsUNT46776077495.89-20
91Sean MannionORST2333682688127306.06-27
92Christian StewartBYU1402441633135175.95-45
93Jameill ShowersUTEP122219141711595.93-45
94Reggie BonnafonLOU519266241155.57-59
95Joel StaveWIS571046886455.45-73
96Joe GraySJSU2013172215109115.9-73
97Keenan ReynoldsNAVY429270753155.34-84
98Brandon SilversTROY162237156083175.79-85
99Mitch LeidnerMINN881711310108155.64-90
100Ozzie MannBALL921619476275.54-99
101Terrel HuntSYR831459831435.43-104
102Grant RohachISU27542832144.33-104
103Mike WhiteUSF90182128887105.55-110
104Steven BenchUSF36764662254.72-114
105Mitch TrubiskyUNC29563143314.08-117
106Angel SantiagoARMY336444011114.55-118
107Tyrone SwoopesTEX1913252152126205.76-126
108Nick MullensUSM1943232207119145.72-137
109Patrick TowlesUK2113632542147335.77-141
110Greg Ward Jr.HOU102145100565125.22-142
111Brandon BridgeUSA1192311457104175.5-156
112Anthony JenningsLSU92192135396195.38-157
113Terrance BroadwayULL1552591771129145.54-161
114Cody FajardoNEV2093392202149135.65-167
115Brandon ConnetteFRES29532992343.11-172
116Kendal ThompsonUTAH325232422103.34-173
117Dane EvansTLSA21339026452012235.69-180
118Tanner McEvoyWIS651127095634.51-186
119Jack MilasBALL10419211337555.15-193
120Colby KirkegaardWYO1743012214118335.55-194
121Chandler WhitmerCONN1212141471116255.24-211
122Stephen RiversVAN25633340322.86-213
123Andrew McNultyUNT7814090945104.65-222
124Nick MontanaTULN42723001213.06-224
125JD SpragueOHIO94194118333124.99-235
126Reginald Bell Jr.EMU6111276944174.3-235
127Sefo LiufauCOLO29845328422614155.62-236
128Quinn KaehlerSDSU137235165689175.15-247
129Alex McGoughFIU1272491624147255.19-257
130Sam B. RichardsonISU1883231938146185.36-262
131Josh GreerUNT24501710241-277
132Maty MaukMIZZ15629417841910155.22-280
133James KnapkeBGSU22539625141210135.42-289
134Matt DavisSMU558952123143.23-299
135Anthony BooneDUKE2213912232167115.38-300
136Cole WeeksUSM5911276125153.74-303
137Austin ApplebyPUR9918910758694.57-309
138Tyler MurphyBC1011841293910164.58-310
139Reilly O'TooleILL6311474556153.68-316
140Chuckie KeetonUSU51924262432.8-316
141Tommy WoodsonAKR761438065664-317
142Greyson LambertUVA12220412758994.55-335
143Tucker CarterUTSA7813880625103.74-353
144Daxx GarmanOKST15227720411212314.98-354
145Wade FreebeckVAN34723761571.57-360
146Kyle PohlAKR191340199896155.09-368
147Cole StoudtCLEM145235144458114.51-397
148Brian BurrellFRES16828917691610224.8-414
149AJ LongSYR7212872746133.19-414
150Danny EtlingPUR8916280065113.59-439
151Montell CozartKU6412870157112.97-439
152Justin WorleyTENN1572521579128294.5-457
153Rob BoldenEMU419539945111.7-469
154Zander DiamontIND388128213111.01-470
155Michael BrewerVT21835622371512234.86-479
156Austin RobinsonUTSA7312658514112.56-488
157John O'KornHOU8917294468113.44-491
158Pete ThomasULM2384062524115415.02-495
159Tyler RogersNMSU2253612363152044.76-500
160Devin GardnerMICH1392271557813194.08-503
161Blake DeckerUNLV20034925281015334.8-509
162C.J. BrownMD1472791723119274.43-518
163Colin ReardonKENT20035521681215104.56-570
164Tanner LeeTULN14426015521213154.02-579
165P.J. WalkerTEM16430818661214164.22-616
166Jeff DriskelFLA9718492861092.79-645
167Garrett KrstichSMU9617484926162.69-652
168Ikaika WoolseyHAW1733542060910294.17-751
169Matt LinehanIDHO20034123191017373.98-810
170Trevor SiemianNW2213802121610303.88-922
171Christian HackenbergPSU2073732318714373.85-932
172John WolfordWAKE1722991626913342.98-1047
  • It’s important to remember that much more so than in the NFL, strength of schedule is a significant variable in all college football analysis. That is completely ignored here. In addition, coaching and scheme matter more, too, and that is not considered in this analysis. This is simply a quick and dirty look at the numbers.
  • Jameis Winston checks in only at #27. This is not because ANY/A is a bad way to measure quarterback play — in fact, Winston ranked 2nd in the SOS-adjusted version of this last year, while averaging 10.2 ANY/A. He’s had a down year, at least statistically.
  • Down at the very bottom of the list, in second to last place? Penn State’s Christian Hackenberg. It’s been a rough year for the Nittany Lions offense, as the offensive line is in shambles. Hackenberg, considered to be a possible first round pick in 2016, will need to put together a much better season statistically in 2015 if he wants to keep that dream alive.

References

References
1 Based on the results here.
{ 11 comments }

FanDuel Lineups – Week 12, Thursday Night

Daily fantasy football is pretty sweet, and I’ve become very active in it this year. I’ve only played on FanDuel (affiliate link, here), so my analysis will be limited strictly to that site.

At FanDuel, you start 1 QB, 2 RBs, 3 WRs, 1 TE, 1 K, and 1 defense, with a salary cap of $60,000. The scoring system is pretty standard, with 0.5 points per reception being the most notable feature to keep in mind. There are generally two that I play: 50/50s, or what people refer to as cash games, where you say, pay $25 to enter a tournament of 50 people, and the top 25 people win $45. The house gets roughly the same cut of ~10% in most games, so the 50/50 is the low-variance play.

The other option is to play in tournaments, which can range from large, to very large, to absurdly large. Anyway, enough minutia. I have limited my play to 50/50s this week, although I did enter one tournament lineup which I’ll explain at the end. [continue reading…]

{ 0 comments }

Week Eleven Game Scripts: Game Script Winners go 14-0

Some weeks, the NFL is filled with comebacks. Some weeks there are teams that wind up winning with strongly negative Game Scripts. And then there was week 11. There were only three comebacks last weekend, and none of them were last-minute comebacks:

  • Seattle led 20-17 entering the 4th quarter, but the Chiefs scored the game’s final points — a Knile Davis touchdown — with over 13 minutes left in the quarter.
  • Pittsburgh technically trailed 24-13 entering the 4th quarter, before Le’Veon Bell scored on the first play of the final frame. The Steelers scored the go-ahead score with just over nine minutes left, and since Pittsburgh led for most of the first half, the Steelers finished with a Game Script of +0.3.
  • Carolina took a 1-point lead with just over 6 minutes left in the game against Atlanta, but the Falcons responded with a field goal on the ensuing drive to win the game. The kick came with just over 2 minutes remaining, but a 1-point 4th quarter deficit doesn’t move the Game Script needle.

The table below shows the Game Scripts for each game in week 11. As you can see, despite some shocking upsets, week 11 was as straightforward as it gets: all 14 teams with positive Game Scripts were victorious. For the second straight week, the Packers provided the biggest Game Script of the week, while the Bucs (!) were the only other team with a Game Script in double digits. [continue reading…]

{ 6 comments }

The Steelers beat the Tennessee Titans on Monday Night, narrowly moving into second place in the competitive AFC North in the process. But in reality, all Pittsburgh did was hold serve: the Bengals, Browns, and Ravens have all already defeated the Titans this year.

Each team in the AFC North plays six division games, four games against the AFC South, and four games against the NFC South. Then, based on how each team finished in 2013, single games are played against teams from the AFC East and West. Given that all four teams in the AFC North are within a half-game of each other, I thought it would be instructive to take a look a more in-depth look at how the schedules have unfolded to date. [1]Regular readers may recall that I did this with some shockingly-accurate precision last November for the NFC East.

Let’s begin with games against the worst division in football, the NFC South: [continue reading…]

References

References
1 Regular readers may recall that I did this with some shockingly-accurate precision last November for the NFC East.
{ 7 comments }

New York Times, Post Week-11 (2014): Time To R-E-L-A-X

This week at the New York Times, a look at the best quarterback in football.

When an athlete is having an excellent season, it is common for the home fans to break out into chants of “M.V.P.” from time to time. This year, in Green Bay, a five-letter cheer may be more appropriate.

“R-E-L-A-X.”

That is what quarterback Aaron Rodgers told Packers fans after a loss to Detroit dropped Green Bay’s record to 1-2. One could understand the fans’ frustration: The Packers scored 16 points and looked overmatched in an opening loss to the Seattle Seahawks; looked inconsistent in a comeback victory over the Jets; then scored 7 points in the Week 3 loss to the Lions. Of course, a bad stretch for Rodgers looks like a great stretch for just about every other quarterback: Through the three games he had still thrown five touchdown passes against one interception.

But the Packers’ offense was struggling: Green Bay ranked 27th in scoring through three games. The passing attack ranked 24th in yards per attempt and the team was tied for 26th in rushing yards. The Packers gained 223 yards of offense against the Lions, the fewest in a game under Rodgers since the 2008 season. The 7 points were the fewest in any game that Rodgers had started for the Packers other than another 7-point effort against the Lions in 2010 when Rodgers left the game with an injury in the first half. For a fan base used to dominant offenses, the 2014 Packers were off to an ugly start.

You can read the full article here.

{ 0 comments }

Four Blowout Upsets Ties NFL Record

The Houston Texans switched from Ryan Fitzpatrick to Ryan Mallett over the bye week. The former Patriots quarterback would make his first start in Cleveland, and he would have to do so without Arian Foster. The Texans were 4.5 point underdogs, but still won 23-7, covering by 20.5 points.

In some weeks, that would be the craziest story of the week. But not this week. In fact, it probably doesn’t crack the top three.

The Broncos were 8-point favorites on the road against St. Louis. Shaun Hill against Peyton Manning somehow turned into a 22-7 Rams win. St. Louis covered by 23 points in; points spread margins aside, was the most shocking result from week 11.

The Bengals and Andy Dalton were embarrassed on Thursday Night Football against the Browns ten days ago. The Saints, meanwhile, had won 20 consecutive home games under Sean Payton prior to losing in overtime against the 49ers last week. As a result, Cincinnati was 8.5-point underdogs in New Orleans on Sunday, yet came away with a 27-10 win, covering by 25.5 points.

But the biggest cover by an underdog [1]The Packers covered by 28.5 in a very Sanchez-tastic performance, but the Packers were favored by 4.5 points. came in the Washington/Tampa Bay game. Traveling to D.C., the 1-8 Bucs were 8-point underdogs.  Tampa entered the day with a -15 in the SRS, easily the worst in the NFL. And then the Bucs won 27-7, covering by 28 points in the process. Rookie wide receiver Mike Evans picked up 209 yards and two touchdowns, giving him 458 receiving yards and five touchdowns over the last three weeks.

If you’re thinking all these underdog blowouts were unusual, you are correct.  Last year, there was only one week all season where multiple underdogs of at least 3 points wound up covering by at least 20 points.  That came in week 3, when the Colts won by 20 as 10-point underdogs in San Francisco and the Panthers won by 38 points against the Giants as 3-point dogs. [continue reading…]

References

References
1 The Packers covered by 28.5 in a very Sanchez-tastic performance, but the Packers were favored by 4.5 points.
{ 4 comments }

The SEC West closed system is no more. If so inclined, one could note that Alabama lost to Ole Miss, and Ole Miss lost to Auburn, and Auburn lost to Georgia, and Georgia lost to both Florida and South Carolina, and Florida and South Carolina both lost to Missouri, and Missouri lost to Indiana. And Indiana is terrrrrible.

The Auburn loss to Georgia was enough to ruin this crazy streak: prior to Saturday, Auburn, Alabama, LSU, Mississippi, Mississippi State, and Texas A&M were a combined 35-0 against the rest of college football this season. But on Saturday:

  • Auburn lost badly to Georgia, 34-7. The Bulldogs are very good — and even better with Todd Gurley back — and now rank 5th in the SRS. But Georgia still did somehow lose to both Florida and South Carolina, who are a combined 9-9 this year against FBS opponents. As for the Tigers: I had been leading the Auburn bandwagon because they have easily played the toughest schedule to date in college football — oh, and Alabama is still on the schedule — but this was the straw that broke Auburn’s playoff chances.
  • LSU was shut out against Arkansas, 17-0. The Razorbacks had been 4-5, albeit with losses to Alabama, Mississippi State, Auburn, Georgia, and Texas A&M.
  • Texas A&M lost to Missouri, 34-27. The Tigers, of course, had the most embarrassing SEC performance of the season, losing to an Indiana team that is 0-6 in conference play. That’s 0-6 in the Big Ten, for you folks keeping score at home. And Missouri lost to them. As a result, any team that loses to Missouri gets to wear that shame by osmosis, and indirectly, you could stretch that all the way to Alabama.

Of course, the SRS is not based purely on wins and losses: in some ways, it isn’t based at all on wins and losses, as it is focused solely on points differential (adjusted for close games, blowouts, and home field) and strength of schedule. The table below shows the week 12 college football SRS ratings, with Alabama now moving into the top spot. As always thanks to Dr. Peter R. Wolfe for providing the weekly game logs. Some more playoff thoughts about the jump: [continue reading…]

{ 7 comments }

The SEC West and Maximum Likelihood

The upper crust of college football

The upper crust of college football

Eight years ago, Doug Drinen wrote about the Maximum Likelihood rating system, a computer model which one could use to rank college football teams. The short, non-mathy version is this: the probability of Alabama beating Team X is equal to the rating of Alabama divided by the sum of Alabama’s rating plus the rating of Team X. You can use that formula for every game in each season, which would leave you with an enormous series of equations. From there, you would give each team a rating, and keep tinkering with the ratings until the ratings you have for each team provides the system with the maximum possible likelihood of the actual results.

To do this, you would want to give Alabama a high rating, because that would increase the likelihood of the system as a whole reflecting what’s happened on the field. In fact, you might why would we ever limit Alabama’s rating: after all, if we keep jacking up the Tide’s rating, what’s the harm? In this case, there is only one reason not to give Bama an insanely high rating: a loss in Oxford to Ole Miss on October 4th.

Speaking of the Rebels, what should their rating be? A really high one, although it needs to be capped by Mississippi’s losses to both Auburn and LSU. What about Auburn and LSU? Well, both sets of Tigers lost to Mississippi State, Auburn lost to Texas A&M, and LSU lost to both Alabama and Auburn.

You might think “okay, this seems reasonable: all these losses will help control the ratings.” But there’s a problem about to emerge. Sure, LSU and Auburn lost to MSU, but the Bulldogs are undefeated, so there’s no reason not to give Mississippi State a rating of a zillion. And we already know that Alabama is going to get a high rating, so LSU’s loss to the Tide won’t hurt much. LSU lost to Auburn, but isn’t Auburn’s rating really high? The Tigers don’t get dinged for losing to MSU, while the Texas A&M loss doesn’t hurt because A&M’s only losses are to Alabama, Mississippi, and MSU. [continue reading…]

{ 1 comment }

FanDuel Lineups – Week 11, Thursday Night

Daily fantasy football is pretty sweet, and I’ve become very active in it this year. I’ve only played on FanDuel (affiliate link, here), so my analysis will be limited strictly to that site.

At FanDuel, you start 1 QB, 2 RBs, 3 WRs, 1 TE, 1 K, and 1 defense, with a salary cap of $60,000. The scoring system is pretty standard, with 0.5 points per reception being the most notable feature to keep in mind. There are generally two that I play: 50/50s, or what people refer to as cash games, where you say, pay $25 to enter a tournament of 50 people, and the top 25 people win $45. The house gets roughly the same cut of ~10% in most games, so the 50/50 is the low-variance play.

The other option is to play in tournaments, which can range from large, to very large, to absurdly large. Anyway, enough minutia. I have limited my play to 50/50s this week, although I did enter one tournament lineup which I’ll explain at the end. [continue reading…]

{ 1 comment }

Sixteen Straight Losses

Carr holds up the number of Raiders wins

Carr holds up the number of Raiders victories in 2014.

Can you think back to November 18, 2013? Lorde’s “Royals” was the number one song in the country. The price of gas was $3.30/gallon. Barack Obama was the President. And Matt McGloin (3 touchdowns, no interceptions) and Rashad Jennings (150 rushing yards) had just led the Raiders to victory over the Houston Texans.

That upped Oakland’s record to 4-6, although the team wasn’t quite that good. At the time, Football Outsiders ranked the Raiders as the 31st best team in football. On the other hand, the week 11 victory came in McGloin’s first start: surely, good things were on the horizon, right?

As it turned out, not so much. McGloin would lose each of his next five starts; Terrelle Pryor started the finale against Denver, which would be another Raiders loss. Derek Carr has since taken over, but he has yet to win a game in his young career. At 0-9, he has a chance to break both the rookie record for losses in a season (14) and the single-season record for quarterbacks losses (15). [continue reading…]

{ 7 comments }

Week Ten Game Scripts: Primetime Blowouts

Don't bet against Rodgers in Movember

Don't bet against Rodgers in Movember.

It was another week of blowouts in the NFL, particularly in prime time. On Thursday night, the Browns shocked the Browns with a 24-3 blowout, as Andy Dalton produced a historically bad performance. Cleveland had a Game Script of +12.8, which turned out to be the third largest of the week.

On Monday Night Football, the Eagles dominated the Panthers. Darren Sproles scored two first quarter touchdowns, Jordan Matthews chipped in with two touchdown catches from Mark Sanchez later in the game, and Philadelphia won, 45-21. That score is a bit misleading, as Kelvin Benjamin caught two late touchdowns: the Eagles had a Game Script of +20.0, which is more in line with about a 40-point win.

But the biggest Game Script of the week came in the other primetime game, Bears at Packers on Sunday Night Football. Aaron Rodgers was an insane 18/24 for 315 yards and 6 touchdowns… in the first half! Green Bay produced a Game Script of +28.7. The Packers took a 42-0 halftime, lead, and finished with the second best Game Script of 2014.

The table below shows the Game Scripts from every game in week 10: [continue reading…]

{ 4 comments }

New York Times, Post Week-10 (2014): Kansas City Dominance

This week at the New York Times, a look at the surprisingly dominant Chiefs.

It was the most surprising result of the season. We just didn’t know it at the time.

In the summer, Las Vegas oddsmakers pegged the Kansas City Chiefs for eight wins this season. So in Week 1, when the Tennessee Titans visited Kansas City and won, 26-10, it was easy to acknowledge that it was going to be a down year for the team. After the loss, ESPN justifiably dropped Kansas City to 26th in its power rankings.

In Week 2, Kansas City lost a close game at Denver. Since then, the Chiefs are 6-1 and have outscored opponents by 89 points. They are tied with the Indianapolis Colts for the best point differential since Week 3, and no team has a better record over that period. The Chiefs’ 41-14 rout of the New England Patriots stands as perhaps the best performance by any team this season, and yet they continue to fly under the national radar. Is it still because of Week 1? The Titans have won only once since, and there is still no good explanation for the result. But there are a lot of reasons for Kansas City’s success.

You can read the full article here.

{ 0 comments }

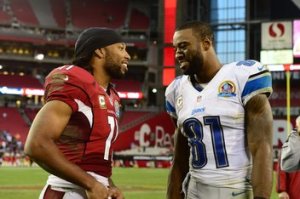
Cardinals, Lions, and Pythagnenpat Records

Two teams once known for their great receivers are now known for being great teams

Two teams once known for their great receivers are now known for being great teams.

The Arizona Cardinals are 8-1, giving them the best record in football. The Detroit Lions are 7-2, tied with the Patriots and Broncos for the second-best record through ten weeks. [1]The Eagles can match that record tonight with a win against the Panthers. In week 11, the Lions head to Arizona in a game that may well decide which team gets home field advantage in the NFC playoffs: it certainly will decide which franchise is in the pole position with five weeks left.

We should be celebrating these teams. Detroit has only had one year in its last 70 seasons when it started with a better record through 9 games: that was the ’54 squad, which began 8-1 and finished with the Lions in the NFL title game. Detroit also started 7-2 in 1993: that’s the only other time in the last 50 years that the Lions have started so well through nine games.

For Arizona, the situation is even bleaker. The team has won at least 8 of its first 9 games just two times before this year. One was in 1948, back when Hall of Famer Jimmy Conzelman  was coaching the team (then in Chicago). And the other was in 1925, when Chicago was led by Hall of Famer Paddy Driscoll. That’s it. The oldest franchise in NFL history has started with an 8-1 record (it has never began 9-0) now just three times. On the first two occasions, the Cardinals wound up winning the title, albeit with one asterisk.

But both the Lions and Cardinals have been overachieving this year, at least according to their Pythagenpat Records. Detroit has scored 182 points and allowed 142 points; that gives the Lions a 0.648 Pythagenpat winning percentage. Among the 72 teams to start 7-2 between 1990 and 2013, 59 had better Pythagenpat winning percentages. [continue reading…]

References

References
1 The Eagles can match that record tonight with a win against the Panthers.
{ 8 comments }
The Tide escaped Baton Rouge with a win and its playoff goals in sight

The Tide escaped Baton Rouge with a win and its playoff goals in sight.

The playoff picture is beginning to emerge. With most teams having just three games left in the college football regular season, we get a sense of the task ahead for the college football playoff committee. And, unfortunately, it feels as though the committee is going to use some variation of the following logic:

Step 1: Rank teams in ascending order by losses

Step 2: Rank teams by some combination of eye test and recency of last loss

There are still three undefeated teams: Mississippi State, Florida State, and Marshall. MSU and FSU seem likely to take the top 2 spots, and there does not appear to be much thought given to the process other than that. Marshall is not in the conversation, and for good reason: they have a bottom three strength of schedule according to the SRS (you can sort by SOS in the table below).

Mississippi State still ranks just 7th in the SRS, but remember, that’s a predictive ranking. I would put the Bulldogs atop my mythical rankings for playoff purposes, too. But Florida State? FSU has three notable wins on its resume, and none of them were in convincing fashion. Those wins came against Clemson (#25), Notre Dame (#31), and Louisville (#32), and one would think that the 2nd best team in the country would defeat those teams more convincingly. Regardless, as defending champions and riding a 25-game winning streak, nobody will argue against the Seminoles.

But the next two spots? That’s where the debate begins. Ignoring 9-1 Colorado State (very soft strength of schedule), 8-1 Duke (same), and 8-1 Nebraska (only one win — against SRS #23 Miami — against an SRS top-65 team), there are 6 teams with one loss that seem likely to take the #3 through #8 spots in the next edition of the playoff rankings. A best guess as to where those teams land on Tuesday:

  • #3 Oregon – the Ducks ranked 4th last week, and won in convincing fashion at Utah in week 11, while #3 Auburn slipped at home against Texas A&M.
  • #4 Alabama – a chance the Tide move ahead of Oregon because of a “big win” against a high-profile opponent in LSU. Will the committee penalize Alabama for needing overtime to beat LSU, or praise Alabama because by virtue of the game going to overtime it means LSU is a really good team (This, of course, is known as SEC country logic)?
  • #5 TCU – the Horned Frogs were 6th last week, and handled Kansas State, which ranked 7th in the rankings last week. Could TCU jump Alabama or Oregon? After all, #6 beating #7 should count more than beating #16 (LSU in last week’s rankings) or #17 (Utah), but don’t hold your breath for a team like TCU getting a wave of momentum. In fact, we might even see the Horned Frogs drop, because…
  • #6 Baylor – the Bears demolished Oklahoma in Norman in week 11. And Baylor defeated TCU back in week seven. The committee is supposed to value head-to-head, but does that mean Baylor should be ranked ahead of TCU? That argument would hold more weight, at least to me, if Baylor hadn’t lost by 14 points to West Virginia, a team that TCU happened to beat. If West Virginia had just one conference loss, Baylor, TCU, and West Virginia would all be tied and be 1-1 in the three-team round robin; instead, crediting Baylor for West Virginia losing other conference games somehow makes that Baylor loss… better? I don’t follow that logic, but who knows what the committee will do. Frankly, choosing between the top two Big 12 teams is an exercise in hair splitting. Will the recency of Baylor’s loss be held against the Bears vis-a-vis TCU? That sounds silly, but Baylor dropped below TCU after losing to West Virginia, and perhaps the Bears will never rise above them again.
  • #7 Arizona State – the Sun Devils crushed Notre Dame, and were ranked ahead of Baylor last week. Perhaps ASU will remain in the 6 spot, but frankly, the committee can punt on this question. If Arizona State and Oregon both win out, the Pac-12 championship game will turn into a de facto play-in game for the college football playoffs. Arizona State lost by 25 points to UCLA — will that weigh on the committee’s mind in choosing among the 1-loss teams? ASU’s best wins are against USC, Utah, Notre Dame, and Stanford, which still leaves a bit to be desired.
  • #8 Ohio State – just a guess, but the assumption here is the committee puts OSU in the 8 slot this week. Ohio State convincingly defeated Michigan State this week, easily the most impressive performance by the Buckeyes this year. But a home loss to Virginia Tech looks terrible in retrospect, and OSU’s second best win was against… Maryland? Penn State? Cincinnati? If Ohio State is ranked in the top 8 this week, it’s a sign that the committee is basically operating on 4th grade level. First, rank the team by losses, then….

When we go to the 2-loss teams, Auburn and Ole Miss stand out. The Tigers in particular deserve to be ahead of both Ohio State and Arizona State, in my opinion, and Auburn’s resume would only get stronger with road wins against Georgia and Alabama. Auburn has defeated Ole Miss, LSU, and Kansas State, wit two of those games coming on the road. If going 3-2 in five games that are @Ole Miss, vs. LSU, @KSU, @Mississippi State, and vs. Texas A&M supposed to be less impressive than going 4-1 @Michigan State, vs. Virginia Tech, @Maryland, @Penn State, and vs. Cincinnati? I am not buying that logic at all, and that still ignores Auburn’s wins against Arkansas, Louisiana Tech, and South Carolina, teams that all rate as tougher than Penn State and Cincinnati.

As for Ole Miss, the Rebels went 3-2 vs. Alabama, @Auburn, @LSU, vs. Texas A&M, and vs. Tennessee. Is it clear that such a record is worse than going 4-1 vs. UCLA, @Southern Cal, vs. Utah, vs. Notre Dame, and vs. Stanford? And Ole Miss still has a chance to pad its resume with a win on the road against Mississippi State.

If the committee is using strength of schedule solely as a tiebreaker after sorting teams by losses, [1]You know, after eliminating Marshall, Colorado State, Duke, and Nebraska for strength of schedule., then shame on the committee. The table below shows the week 11 college football SRS ratings, with Alabama now moving into the top spot. As always thanks to Dr. Peter R. Wolfe for providing the weekly game logs. Some more playoff thoughts about the jump: [continue reading…]

References

References
1 You know, after eliminating Marshall, Colorado State, Duke, and Nebraska for strength of schedule.
{ 2 comments }

Checkdowns: YPC Differential Leaders

Wilson's rushing prowess has powered Seattle this year

Wilson's rushing prowess has powered Seattle this year

[End of Year update: Seattle finished the season with 2,762 rushing yards on 525 carries, good enough for a 5.26 YPC average. The Seahawks allowed just 1,304 yards on 380 carries, which translates to a 3.43 YPC average. Therefore, the 2014 Seahawks averaged 1.83 more yards per carry than they allowed; that’s the second best differential since the merger, and just a behind the ’63 Browns for the third best since 1950.]

Last season, the Seahawks posted the best ANY/A differential in the NFL. In fact, it was the 9th best ANY/A differential of any team since the merger, and Seattle wound up becoming the 5th team in the top ten in that statistic to win the Super Bowl.

You heard all about Richard Sherman and Earl Thomas and the great Seahawks pass defense, and it’s not as though Russell Wilson was flying under the radar, either. But this year, the Seahawks are recording even more extreme statistics in a different differential stat.

Yards per carry is super overrated: Danny Tuccitto did a nice job revealing that just a couple of days ago. But hey, I love trivia, so let’s move on.

Seattle ranks 1st in the NFL in yards per carry (5.08). Marshawn Lynch is at 4.2 YPC on 132 carries, but it’s Wilson’s 7.6 yards per carry average on 52 carries that sets the Seahawks apart. But the defense — so unstoppable against the pass in 2013 — ranks 1st in this metric, too. Seattle is allowing just 3.19 yards per carry this year; if it holds, that would be the best mark since the 2010 Steelers.

Combine, though, is where the Seahawks really stand out. Seattle has a 1.89 YPC differential, defined as YPC for the offense minus YPC allowed for the defense. How good is that? If it holds, it would be the 2nd best mark since 1950: [continue reading…]

{ 3 comments }

Dalton was scary bad last night.

Dalton was scary bad last night.

Last night, Andy Dalton was not very good. completed 10 of 33 passes for 86 yards, while throwing 0 touchdowns and 3 interceptions. Add in his two sacks for 14 yards, and Dalton averaged -1.80 ANY/A. That’s terrible, of course, but how bad does that measure historically? Let’s use the same methodology we did when calculating how good Ben Roethlisberger was against the Colts. Against every other passer this year, the Browns had allowed 5.58 ANY/A to opposing players. As a result, Dalton finished 7.38 ANY/A below expectation.

Over the course of his 35 dropbacks, that means Dalton provided -258 adjusted net yards of value relative to expectation. That’s bad — really bad — but it only ranks as the 83rd worst performance since the merger. The table below shows the 150 worst games since 1970, although for 2014, I have only included Dalton’s game (so Geno Smith and his bad performances could make the list, but I didn’t have time to calculate — feel free to do so in the comments!). [continue reading…]

{ 13 comments }

FanDuel Lineups – Week 10, Thursday Night

Daily fantasy football is pretty sweet, and I’ve become very active in it this year. I’ve only played on FanDuel (affiliate link, here), so my analysis will be limited strictly to that site.

At FanDuel, you start 1 QB, 2 RBs, 3 WRs, 1 TE, 1 K, and 1 defense, with a salary cap of $60,000. The scoring system is pretty standard, with 0.5 points per reception being the most notable feature to keep in mind. There are generally two that I play: 50/50s, or what people refer to as cash games, where you say, pay $25 to enter a tournament of 50 people, and the top 25 people win $45. The house gets roughly the same cut of ~10% in most games, so the 50/50 is the low-variance play.

The other option is to play in tournaments, which can range from large, to very large, to absurdly large. Anyway, enough minutia. Here are my thoughts on 3 of the 50/50 lineups I entered tonight: [continue reading…]

{ 2 comments }

Projections: Mark Sanchez with the Eagles

Philadelphia's savior

Philadelphia's savior.

Nick Foles is going to miss at least the next month, and perhaps the rest of the year, with a broken collarbone. To the Eagles’ rescue comes…. Mark Sanchez?

Yes, the quarterback who in his best years provided more below-average value than any other passer in NFL history. That Mark Sanchez. Of course, the Jets passing attack has not been very good in the post-Sanchez environment: in fact, Geno Smith has been even worse than Sanchez. Statistically, Sanchez has been the best of the six quarterbacks who have thrown 20+ passes for New York since 2009. Of course, being better than Geno Smith is a pretty low bar; the more telling statistic is that and Sanchez ranked 2nd-to-last — in between Blaine Gabbert and Matt Cassel — in both passer rating and ANY/A in his final year in New York.

On the other hand, Foles has not been particularly good this year, either. Some regression was to be expected based on his otherworldly 2013 numbers, but he’s suffered noticeable declines in most categories in 2014: [continue reading…]

{ 10 comments }

These two men like to throw the ball

These two men like to throw the ball.

Andrew Luck and Tom Brady are pretty good. And it appears as though their coaches know it.

The Colts were were the 2nd strongest pass identity of any team in the NFL through seven weeks. Since then, Indianapolis has kicked it up another notch: in week 8, the Colts threw on over 80% of their plays while playing under a Game Script of -11.6 against the Steelers. Well this week, Indianapolis posted a Game Script of +13.0… and still managed to throw on 67% of all plays! Combine the team’s fast tempo with its pass-heavy nature, and you can see why Luck easily leads the league in pass attempts (oh, and pass completions, passing yards, and passing touchdowns). Luck now has 393 attempts; in NFL history, only Drew Bledsoe (401 in 1994) has thrown more passes through 9 games.

In the case of Brady, his name may as well be a proxy for Rob Gronkowski, who has transformed this offense over the past month. New England passed on 68% of plays against the Broncos, despite the Patriots having a Game Script of +11.5. With Stevan Ridley out for the year and Gronkowski playing some of the best football of his career, New England seems destined to stick with this pass-heavy approach. In each of the past three weeks, the Patriots have passed at least 10% more than one would project from the team’s Game Scripts. [1]Based on the formula: 0.000005*GameScript^3 – 0.00003 * Game Script^2 – 0.0082 * Game Script +0.5875.

The largest Game Script of the weekend was also the most surprising: Miami blew out San Diego, 37-0, and posted a Game Script of +19.8 along the way. Miami led 7-0, 20-0, and 37-0 after each of the first three quarters in a total annihilation of of the Chargers. Miami was more pass-happy, and San Diego more run-happy, than you might expect: as a result, despite the one-sided nature of the game, the Chargers only passed on 8.5% more plays than the Dolphins. The table below shows the Game Scripts data from each game in week 9: [continue reading…]

References

References
1 Based on the formula: 0.000005*GameScript^3 – 0.00003 * Game Script^2 – 0.0082 * Game Script +0.5875.
{ 0 comments }
Previous Posts