≡ Menu

Yesterday, I was a guest on the Wharton Moneyball show on SiriusXM Channel 111 (@BizRadio111), discussing the NFL draft. As always, it was a lot of fun, but the hosts threw me a curveball in the final seconds:

Which will produce the best quarterback from the 2015 Draft — the Jameis Winston/Marcus Mariota group, or the field?

Now I am quite familiar with the value of taking the field in these sort of bets. We are prone to being overconfident in our ability to predict things, especially when it comes to the NFL Draft. But I still said I’d take Winston/Mariota and leave you with everyone else, and be reasonably confident that I would end up with the draft’s best quarterback.

But am I right? How far down the quarterback slots do you have to go in the average draft to find the best QB? Would taking the top two generally be enough?

This is, of course, a question without a clear answer because there is no objective answer to the question “who was the best quarterback in the [__] Draft?” It’s much too early to grade the 2013 or 2014 drafts, and you will get no shortage of debate as to whether Andrew Luck or Russell Wilson is the best quarterback from the 2012 draft. In 2011, Cam Newton was the first overall pick, but Andy Dalton and Colin Kaepernick were the 5th and 6th quarterbacks taken.

In 2010, Sam Bradford does appear to have been the best quarterback from that draft, and should be remembered that way absent Colt McCoy, Tim Tebow, or Jimmy Clausen having a magical career turnaround.

In 2009, getting the top two quarterbacks would give you Matthew Stafford and Mark Sanchez, while the field would give you…. Josh Freeman and Curtis Painter.

In 2008, the top two quarterbacks were Matt Ryan and Joe Flacco. The book is not yet written on which one of them will be remembered as the best, but we can say that both will wind up being better than the field of Chad Henne, Matt Flynn, and Josh Johnson.

In 2007, the quarterback class was… ugly. The top guy will probably go down as one of Trent Edwards (most starts, most wins, most yards), Kevin Kolb (a positive TD/INT ratio!), or Drew Stanton (highest ANY/A but only 12 starts). Although for our purposes, we don’t need to finely split hairs. That’s because it’s clear the top quarterback was not JaMarcus Russell or Brady Quinn, the top two quarterbacks in that draft. Score one for the field.

Say what you want about Jay Cutler, but he was the clear top quarterback of 2006. In fact, he has thrown for more touchdowns than the rest of the class combined! As the 11th overall pick, he doesn’t quite meet the spirit of today’s question, but he is part of the field technically. That’s because Vince Young and Matt Leinart were the 3rd and 10th selections.

We need not spend much time on 2005. It was Aaron Rodgers, the second quarterback selected. Although Rodgers was much closer to the field (Jason Campbell was taken 25th overall, one pick after Rodgers) than being the first pick (Alex Smith).

For 2004, we can at least ignore the pretend Eli Manning/Philip Rivers debate, but that doesn’t help us when Ben Roethlisberger is in the mix, too. Call this one a push between top 2 and the field.

In 2003, it’s easy: it was Carson Palmer, the first overall pick. Nobody else comes close. Well, I guess that depends how you define class: Tony Romo went undrafted that year. Does the field include undrafted quarterbacks?

In 2002, not only is the answer David Garrard, but I think it’s Garrard by a wide margin. Garrard had a winning record, the most yards, the most TDs, and the best ANY/A out of the group with him, Patrick Ramsey, Josh McCown, and the first and third overall picks: David Carr and Joey Harrington. Score another one for the field.

In 2001, it’s Drew Brees, who was the second quarterback selected, albeit 31 picks after Michael Vick.

For 2000, let’s put that one down for the field.

1999 isn’t particularly close: Donovan McNabb made six Pro Bowls and started for 11 years; Daunte Culpepper is the runner up with three and five, respectively. And we know about 1998. So that’s two more for the top two. [continue reading…]

{ 13 comments }

Bryan Frye, owner and operator of the great site http://www.thegridfe.com/, is back for another guest post. You can also view all of Bryan’s guest posts at Football Perspective at this link, and follow him on twitter @LaverneusDingle.


Last week, I posted a quarterback performance metric that accounts for both passing and rushing. The base stat, Total Adjusted Yards per Play, is easy to comprehend and easy to figure out yourself with basic box score data. My original post only included performance that occurred during or after the 2002 season, because I don’t have spike and kneel data going back further than that. For the sake of consistency, I wanted to maintain the same parameters when calculating career values.

Before we get into the tables, I’d like to first briefly talk about what these numbers are and what they are not.

The formula, in case you forgot: [continue reading…]

{ 22 comments }

We all know the story of the 1991 Washington Redskins, one of the best football teams in NFL history. The team had an SRS of 16.6, the second highest since 1990 (to the ’07 Patriots), and that’s with the team losing a meaningless week 17 game.

So it always takes me a second when I look at the 1992 draft and see that Washington had the #4 pick in the draft. How did that happen?? Well, on Draft Day 1991, Washington was sitting with the 47th overall pick, the 20th selection of the second round, when the team found a taker. San Diego, desperate for … a guard … wanted to trade up to Michigan State’s Eric Moten. The Chargers had already picked George Thornton with the 36th pick and Eric Bieniemy with the 39th, but I guess the team was really, really in love with all three players. That’s because San Diego was willing to trade its 1992 first round pick in exchange for the 47th in the ’91 draft and a fifth rounder in the ’92 draft.

That trade, as it turned out, was really bad. San Diego, 6-10 in 1990, slipped to 4-12 in 1991. Four teams finished with fewer than four wins that year, and the tiebreakers landed San Diego in the middle of the three teams that finished 4-12. That meant the 6th overall selection was headed to D.C.

But Washington really coveted Howard, the Heisman Trophy winner. And, ironically enough given what Howard is mostly remembered for during his pro career, the biggest threat to dressing Howard in burgundy and gold was Green Bay, holders of the fifth pick. So Washington traded its 6th and 28th picks to Cincinnati to move up to 4th overall, while also getting to jump from 84 to 58 in the third round. Not a great trade according to my calculator (Washington was getting about 80 cents on the dollar for its picks), and the team only received about 87 cents on the dollar according to the traditional draft chart. But hey, how often can a defending Super Bowl champion add a top-five draft pick with a Heisman Trophy on his bookshelf?

That anecdote made me wonder: what other cases are there of really good teams holding high picks in the draft? Some would be by trade on draft day, of course, which probably doesn’t mean all that much. But many, presumably, would be a result of strategic planning earlier that worked out beautifully after a trading partner had a down year. And where does “Washington getting Howard” rank on this list? [continue reading…]

{ 6 comments }

As explained last year, the NFL’s collective bargaining agreement provides that most rookies sign four-year contracts. But teams were granted a club option for a fifth year for all players selected in the first round. Note that the option is only guaranteed for injury, however, so a team can exercise the option for 2012 first round picks and still release the player at the end of the 2015 season.

For players in the top ten, that fifth year salary is equal to an average of the top ten highest-paid players at their position from the prior year. For players selected with picks 11 through 32 — and for the second straight year, the number 11 pick has produced one of the most valuable players from the class — the fifth-year deal is worth an average of the salaries of the players with the 3rd through 25th highest salaries at their position.

The deadline for exercising the fifth-year option on 2012 first rounders is May 3rd. As a reminder, here is a review of the first round of the 2012 Draft: [continue reading…]

{ 1 comment }

Teams that select quarterbacks in the first round of the draft generally struggled in the passing department prior year, although not as much as you might think. On average, these teams [1]Since 1970, excluding quarterbacks taken in the supplemental draft, and including the 2015 Bucs. had a Relative ANY/A of -0.71, meaning those teams were 0.71 Adjusted Net Yards per Attempt below average. For reference, that’s right about where the 2014 Bears finished, and Chicago ranked 27th in the NFL in ANY/A last year.

There have been 91 teams that have selected a quarterback in the first round of the regular NFL Draft since 1970; the Tampa Bay Bucs are almost certainly going to be the 92nd. [2]Note: Kerry Collins, Tim Couch, and David Carr all were drafted by expansion teams in the first round. These examples are being deliberately excluded in this analysis. Every once in awhile, a good passing team will dip its toes into the quarterback waters and select a passer in the first round. Over this time period, there have been eight teams that had a RANY/A of at least +1.0 and then selected a quarterback in the draft.

The 2005 Packers are not that team. In ’04, Green Bay behind Brett Favre had a RANY/A of +1.42, which didn’t stop the franchise from drafting Aaron Rodgers in the first round in the following draft. But there are four other teams that had an even better RANY/A the year before selecting a quarterback in the first round during this period. Can you name the team with the best RANY/A? [continue reading…]

References

References
1 Since 1970, excluding quarterbacks taken in the supplemental draft, and including the 2015 Bucs.
2 Note: Kerry Collins, Tim Couch, and David Carr all were drafted by expansion teams in the first round. These examples are being deliberately excluded in this analysis.
{ 1 comment }

Read one profile of an offensive lineman projected to go in the top ten of the draft and you’ve read them all. You’ll hear that the player is “one of the safest picks in the draft,” a future Pro Bowler, and someone “you can pencil into your starting lineup for the next decade and forget about.”

We know that quarterbacks are tough to project coming out of college: it’s the most challenging position to evaluate, so we’re told, and quarterback production is so dependent on things like system and teammates. Wide receivers are notoriously risky, too, while running backs have become devalued in recent years.

So the default safe offensive pick high in the draft is at tackle. But that hasn’t been working out so well in recent years. Not only have there been a number of underachievers, but top picks have produced some of the league’s worst starting linemen.

  • In 2014, Greg Robinson was the second pick in the draft. The Rams tackle rated as one of the worst offensive tackles last season according to Pro Football Focus.
  • Taylor Lewan was the 11th pick to the Titans. He began the season on the bench, first starting in week 6 against the Jaguars. Lewan started for six games, but missed the remainder of the season with an ankle injury.
  • In 2013, offensive tackles went in three of the first four picks! Eric Fisher was the first overall pick in the draft but has been a disastrous pick. Fisher was terrible at right tackle as a rookie, and no better as a left tackle last season. The Chiefs have been successful over this time period, limiting the media blowback, but the pick has been horrendous by first overall selection standards.

[continue reading…]

{ 15 comments }

Colleges, The NFL Draft, and Heat Maps Since 1990

You may recall that last year, I looked at which college conferences dominate the NFL draft. Today, I want to look at which teams have dominated the draft since 1990.  And while there are no surprises, it’s fun to put numbers to what we all can sense.  Here’s what I did:

1) Using these draft values, assign a value to every pick in every draft from 1990 to 2014.

2) Calculate the amount of draft capital assigned to each college team by summing the values from each draft pick for each player from that college.

3) Create a heat map of the results, where red = more draft value and blue = less draft value.

Below are the top 75 schools in draft value created over the last 25 years.  You won’t be shocked to see that Florida State ranks 1st, with its players being worth 1,165 points of draft value over that span.  And with Jameis Winston headlining a host of Seminoles expected to be drafted this year, Florida State can probably comfortably settle into that top spot for the foreseeable future. [continue reading…]

{ 3 comments }

In week 5, Carolina has a bye.

In week 10, Arizona has a bye.

In week 11, San Francisco has a bye.

And in week 12, Pittsburgh has a bye.

And each of those teams, in the week following that bye, play the Seahawks. That gives Seattle a league-high four opponents in 2015 coming off of their bye week. In addition, the Seahawks play the Rams in week 16, when St. Louis will be coming off of ten days’ rest, having played on Thursday Night Football against the Bucs in week 15. You can view the full schedule here.

There is one saving grace for the Seahawks: all five games take place in the friendly confines of CenturyLink Field. Is that a coincidence? Probably not, although don’t expect Seahawks fans to give the NFL the benefit of the doubt here.

Playing four opponents off of a bye is a lot (tho not unheard of). In fact, only one other team has more than two such games, and that’s Washington. In weeks 5, 6, and 11, the Jets, Bucs, and Giants have their respective byes. And those teams are Washington’s opponents in weeks 6, 7, and 12 (the Jets game is on the road; the other two are home games).

In week 8, New England plays on Thursday Night Football, and week 12 is Thanksgiving, when the Dallas annually plays. The Patriots and Cowboys play Washington in weeks 9 and 13, respectively, giving New England and Dallas extra rest before their Washington game, too. [1]One might argue that in New England’s case, this is canceled out by the fact that Washington has a week 8 bye, so the Patriots get no advantage here. On the other hand, every team gets a bye, … Continue reading

Seattle and Washington are the only teams in 2015 that play five games against teams coming off of extra rest. On the other hand, we have Tampa Bay and Carolina. Neither the Bucs nor the Panthers play a single opponent coming off of extra rest in 2015! Carolina has its bye before a trip to Seattle and a Thursday game (Thanksgiving) before a trip to New Orleans, so the extra rest on the team side (rather than the opponent side) could come in handy. Tampa Bay travels to Washington after its bye and hosts the Bears after the Thursday night game against the Seahawks, and well, the Bucs could use all the help they can get. [continue reading…]

References

References
1 One might argue that in New England’s case, this is canceled out by the fact that Washington has a week 8 bye, so the Patriots get no advantage here. On the other hand, every team gets a bye, so if Washington’s one bye is neutralized, that appears to cancel out the, uh, canceling out.
{ 7 comments }

The 2015 NFL Schedule

The color-coded schedule is back!

Download the Excel file here

That Excel file contains full page and wallet-sized copies of the schedule, in both color and black and white. On the wallet-sized copies, the line between weeks 8 and 9 has been enlarged — that is where you want to fold the paper in half to put in your wallet.

iPhone page: http://www.footballperspective.com/wp-content/uploads/2015/04/2015-iphone-schedule1.png

Go to that page on your phone, then hit your power and home button at the same time to take a photo (or hit the button on the middle of the Safari browser and click ‘save image.’) The schedule has been formatted to fit an iPhone screen, so you can always carry the schedule with you.

Of course, you don’t need an iPhone or Excel to view the NFL schedule: [continue reading…]

{ 6 comments }

Bryan Frye, owner and operator of the great site www.thegridfe.com/, is back for another guest post. You can also view all of Bryan’s guest posts at Football Perspective at this link, and follow him on twitter @LaverneusDingle.


I spent a few weeks this offseason parsing out quarterback spike and kneel numbers from post-2002 play by play data. Chase published the findings, which I believe are a useful resource when trying to assess a QB’s stats. [1]For instance, 180 of Peyton Manning’s 303 rush attempts since 2002 have been kneels. He has lost 185 yard on those plays. Why in the world should we include those in his total output? … Continue reading Since I have the data available, I thought it would be good to use it.

Regular readers know Chase uses Adjusted Net Yards per pass Attempt as the primary stat for measuring quarterback performance. [2]It’s not perfect, but it’s at least easy to understand and calculate, and is not proprietary like DVOA, ESPN’s QBR, or PFF’s quarterback grades. I am going to do something similar, but I am going to incorporate rushing contribution as well. This is something Chase talked about doing awhile ago, but we didn’t have the kneel or spike data available. [3]For another thing Chase wrote on combining rushing and passing data — while (gasp) analyzing Tim Tebow — click here. I’ll call the end product Total Adjusted Yards per Play (TAY/P). The formula, for those curious: [4]I use 25 as the modifier for fumbles based on the idea that a QB fumble is worth roughly -50 yards, and fumble recovery is a 50/50 proposition.

[Yards + Touchdowns*20 – Interceptions*45 – Fumbles*25 + First Downs*9] / Plays, where

Yards = pass yards + rush yards – sack yards + yards lost on kneels
Touchdowns = pass touchdowns + rush touchdowns
First Downs = (pass first downs + rush first downs) – touchdowns
Plays = pass attempts + sacks + rush attempts – spikes – kneels [continue reading…]

References

References
1 For instance, 180 of Peyton Manning’s 303 rush attempts since 2002 have been kneels. He has lost 185 yard on those plays. Why in the world should we include those in his total output? Similarly, Ben Roethlisberger has spiked the ball 44 times, by far the most in the league since 2002. Why count those 44 “incomplete passes” in his completion rate?
2 It’s not perfect, but it’s at least easy to understand and calculate, and is not proprietary like DVOA, ESPN’s QBR, or PFF’s quarterback grades.
3 For another thing Chase wrote on combining rushing and passing data — while (gasp) analyzing Tim Tebow — click here.
4 I use 25 as the modifier for fumbles based on the idea that a QB fumble is worth roughly -50 yards, and fumble recovery is a 50/50 proposition.
{ 36 comments }

Which Defenses Are The Best At Recording Sacks?

In 2014, there were 17,879 pass attempts in the NFL, and another 1,212 dropbacks that ended up as quarterback sacks. Therefore, the 2014 NFL sack rate was 6.35%, as quarterbacks were sacked 1,212 times on 19,091 dropbacks.

The Buffalo Bills defense was fantastic in general last year, and even moreso with regards to sacks. Buffalo faced 613 opponent dropbacks last season; given the league average, we would “expect” the Bills to have recorded 38.9 sacks. [1]This is simply the product of 613 and 6.35%. In reality, Buffalo sacked opposing quarterbacks 54 times, or 15.1 more than “expected” last season. Only one other team, the Giants at +10.9, reached double digits in sacks over expectation.

The worst team, by a good measure, was Cincinnati. The Bengals faced 628 opponent dropbacks but recorded only 20 sacks! Using the league average as our guide, we would have expected Cincinnati to take down opposing passers about 39.9 times, which means the Bengals fell 19.9 sacks shy of expectation. Only Atlanta at -15.3 and Oakland at -13.6 were within shouting distance of the Bengals when it came to anemic pass rushing. [continue reading…]

References

References
1 This is simply the product of 613 and 6.35%.
{ 13 comments }

In terms of NFL averages, completion percentage is way up, interception rate is way down, pass attempts are way up, and the passing game has never been more valuable. We all know that. But sometimes, when everyone is zigging, a lone team might be better off zagging.

The question here is does that theory apply to trying to build an offense that revolves around a power running game? Defenses are looking for lighter and faster defensive ends and linebackers who can excel in pass coverage; just about every defense is taking linebackers off the field for defensive backs more than they did a decade ago. And defenses spend the majority of their practice reps focusing on stopping the pass, too. As defenses try to become faster, quicker, and lighter — and better against the pass — should a team try to respond by developing a power running game?

On one hand, it’s tempting to say of course that model could work: just look at the Seahawks and Cowboys. Seattle does have a dominant running game, of course; what the Seahawks did to the Giants last year is not safe for work. But Seattle also has Russell Wilson, perhaps the most valuable player in the league when you combine production, position, and salary. And the best defense in the NFL. So yes, the Seahawks are successful with a power running game, but that’s not really a model other teams can follow. And for all the team’s success, Seattle doesn’t even have a very good offensive line, which would seem to be the number one focus for a team that is trying to build a power running attack.

The team with the best offensive line in the NFL is probably in Dallas. But the Cowboys also have Tony Romo and Dez Bryant, so again, that’s not really a model capable of imitation.

I’m thinking about some of the teams in the middle class of the AFC — the Bills, the Jets, the Browns, the Texans — teams that are currently trying the all defense, no quarterback approach. Finding a quarterback is the most difficult thing there is to do in the NFL, and these four teams can attest to that. By trading for LeSean McCoy, it appears as though Buffalo is trying to do what this article implies, but there are two problems with that plan. One, the Bills have one of the worst offensive lines in the NFL, and two, McCoy is not necessarily the right guy to build a move-the-chains style of offense.

The Jets have invested a ton of money in their offensive line, courtesy of hitting on first round draft picks in 2006 with Nick Mangold and D’Brickashaw Ferguson, and spending to acquire mid-level free agents from Seattle (James Carpenter this year after Breno Giacomini last offseason). But the Jets offensive line is far from dominant, and the team isn’t really building around a power running game (the team’s top two tight ends are below-average blockers, and the Jets are investing more in wide receivers than running backs).

Houston is an interesting case, because the Texans led the NFL in rushing attempts last year. The Texans do have a very good run-blocking offensive line and Arian Foster, but it still feels like that’s just not enough. Houston’s efficiency numbers were harmed by giving carries to Alfred Blue — the Texans were 8-5 when Foster was active — but the team also doesn’t have much in the way of run blockers at tight end or fullback. [continue reading…]

{ 22 comments }

Quarterback Trivia: Going 1-2 in the NFL Draft

It seems likely that Florida State’s Jameis Winston will be the first pick in the 2015 Draft. And if he isn’t the first pick, that will probably be because Oregon’s Marcus Mariota went first overall.

It’s been three years since Andrew Luck and RG3 went 1-2 at the top of the draft; in fact, Luck is the last quarterback to go first overall, with Jadeveon Clowney and Eric Fisher being selected at the top of the last two drafts. The graph below shows what draft pick was used on the first (in blue) and second (in red) quarterbacks drafted in each year since 1967. [continue reading…]

{ 7 comments }

Brad Oremland is a longtime commenter and a fellow football historian. Brad is also a senior NFL writer at Sports Central. There are few who have given as much thought to the history of quarterbacks and quarterback ranking systems as Brad has over the years. Today, he’s contributed this guest post, but also is asking for your feedback. So please, help Brad and help us, in the comments, with your thoughts.


In recent weeks, Football Perspective has hosted some lively discussions about the greatest quarterbacks of all time. I like to think my approach to these issues is balanced, but it begins with statistics. I am always looking for ways to improve my analysis, and Chase has graciously invited me to post the results of my statistical rating system for quarterbacks.

This is not my personal list of the best quarterbacks in history. My subjective list differs, at time significantly, and I’ll post that next month. The list below is purely statistical, with three notable limitations:

1. It measures regular-season statistics only.

2. It covers the years 1946-2014. The modern quarterback position didn’t really exist prior to the mid 1940s.

2b. QBs who played prior to 1946 are omitted, even if they continued to play after the end of World War II. I don’t want a ranking that shows Sammy Baugh 65th, since it’s missing the first decade of his career. Players like Baugh, Sid Luckman, and Bob Waterfield are deliberately excluded.

3. Only seasons in the NFL, AFL, and AAFC count toward these rankings.

My purpose in posting this list is to ask for help. There are a lot of smart readers and commenters at this site, and I want you to critique my results.

I’m not showing my work yet: I’m not looking for a critique of my process, but of my results. Who’s too high? Who’s too low? You can identify individual players, or patterns. Wherever you think I messed up, I want to hear about it. Please keep in mind, though, that this is purely a stat-based list. It doesn’t represent my opinion, and it’s not slanted toward or against individual players or teams.

But just because this system is unbiased, that doesn’t make it perfect. It is definitely not perfect. But I’m comfortable making subjective adjustments, and that may create blind spots that prevent me from improving the formula. I’m asking you to evaluate the list below and judge where you think it is counterintuitive or inaccurate.

Are players from the ’70s overrated? Are contemporary players underrated? What about players from good teams, and players from bad teams? Are running QBs overrated? Underrated? How about game managers vs. downfield bombers? Is the system fair to them? Are one-year wonders overrated? Are compilers overrated? Players who threw a lot of TDs, a lot of interceptions, players who got sacked a lot? Wherever you think the system is off, I’m eager for your feedback.

Hopefully you find this list interesting, and you can expect a fuller explanation of my rankings in the future, but in the meantime, I appreciate your input and assistance. I included each player’s numerical score, which I realize isn’t in context yet, but it can give you a more precise idea than a simple ranking. Troy Aikman, Donovan McNabb, and Joe Namath, for instance, are effectively tied. Below are the top 125 QBs of the modern era, as ranked by my stat-based system: [continue reading…]

{ 72 comments }

The Safety Championship Belt, Part IV

On Monday, we began our journey through the history of the Safety Championship Belt — i.e., who held the title of best safety in each year from 1950 to 1970. And then on Tuesday, we revealed the winners from 1971 to 1990.  Yesterday brought us from 1991 to 2002. Today, the final twelve years.

2003: Roy Williams, Dallas Cowboys / Rodney Harrison, New England Patriots

Hey, for eight months, Buster Douglas was once the best boxer in the land, too. Williams became something of a punch line over time, and his five Pro Bowl selections only show how that honor can devolve into little more than a name recognition contest. But there once was a time when the Oklahoma Roy Williams was a dominant player, and that time was 2003. At his best, Williams was as feared as any safety in the league, a physical player who was essentially a linebacker playing in the defensive backfield. While Ray Lewis justifiably ran away with the Defensive Player of the Year award that season, Houston’s John McClain actually selected Williams as his top defender in all of football in 2003.

The ’03 Cowboys, you might forget, finished in the top four in most major categories on defense, including points allowed, yards allowed, first downs allowed, passing yards allowed, net yards per attempt allowed, rushing yards allowed, and yards per carry allowed. Here’s another way to put it: the team went 10-6 with Quincy Carter at quarterback.

For all the success he had with New England, whenever I think of Rodney Harrison my mind goes to what he and Junior Seau did on the ’98 Chargers. That team had the 3rd worst Relative ANY/A of any team in the last 20 years, [1]Ahead of only the ’05 49ers and ’10 Panthers. as Ryan Leaf and Craig Whelihan shared the quarterback duties. Seau and Harrison were seemingly the only thing keeping the Chargers from 0-16, and the duo guided San Diego to a first-place ranking in yards allowed.

That’s a small diversion to remind you about how good Harrison was on a bad team; in New England, we saw how valuable he could be on a good one.  Harrison had “only” three interceptions and three sacks in 2003, but he added two more interceptions in a dominant run during the playoffs.  Harrison was a first-team All-Pro selection by the AP and Dr. Z, and Peter King chose Harrison as his DPOY (King wasn’t on an island here; Rick Gosselin at the Dallas Morning News had Harrison as his runner-up to Lewis, and Ira Miller at the San Francisco Chronicle also picked Harrison as the best defender in football.)

Just about everyone who didn’t pick Williams or Harrison as the best safety in football in ’03 selected our next player, who clearly took over the title the following year. [continue reading…]

References

References
1 Ahead of only the ’05 49ers and ’10 Panthers.
{ 25 comments }

The Safety Championship Belt, Part III

On Monday, we began our journey through the history of the Safety Championship Belt — i.e., identifying who held the title of best safety in football in each year from 1950 to 1970. Yesterday, we continued from 1971 to 1990.  Today, we pick back up with a familiar name at the top of the list.

1991: Ronnie Lott, Los Angeles Raiders

In ’91, Lott moves to Los Angeles and donned the silver and black, the perfect look for one of the game’s most ferocious hitters.  The move revitalized his career, as Lott switched positions from free to strong safety.  The move worked, as he registered 93 tackles and a league-high 8 interceptions.  Four of the major services (Associated Press, Pro Football Writers, Pro Football Weekly, and Sporting News) named Lott a first-team All-Pro, but there were more honors in store for the 31-year-old.

The NFL’s Players Association named him Defensive Back of the Year, while the Washington Post and Newsday named him Comeback Player of the Year (while Lott was an All-Pro in ’90, he missed substantial time with knee injuries, and the 49ers allowed him to move on in part because they thought Lott was essentially done). He even finished tied for fourth with Derrick Thomas for the AP Defensive Player of the Year award (behind Pat Swilling, Seth Joyner, and Reggie White).  And Tom Ford at the Tampa Tribune named Lott the AFC Defensive Player of the Year.

One other safety also was named first-team All-Pro by four different organizations in 1991, but he would have to wait a year to earn the championship belt.

1992: Steve Atwater, Denver Broncos

Atwater and Lott were neck-and-neck for the title of best safety of ’91; the same could be said of Atwater and Buffalo’s Henry Jones in ’92.  But Atwater absolutely deserves a spot on our list somewhere, and by ’92, he had established himself as among the elite. If you want to take the longer view, the Broncos star safety was one of the game’s best defenders for a decade. [continue reading…]

{ 13 comments }

The Safety Championship Belt, Part II

Yesterday, we began our journey through the history of the Safety Championship Belt: i.e., the history of who was the titleholder of “Best Safety in Football” in each year from 1950 to 1970. Today, the next twenty years.

1971-1972: Bill Bradley, Philadelphia Eagles

At the University of Texas, Bradley was a running quarterback and punter before moving to defensive back. That position was a natural fit for Bradley, who would become the best safety in the NFL during the early ’70s.  In 1971, he led the NFL with 11 interceptions and 248 return yards, and was a first-team All-Pro choice by the Associated Press, Pro Football Writers, and Pro Football Weekly (the NEA selected Rick Volk and Paul Krause that year).  In ’72, Bradley’s nine interceptions led the league, and he was a unanimous first-team All-Pro selection (AP, PFW, PFW, and NEA).  Bradley would make the Pro Bowl in ’73, but his career arc had peaked in ’72.

1972 (Super Bowl): Jake Scott, Miami Dolphins

Scott was named the MVP of Super Bowl VII, capping the team’s 17-0 season. That’s worth a mention, particularly given the fact that Scott was a Pro Bowler every year from ’71 to ’75, and was named a first-team All-Pro by at least one organization in the last four of those years. He was probably the second or third best safety each of those seasons, so the Super Bowl MVP means he earns at least an honorable mention here. Scott was one of two safeties that made the AP All-Pro team in ’73, but that year, he wasn’t even the best safety on his own team. [continue reading…]

{ 1 comment }

The Safety Championship Belt, Part I

Bill Barnwell, among others, has written about “championship belts” at different positions, with the idea that the title of best player at position X can be passed around like a heavyweight belt. With the retirement of Troy Polamalu last week, there has been some discussion as to whether the Steelers is the greatest safety of all time (for some convincing arguments to the contrary, you can read Neil Paine’s take here).

As complicated as it is to evaluate quarterbacks, running backs, and wide receivers, that’s child’s play compared to comparing individual defensive players. Who is the greatest safety of all time? That’s an even more impossible question to answer, so I’m not going to even try. Instead, today and tomorrow, I’m going to look at who held the unofficial title of best safety in the league over the last 65 years. [continue reading…]

{ 9 comments }

Which Running Backs Played With Best Passing Games?

Payton played with some terrible passing attacks

Payton played with some terrible passing attacks

Adjusted Net Yards per Attempt is the best simple measure of quarterback play. ANY/A is defined as (Gross Passing Yards + 20 * PassTDs – 45 * INTs – Sack Yards Lost) divided by (Pass Attempts + Sacks).  Relative ANY/A, or RANY/A, is simply ANY/A minus league average.

I looked at the 100 players with the most rushing yards in football history.  Then, for each player, I calculated the average weighted RANY/A of the offenses he played on.  As usual, to come up with a career grade, I gave more weight to a player’s best seasons.  If a running back had 18% of his rushing yards come in one season, well his team’s RANY/A for that year was responsible for 18% of his career RANY/A grade.

For example, in 2001, the good Jake Plummer showed up for the Cardinals, and Arizona had a RANY/A of +0.53.  But since Thomas Jones rushed for only 380 yards that year — just 3.6% of his career total — only 3.6% of his career RANY/A is based on the +0.53.  Conversely, Jones set a career high with 1,402 rushing yards in ’09 for the Jets, representing 13.2% of his career total.  New York, behind a rookie Mark Sanchez, had a RANY/A of -1.69 that year, which matters a lot more when calculating Jones’ career grade.  In fact, Jones played with bad passing offenses for most of his career: as it turns out, among all players in the top 100, it’s Jones who played with the worst passing offenses in his career. [continue reading…]

{ 6 comments }

Weekend Trivia: Two All-Pro Safeties

The last three seasons, Seattle’s Earl Thomas has been named a first-team All-Pro by the Associated Press, among others.  In each of the last two years, his teammate at the safety position, Kam Chancellor, was a second-team honoree from the AP. Last year, Thomas was a runaway selection, while Chancellor was just two votes shy of being a first-team choice (which made up for the joke that was the AP second-team All-Pro safety situation from ’13).

Over the course of football history, there have been several organizations that have awarded All-Pro teams.  Principal among those have been the Associated Press, the Sporting News, the Newspaper Enterprise Association, the Pro Football Writers Association, and Pro Football Weekly.  Can you name the last time that any one of those organizations named two safeties from the same team as first-team All-Pros? [continue reading…]

{ 1 comment }

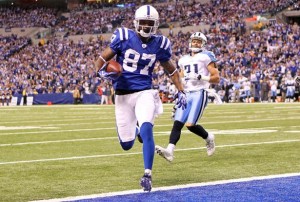
Andre Johnson’s Career in Houston

For a change, Colts fans won't hate this guy

For a change, Colts fans won’t hate this guy

In twelve seasons in Houston, Andre Johnson gained 13,597 receiving yards. Johnson was drafted by the Texans with the 3rd overall pick in 2003, and has played every game of his career with Houston. That will change in 2015, as Johnson signed with the Colts in March.

Does that sound like a lot of yards to you? Put it this way: only Jerry Rice and Marvin Harrison have ever gained more yards in a 12-year period with one team. And Johnson is as synonymous with Houston as any wide receiver has been with any team (including Reggie Wayne, who Johnson will be replacing in Indianapolis). [continue reading…]

{ 24 comments }

Last week, I looked at how many top carries needed to be removed in order to bring the best running backs below league average. Today, I want to do the same thing, but for quarterbacks, using pass attempts. [1]The same caveat from last time applies: because I used the play-by-play logs to conduct this exercise, there may be slight differences between the numbers in this table and the official numbers.

Aaron Rodgers averaged 7.7 net yards per attempt last year, the best rate in all of football. But as it turns out, he’s not the leader in this metric. You may be surprised to learn that one “only” needs to remove Rodgers’ 15 best pass plays to bring his NY/A average below the 2014 league average rate of 6.35. Meanwhile, you have to remove 19 of Peyton Manning’s top plays to bring his 7.5 NY/A average below league average. That’s because Rodgers’ ten best pass plays went for 642 yards, while Peyton Manning’s top ten pass completions gained 499 yards. [2]It also helped Manning’s cause that he had more dropbacks.

Regular readers know the drill; if you need more info on how to read the table, check last week’s post. The table below displays all quarterbacks who had at least 100 dropbacks last season and finished with a NY/A average above 6.35; the final column displays how many of each player’s top pass attempts need to be removed to bring his NY/A average below league average.

QuarterbackDBNetYdNY/ANum
Peyton Manning61446087.519
Ben Roethlisberger64247657.4215
Aaron Rodgers54742097.6915
Tony Romo46534657.4512
Drew Brees68747716.9410
Andrew Luck64345837.1310
Matt Ryan65844946.837
Philip Rivers60440856.766
Ryan Fitzpatrick33323897.176
Kirk Cousins21216407.746
Eli Manning62942276.724
Joe Flacco57438346.684
Brian Hoyer46331776.864
Mark Sanchez33022696.884
Tom Brady60539696.563
Andy Dalton50432826.512
Russell Wilson49232376.582
Drew Stanton25116456.552
Carson Palmer23315636.712
Nick Foles32120916.511
Zach Mettenberger19612746.51
Colt McCoy1459476.531

I’ll again leave the commentary to you guys.

References

References
1 The same caveat from last time applies: because I used the play-by-play logs to conduct this exercise, there may be slight differences between the numbers in this table and the official numbers.
2 It also helped Manning’s cause that he had more dropbacks.
{ 9 comments }

Cornerback Targets

According to Pro Football Focus, Richard Sherman was targeted just 65 times last season. That number is even more remarkably low when you consider that Sherman was in on 552 pass plays for the Seahawks last season.

We all know that Sherman generally sticks to the defense’s left side of the field; as a result, offenses tend to put their best wide receiver on the offense’s left, in order to avoid having to throw at Sherman. But that’s what I want to look at today: which cornerbacks are targeted the least?

Based on data from Pro Football Focus, the average cornerback was targeted on 16.4% of his pass snaps last year. That means an average cornerback would be expected to see about 90.5 targets on 552 snaps; in other words, Sherman saw 25.5 fewer targets than we would expect.

That’s the most impressive number of any cornerback in the league last year, with “impressive” here being a synonym for not being targeted. The second largest number belongs to Darrelle Revis, which perhaps isn’t much of a surprise, either. While with the Patriots, Revis was targeted 79 times on 606 pass snaps, or 20.4 fewer targets than we would expect.

The table below shows that data for each cornerback that was in on at least 175 snaps last season: [continue reading…]

{ 26 comments }

Running Back Heat Maps

Commenter Dan had a good suggestion: what if we create heat maps for each running back, with color-coding to depict how often a player gained at least X amount of yards?

Well, ask, and ye shall receive. I looked at all running backs with at least 100 carries in 2014, and then measured on what percent of their runs did each running back gain at least 0 yards, at least 1 yard, at least 2 yards, etc., up to 10 yards. I also calculated the percentage of runs that went for at least 15+ and at least 20+ yards. [continue reading…]

{ 18 comments }

On Friday, I asked the question: how many carries would we need to take away from DeMarco Murray in order to drop his YPC average to at or below league average?

Today, I want to look at it from the other side. How many of Trent Richardson’s worst carries would we need to erase to bring his YPC above league average? For this experiment, assume that we are sorting each running back’s carries in ascending order by yards gained. I’ll give you a moment to think about the answer.

[Final Jeopardy Music]

[Keep thinking…]

[Are you ready?]

[Your time is now up. Post your answer in the comments!] [continue reading…]

{ 12 comments }

Re-Post: Data Snooping

In lieu of weekend trivia, I am going to begin reposting old articles that I think people would still find relevant. If you’re a new reader, I hope you enjoy; if you’re an old-timer, my hunch is you still will get something new out of reading these again, just like I did. Today’s post is on Data Snooping, originally posted by me in June 2013.


Reggie Wayne dominates when seeing blue

Reggie Wayne dominates when seeing blue.

Over the last few years, the football analytics movement has made tremendous progress. There are many really smart people with access to a large amount of useful information who have helped pioneer the use of statistics and analytics in football. Major news organizations and NFL teams seem to be embracing this movement, too. Unfortunately, there are some less-than-desirable side effects as the reward for presenting “statistical information” seems larger than ever.

Data snooping is the catch-all term used to describe a misuse of data mining techniques. There are perfectly legitimate uses to data-mining, but data snooping is a big ‘no-no’ for the legitimate statistician. If the researcher does not formulate a hypothesis before looking at the data, but instead uses the data to suggest what the hypothesis should be, then he or she is data snooping. [continue reading…]

{ 0 comments }

On Tuesday, I looked at the fantastic rookie class of wide receivers that entered the NFL last year. But in that post, I focused on receiving yards; in fact, the group was even more incredible when it comes to receiving touchdowns.

Rookie wide receivers caught an astounding 92 touchdowns last year, highlighted by Odell Beckham and Mike Evans each snatching a dozen scores. In addition, Kelvin Benjamin (9), Martavis Bryant (8), Jordan Matthews (8), Sammy Watkins (6), Allen Hurns (6), John Brown (5) and Jarvis Landry (5) each caught at least five touchdowns.

Let’s put that number in perspective. Second-year wide receivers caught just 43 touchdowns last year, while third-year and fourth-year wideouts each caught 59 touchdowns. Players from the class of 2010 caught 72, the second highest amount of any class last year. Take a look: [continue reading…]

{ 2 comments }

DeMarco, how many Cowboys fans still think you're great?

DeMarco, how many Cowboys fans still think you’re great?

DeMarco Murray was really, really good last year. He rushed 393 times for 1,845 yards, producing a strong 4.69 YPC average. Jamaal Charles was also really, really good — he averaged 5.07 yards per rush last year, albeit on “only” 205 carries. The NFL average yards gained per rush was 4.16 last season, down a tick from in previous years. But that brings us to the question of the day:

Suppose we sort each running back’s carries in descending order by yards gained. How many carries would we need to take away from Murray in order to drop his YPC average to at or below league average? Same question for Charles. I’ll give you a moment to think about this one.

[Final Jeopardy Music]

[Keep thinking…]

[Are you ready?]

[Your time is now up. Post your answer in the comments!]
[continue reading…]

{ 50 comments }

Since 1970, there have been just nine times where two teams agreed on a trade knowing that it was for the first overall draft pick. Will a trade up for Jameis Winston make number ten? Let’s go in reverse chronological order and look at every instance since the AFL-NFL merger when the first overall pick was traded:

2004: Giants trade up to acquire Eli Manning

New York trades the rights to Philip Rivers (the fourth pick), the first pick in the third round (Nate Kaeding), a 2005 first round pick (Shawne Merriman) and a 2005 fifth round pick (Jerome Collins) to San Diego for the rights to Manning

This one technically wouldn’t count as a trade of the first overall pick, because San Diego selected Manning before trading him. But I am counting it because it this meets the spirit of the question. Prior to the draft, the Chargers and Giants had been in a standoff on compensation, and San Diego upped the ante by actually selecting Manning. New York gave up an enormous haul to move up three spots in the draft, and the Chargers then hit on the additional picks they received (Merriman went to three Pro Bowls; Kaeding went to two). The Chargers flipped the pick that became Collins for Roman Oben, who started 24 games at tackle for San Diego. On top of that, many will view Rivers as the best player in the deal, but this is one of the few trades where I suspect each team is happy with the trade.

2001: Atlanta trades up to select Michael Vick.

Falcons trade the 5th pick (LaDainian Tomlinson), third round pick (Tay Cody), and 2002 second round pick (Reche Caldwell) to San Diego for the first overall pick

At the time, it felt like an enormous haul was being given to acquire Vick, but this is actually less compensation than San Diego would get from the Giants three years later. Vick obviously never reached his full potential in Atlanta, while the Chargers were able to acquire the best running back of his generation. Oh, and they did pretty well when they snagged a quarterback at the top of the second round, too.

1997: St. Louis trades up to select Orlando Pace

Rams trade the 6th pick, third round pick (Dan Neil), fourth round pick (Terry Day), and seventh round pick (Koy Detmer) to New York for the first overall pick

The Jets had the first pick for the second year in a row, going 1-15 a year after selecting Keyshawn Johnson. Things would have turned out much differently if a certain Tennessee quarterback had decided to declare for the draft after his junior year, but as of this time, the Manning family was not yet focused on being in New York.

With the luster on the first pick gone, the Jets — now under the management of Bill Parcells — chose to trade down and rebuild. The Rams didn’t have to offer all that much to move up six spots in the draft, as the top six or so players were all generally considered to be in the same tier. Things worked out nicely for the Rams, as the team went to two Super Bowls during Pace’s standout career, winning one in 1999.

The Jets then traded down from 6th to 8th, acquiring a fourth round pick (Leon Johnson) from the Bucs in the process. The Jets finally selected James Farrior, who a role player but not a star during his Jets career (before a decade of strong play in Pittsburgh). Tampa Bay sent the 6th pick to Seattle in exchange for the 12th pick (Warrick Dunn) and the third pick in the third round (Frank Middleton); while the Bucs hits on those picks, the Seahawks were the big winners, trading up to select Walter Jones.

1995: Cincinnati trades up to select Ki-Jana Carter

Bengals trade the 5th pick (Kerry Collins) and the 36th pick (Shawn King) to Carolina for the first overall pick

Cincinnati had the 1st pick in 1994 and used it on Dan Wilkinson; the Bengals then went 3-13. But because the Panthers and Jaguars were entering the NFL, that only entitled Cincinnati to the 5th pick.  The Bengals running game was putrid in ’94, with Derrick Fenner, Steve Broussard, and Harold Green combining for just 1,094 yards and 4 touchdowns on 311 carries (3.5 YPC) as part of a three-headed attack.

Carter rushed 198 times for 1,539 yards and 23 touchdowns during his junior year at Penn State, culminating in a 21-carry, 156-yard, 3-touchdown performance in a Rose Bowl win over Oregon, capping a perfect 11-0 season for the Nittany Lions. Carter’s next game would be much worse. On the third carry of his first preseason game, he tore his ACL, causing him to miss the entire 1995 season.

He struggled in 1996, the days of when a torn ACL was really a two-year injury. In the third game of the ’97 season, he rushed 13 times for 104 yards, but tore his rotator cuff. He would later miss nearly all of ’98 with a broken wrist, while ’99 was lost with a dislocated right kneecap.

The trade obviously didn’t work out for Cincinnati, although in an odd twist, he actually lasted longer in Cincinnati than Collins did with the Panthers. Carolina was happy to grab Carter’s teammate with the 5th pick in the draft, but an immature Collins wore out his welcome in Carolina. Of course, he would turn things around, and wind up playing for 17 seasons. King, a defensive end from LSU, started just ten games in his four year career, and only two of those starts came with the Panthers. This was a trade with no winners.

1991: Dallas trades up for Russell Maryland

Cowboys trade Ron Francis, David Howard, Eugene Lockhart, the 11th pick (Pat Harlow) and a second round pick (Jerome Henderson) to the Patriots for the first overall pick

The Cowboys under Jimmy Johnson were not shy about taking Hurricanes that Johnson had coached at Miami.  Here, Dallas sent the 11th pick and a bunch of spare parts [1]Francis never played for the Patriots, Howard started 15 games over two years, and Lockhart started 21 games in two seasons. to move up ten slots, as the Patriots were desperate to retool their roster. Maryland had a good but not great career: he played for ten years, mostly as a starter, and was a force in the middle.   But he was rarely dominant, and never had more than 4.5 sacks in a single season. Basically everything the early ’90s Patriots was a failure, this trade included.  Harlow was a nondescript starting tackle for four years in New England, while Henderson made just ten starts with the Patriots.

The other part of the story here concerned Rocket Ismail, the Notre Dame star receiver who was the consensus best player in the draft. That is, until Ismail decided to head to the CFL for more money. The Cowboys thought they might convince Ismail to come to Dallas instead of New England, but after the Toronto Argonauts offered more money, Dallas settled on Maryland. [continue reading…]

References

References
1 Francis never played for the Patriots, Howard started 15 games over two years, and Lockhart started 21 games in two seasons.
{ 13 comments }

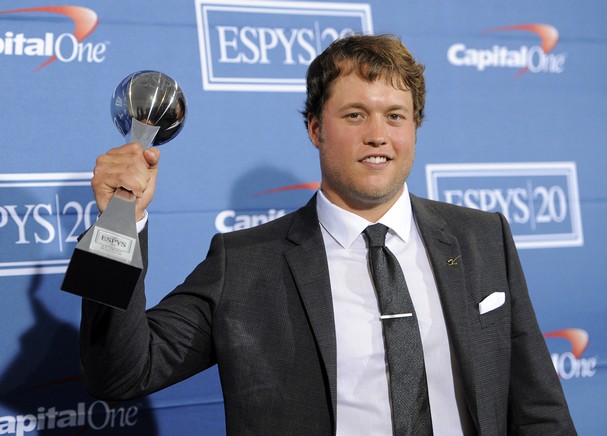
Stafford wins the prize for best quarterback drafted by the Lions since 2000

Stafford wins the prize for best quarterback drafted by the Lions since 2000

There are some teams — the Lions, Jaguars, and Raiders come to mind — that have spent most of the last 15 years looking for their next quarterback of the future. And others that seem to ignore the position in the draft, either because they found a Tom Brady or Tony Romo in a haystack (to go along with some Drew Bledsoe) or organizational indifference to drafting quarterbacks (Chiefs, Saints).

Today, I want to quantify those numbers. At the top of every page at Football Perspective is a link to the Draft Pick Value Calculator, based on the values derived here and shown here. If we assign each draft pick its proper value, and then sum the values used to select quarterbacks by each team over the last 15 years, we can see which teams have devoted the most draft capital on quarterbacks.

Here’s how to read the chart below. Detroit leads the way in draft capital spent. The Lions have only selected five quarterbacks, but spent 78.4 points of Draft Value on passers. That averages out to 15.68 points of draft value spent on each quarterback, the second highest (to Jacksonville) among the 32 teams. The far right column displays each quarterback selected in the draft since 2000. [continue reading…]

{ 10 comments }