≡ Menu

AV-Adjusted Team Age (Offense) from 2012-2015

Background:

In 2012, the Jaguars went 2-14 with an offense centered around Blaine Gabbert/Chad Henne, Maurice Jones-Drew, Cecil Shorts, and Justin Blackmon. Since then, the team has been rebuilt, and gotten better and younger. Among offensive players, only Marcedes Lewis was on the team during each of the last four years. I’ll have more on the Jaguars tomorrow, but given the way the Jets have moved from young and bad to old and good, I think that’s the more interesting team to analyze today.

Here’s how to read the table below. In 2012, the Jets offense had an age-adjusted AV of 26.9; that dropped to 26.4 in 2013, then rose to 27.5 in 2014 and up to a league-high 29.2 last season. That’s an average of 27.5, but more interesting (to me) is the variance of 1.1 years. [continue reading…]

{ 0 comments }

AV-Adjusted Team Age (Defense) from 2012-2015

Part of the last non-awful Bears defense

Part of the last non-awful Bears defense

Background:

I thought it would be fun to do a quick checkdown and look at the AV-Adjusted team age for each defenses over the last four years. Here’s how to read the table below, using the Bears as an example. In 2012, Chicago’s average age on defense was 29; in 2013, it was 27.7, then 27.5, and finally, 26.1 last season. That means the Bears average age has had a variance of 1.1 years, the second largest in the data set behind only San Diego. [continue reading…]

{ 2 comments }

2015 AV-Adjusted Team Age

In each of the last four years, I’ve presented the AV-adjusted age of each roster in the NFL. Measuring team age in the NFL is tricky. You don’t want to calculate the average age of a 53-man roster and call that the “team age” because the age of a team’s starters is much more relevant than the age of a team’s reserves. The average age of a team’s starting lineup isn’t perfect, either. The age of the quarterback and key offensive and defensive players should count for more than the age of a less relevant starter. Ideally, you want to calculate a team’s average age by placing greater weight on the team’s most relevant players.

My solution has been to use the Approximate Value numbers from Pro-Football-Reference.com.  The table below shows the average age of each team, along with its average AV-adjusted age of the offense and defense. For the second year in a row, the Jaguars and Rams were the two youngest teams in the NFL; this year, though, the team formerly known as St. Louis took the top spot.

The average AV-adjusted team age last season was 27.1 years; the Rams (25.6) and Jaguars (25.8) were the only teams below 26, while the Jets (28.2) and Colts (28.6) were the only teams above 28 years. Here’s how to read the table below, using the St. Louis line: the Rams were the youngest team in the NFL in 2015, with an average age of 25.6 years as of September 1, 2015. The team’s offense had an AV-adjusted average age of 25.0, the youngest in the NFL, while the defense was at 26.0, the second-youngest. [continue reading…]

{ 2 comments }

Bob Ford, a longtime fan of Pro-Football-Reference and Football Perspective, has contributed a 2-part guest post on Yards Per Carry Leaders. Bob is the owner and founder of GOATbacks.com, which looks at the greatest running backs of all time. Thanks to Bob for yesterday’s and today’s articles!


Yesterday, I looked at the YPC leaders for the 46 seasons since the merger was completed, 1970-2015 at the 100/120/180-carry cutoffs. Today, a look at the YPC leaders since 1970 at three higher thresholds. [continue reading…]

{ 17 comments }

Bob Ford, a longtime fan of Pro-Football-Reference and Football Perspective, has contributed a 2-part guest post on Yards Per Carry Leaders. Bob is the owner and founder of GOATbacks.com, which looks at the greatest running backs of all time. Thanks to Bob for today’s (and tomorrow’s) article!


I’ve been curious about YPC leaders over the years, particularly as they’re sorted through increasing numbers of carries. Over the next two days, I will look at the YPC leaders using six different carry minimum thresholds: 100, 120, and 150 today, and 180, 220, and 280 carries tomorrow. These cutoffs weren’t arrived at in an analytically rigorous way, just through instinct and personal judgment. I ran a number of different carry thresholds and simply tried to keep my statistical eyes peeled; in my view, these are at least 6 of the minimums where interesting changes seemed to emerge.

As a general rule, though not an absolute one, I’m in the camp that regards YPC as, at best, a questionable stat when it comes to assessing skill and performance, and at worst a misleading and even bunkum stat, to borrow a term from Chase and the crew over at Intentional Rounding. Don’t get me wrong, I’m not suggesting YPC is useless. In fact in some narrow contexts I think it’s even key. But I think it’s woefully overused and over relied on, and I do regard it with suspicion when it comes to assessing rushing and running back value and effectiveness, particularly in “real-game” situations. I think the same holds for mobile quarterbacks, too.

I decided to look at YPC leaders for the 46 seasons since the merger was completed, 1970-2015. Again, no special reason, just to make things more manageable. This would probably get really interesting if we included all pre-merger seasons, but I didn’t do that here. If anyone does, kudos. At any rate, here are the YPC leaders since 1970, sorted at 6 different carry thresholds. [continue reading…]

{ 1 comment }

The only thing stable in Cleveland

The only thing stable in Cleveland

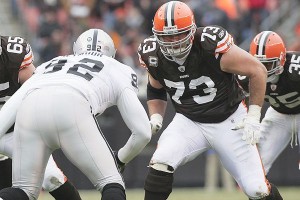
With the Cleveland Browns undergoing an overhaul this offseason, there are some rumors that offensive tackle Joe Thomas could be traded. If that’s the case, it could be classified as a charity trade, as arguably no great player has been stuck on such a bad organization as Thomas.

The third overall pick in the 2007 draft, Thomas has never missed a single game. During that time, he has made the Pro Bowl every season, while Cleveland has won just 47 of 144 games. That gives Thomas a career winning percentage of 0.326, and since he has made the Pro Bowl each year, he has the same career winning percentage in each Pro Bowl season.

There have been 78 players to make 9+ Pro Bowls. Among that group, Thomas has the lowest career winning percentage during Pro Bowl seasons. But the shocking thing is that it’s not even close: the 2nd-worst winning percentage belongs to the late Junior Seau, but his teams won 10% more games than Thomas’ Browns! [continue reading…]

{ 3 comments }

Jets general manager Mike Maccagnan was hired a year ago and given the enviable position of a lot of cap space. He used that to sign Darrelle Revis to a blockbuster deal, but he also made a couple of smart trades, adding Brandon Marshall and Ryan Fitzpatrick for a 2015 5th and 2016 6th round pick, respectively (while also getting back a 7th round pick later traded for Zac Stacy). There were six veterans who switched teams between 2014 and 2015 that wound up producing double digit points of AV last year; half of those were acquired by the Jets.

The table below shows the 44 veterans who changed teams in 2015 and produced at least 7 points of AV: And, courtesy of Jason Fitzgerald of OverTheCap, the table has been revised to include each player’s 2015 cap hit and $/AV: [continue reading…]

{ 1 comment }

Yesterday, the NFL approved a one-year rule to kickoffs to change the spot of the snap after a touchback to the 25-yard line. Last year, 56% of all kickoffs were not returned, and the average starting field position following kickoffs was heavily impacted by the 2011 rule change that moved kickoffs from the 30 to the 35 yard line:

kickoff fp

This change goes in the other direction, albeit with competing interests. On one hand, this provides a significant incentive for kickoff returners to take a knee. Many kickoffs are boomed several yards into the end zone; at this point, the odds are pretty low that an average return five yards deep will make it out ahead of the 25-yard line. [continue reading…]

{ 7 comments }

Guest Post: Putting Lipstick on the YPC pig

Brian Malone, a writer for dynastyleaguefootball.com, has put together a great guest post today. You can follow him on Twitter at @julesdynasty. Thanks to Brian for today’s article!


Putting lipstick on the YPC pig

We all know that that yards per carry is, as Danny Tuccitto puts it, nearly a “bunkum stat” in terms of predictive power.   Even as a descriptive tool, YPC is tolerable but unsatisfying.  Matt Forte (4.12) and Chris Johnson (4.15) had nearly identical YPC in 2015, but their paths to these numbers were notably different.  Forte rarely got stuffed behind the line of scrimmage, and he was well above average at posting four-yard gains.  Johnson, in contrast, was a home run hitter, padding his YPC with runs longer than 20 yards.

Painting a better picture

We could supplement YPC with the standard deviation of a player’s runs.  Or, as Jeff Levy suggests, we could include confidence intervals to define a player’s “true” YPC.  Both supplements add useful information, but neither smacks the reader in the face with the contrast between Forte and Johnson.  For that, we may need a visual. [continue reading…]

{ 16 comments }

That’s pretty darn impressive. Going back to December of his rookie season in 2011, Julio Jones has gained 5,703 yards in his last 57 games. That’s not a record, but he is just the fourth player since 1960 to do that. You can probably guess who the first four were: in fact, I think most of you would be able to name the top 3 if you take a minute and think about it. So take that minute.

……….

……….

………. [continue reading…]

{ 6 comments }

Farewell to one of the greats

Farewell to one of the greats

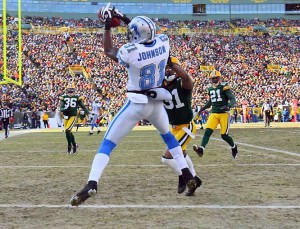
Detroit Lions superstar wide receiver Calvin Johnson has likely retired. He had a pretty incredible six-year peak: Megatron gained 8,548 receiving yards in his last six years, the most by any player during their age 25-30 seasons. I don’t think there’s much of a debate that Johnson is a Hall of Famer, although I do think he’s not quite an inner circle member of the Hall.

The big reason for that is Johnson’s numbers have always been inflated by playing on a pass-happy team.  I’ve looked at this before, but (a) those numbers are now two years stale and (b) I want to use a different methodology today. So here’s what I did:

1) Calculate the number of pass attempts per game for each team in every season.

2) For the top 200 players, I then calculated the number of career games for that player.

3) Then, in each season, weight the number of team pass attempts per game by the percentage of games that player played relative to his entire career. For example, Johnson played 11.9% of his career games in 2012, and that year, the Lions threw 46.3 pass attempts per game. Therefore, for Johnson’s career, 46.3 pass attempts per game will be given a weight of 11.9%. Do this for every season of each player’s career, and you will derive the average pass attempts per game for that player. [continue reading…]

{ 20 comments }

In 2015, the average points differential was just 11.06 points per game.  That may not mean much in the abstract, but it’s the lowest in 20 years.  Take a look:

pt diff 1950

What was driving the close games this year?  It’s mostly because the “losing teams” wound up scoring more points, but the average points scored by the winning team did dip slightly in 2015, too: [continue reading…]

{ 4 comments }

Over the last week or so, I have been analyzing the top performers at the combine in various drills. Today, I want to put it all together. Let’s use Northwestern fullback Dan Vitale as our example.

In the 40-yard dash, Vitale was expected to run it in 4.76 seconds, but instead ran it in 4.6 seconds. That gave him the 28th best score. Put another way, his 40-yard time was 1.18 standard deviations better than the average score, after adjusting for weight.

In the bench press, he was even better. putting up 30 reps, 10.4 more than would be expected given his height and weight. His Z-Score in that event — i.e., how many standard deviations above average he scored — was 2.56.

You might not think of a fullback as dominating in the Vertical Jump, but Vitale excelled here, too. Given his height and weight, he would have been expected to jump 32.6 inches. Instead, he bested that by 5.9 inches, making him the 8th biggest overacheiver in this drill, and 1.97 standard deviations above average.

Vitale was not quite as good in the Broad Jump, but he still ranked 31st by outjumping his projected by 7.8 inches and 1.29 standard deviations.

In the Short Shuttle, Vitale was once again very good, posting the 12th-best adjusted time, which gave him a Z-score of 1.71.

Finally, the 3-Cone drill was his worst, as he finished 62nd and just 0.59 standard deviations above average. Still, add it up, and Vitale was 9.30 standard deviations above average in all of the drills. [continue reading…]

{ 4 comments }

Checkdowns: Footballguys.com Free Agent Tracker

At Footballguys.com, there is a very useful tool to help track free agents. The FBG Free Agent Tracker, which is always being updated, let’s you know the status of all the free agents, which is particularly useful this time of year. In addition, Footballguys assigns an importance rating of 1-5 for each player. That’s subjective, of course, but it’s better than nothing (another great option is what Bill Barnwell is doing over at ESPN).

And while free agency isn’t over, I thought it would be useful to “check in” on how teams are doing. According to Footballguys, the Bears have added the most value so far this season, courtesy of adding Jerrell Freeman (linebacker, Colts), Danny Trevathan (linebacker, Broncos), Akiem Hicks (defensive end, Patriots), and Bobby Massie (offensive tackle, Cardinals). Meanwhile, the Dolphins have lost the most, with Lamar Miller (running back, Texans), Olivier Vernon (defensive end, Giants), Derrick Shelby (defensive end, Falcons), Rishard Matthews (wide receiver, Titans), Brent Grimes (cornerback, Bucs), and Brice McCain (cornerback, Titans) all moving on.

On a net basis, the most-improved team this free agency period? That would be the Jacksonville Jaguars, who are only down Sam Young (offensive tackle, Dolphins) and up Tashaun Gipson (safety, Cleveland), Chris Ivory (running back, Jets), Prince Amukamara (cornerback, Giants), Brad Nortman (punter, Panthers), and Mackenzy Bernadeau (center, Cowboys). The table below shows the amount of points gained, lost, and net for each team so far: [continue reading…]

{ 4 comments }

Raiders linebacker Ben Heeney had a nondescript rookie season after being drafted by Oakland in the fifth round of the 2015 Draft. But the Kansas linebacker dominated the 3-cone drill at the 2015 Combine.

As a reminder, here’s a description of the 3-cone drill from NFL.com.

The 3 cone drill tests an athlete’s ability to change directions at a high speed. Three cones in an L-shape. He starts from the starting line, goes 5 yards to the first cone and back. Then, he turns, runs around the second cone, runs a weave around the third cone, which is the high point of the L, changes directions, comes back around that second cone and finishes.

In general, this drill favors taller (i.e., fewer strides) and lighter players. The best-fit formula to project a 3-cone score from the 2016 combine was 7.23 – 0.028 * Height (Inches) + 0.0087 * Weight (Pounds). And Ohio State defensive end Joey Bosa, who some believe is the best player in the draft, absolutely dominated this drill. Despite weighing 269 pounds, Bosa completed the drill in 6.89 seconds, the 26th-fastest time out of 217 participants. He was the only player at even 250+ pounds to finish in under 6.9 seconds.

But Bosa only had the second best rating in this drill. And frankly, it wasn’t even close. Stanford wide receiver Devon Cajuste is 234 pounds — that’s pretty big for a wide receiver — and he ran the single fastest 3-cone drill at the combine. That’s not the fastest among players that weigh 200+ pounds, or even wide receivers. It’s the fastest, period, and by 0.09 seconds. Cajuste may profile as a hybrid wide receiver/tight end, but this sort of shiftiness adds intrigue to his ability to play in the slot. According to Josh Norris, Cajuste — again, ignoring that he weighs 234 pounds! — ran the 5th best 3 cone time by any wide receiver in the last decade. [continue reading…]

{ 1 comment }

The 20-yard shuttle is the Combine’s approach to measure an athlete’s agility, short-range explosiveness, and lateral quickness. Here’s the description from NFL.com:

The athlete starts in the three-point stance, explodes out 5 yards to his right, touches the line, goes back 10 yards to his left, left hand touches the line, pivot, and he turns 5 more yards and finishes.

As you can imagine, heavier players fare much worse in this metric, and shorter players have a slight advantage, too. The best-fit formula from the 2016 Combine using height and weight as inputs is: 4.00 -0.012 * Height (Inches) + 0.005 * Weight (Pounds). In other words, for every 20 pounds a player weighs, he would be expected to take an extra tenth of a second to complete the drill. UCLA center Jake Brendel is 6’4 and weighs 303 pounds; that’s not exactly the formula for dominating this drill. But he wound up completing the workout in just 4.27 seconds, the exact same time it took Notre Dame wideout Will Fuller (6’0, 186 pounds). Based on Brendel’s profile, we would have projected him to take an extra 0.40 seconds to finish, which means he is your 2016 Short Shuttle champion. [continue reading…]

{ 1 comment }

Ohio State outside linebacker Darron Lee had a productive collegiate career, but really raised eyes at the 2016 Combine. Lee had the 6th best weight-adjusted 40-yard time, and then added to that with an incredible performance in the broad jump.

This drill is biased in favor of taller and lighter players; as a result, the best-fit formula to project the Broad jump at the 2016 combine was 119.2 + 0.49 * Height (Inches) – 0.164 * Weight (Pounds). Alabama’s Derrick Henry, who had the 5th best weight-adjusted 40-yard time, had the 2nd-best broad jump. [continue reading…]

{ 0 comments }

Virginia Tech defense end Dadi Nicolas is going to have to switch positions in the pros, but there’s no doubting his athleticism. At just 235 pounds, Nicolas projects as a 3-4 outside linebacker/situational pass rusher in the NFL.

At the NFL Combine, seven players jumped over 40 inches in the vertical jump drill. The first six of those players weighed 188, 194, 194, 202, 209, 209 pounds. The seventh was Nicolas, who weighed 235 pounds: that’s light for a defensive end, but really, really heavy for a guy who has a 41″ vertical.

The best-fit formula to project vertical jumps at the 2016 NFL combine was 46.96 – 0.06 * Weight (Pounds). So Nicolas, at 235, would be projected to jump 32.8 inches. That means the Hokies star, who led the ACC in tackles for loss in 2014, outjumped expectations by 8.2 inches, the most of any player in Indianapolis. [continue reading…]

{ 1 comment }

Last week, I looked at weight-adjusted 40-yard dash times from the NFL Combine. Today, I want to analyze the bench press.  Last year, Clemson/Atlanta Falcon Vic Beasley was your bench press champion, using a formula involving expected bench press reps based on a player’s height and weight.  This year, that honor belongs to Nebraska fullback Andy Janovich.  The fullback position may be of declining importance in the modern NFL, but this can only help Janovich’s stock.

The best-fit formula to project bench press reps for the 2016 Combine was:

37.97  -0.65 * Height (Inches) + 0.119 * Weight (Pounds)

By this formula, the 73-inch, 238-pound Janovich “should” have benched 225 pounds 18.8 times; instead, he put up 30 reps.  Arizona State guard Christian Westerman led the way with 34 reps, but at 6’3, 317, he only produced 9.3 more reps than expected.

Thanks to NFLCombineResults for the raw data. [continue reading…]

{ 2 comments }

Johnny Manziel And First Round Quarterback Busts

Worse than Tim Couch

Worse than Tim Couch

Johnny Manziel was drafted by Cleveland with the 22nd pick in the 2014 NFL Draft. That wasn’t a very long time ago, but Manziel was released yesterday after two tumultuous seasons. He went 2-6 as a starter with more off-the-field headlines than wins (or, probably, starts). There were 50 quarterbacks who threw 200 passes since 2014, and Manziel ranks 47th among those players in Adjusted Net Yards per Attempt.

Let’s ignore Eli Manning and Philip Rivers, who were traded for each other the day both players were drafted. And Kelly Stouffer, Jim Everett, and John Elway, who couldn’t work out contracts with the teams that drafted them (Cardinals, Oilers, Colts) and instead began their playing careers with other teams (Seahawks, Rams, and Broncos). That leaves 95 quarterbacks drafted in the first round since the common draft began in 1967. [1]Excluding quarterbacks drafted in the Supplemental Draft.

Manziel became the 9th of those 95 quarterbacks to finish with zero, one, or two wins with the team that drafted him. [continue reading…]

References

References
1 Excluding quarterbacks drafted in the Supplemental Draft.
{ 20 comments }

As I did the last couple of years, I used the raw NFL combine data and adjusted them various metrics.  With respect to the 40-yard dash, the only adjustment I’ve made is for weight, as no other variable (e.g., height) impacts a player’s 40 time quite like weight. The best-fit formula to predict 40-yard dash time during the 2016 combine was 3.38 + 0.00577 x weight.

Oklahoma defensive end Charles Tapper weighed in at 271 pounds, which would “project” to a 40-yard time of 4.94.  Tapper, though, ran the 40 in a blistering 4.59 seconds.  That’s not quite Jadeveon Clowney (266, 4.53), but it’s comparable to what Bud Dupree (269, 4.56) did last year. Tapper ran the top weight-adjusted 40-yard dash time of 2016, with Todd Gurley’s former running back mate, Keith Marshall, the runner up. Thanks to NFLCombineResults for the raw data. [continue reading…]

{ 1 comment }

The Jets Sign Matt Forte

The Jets lost Chris Ivory to Jacksonville, but may have improved the offense by going in the other direction and adding Matt Forte. Ivory is one of the most one-dimensional running backs in recent memory: he has the 4th most rushing yards of any runner since 1990 who has 10x as many rushing yards as receiving yards. Forte, meanwhile, is one of just 12 players in history in the 4,000/8,000 club, and there’s a good chance he joins Tiki Barber, Marshall Faulk, and Marcus Allen as the only members of the 10,000/5,000 club before he retires.

The move makes a lot of sense for a Jets team that had the most two-dimensional passing attack in the NFL last year. Brandon Marshall and Eric Decker were outstanding and historically great at scoring touchdowns, but they combined for 61% of all Jets receiving yards last year. That was the most in the NFL in 2015, and the 8th highest rate since 2002 among teams with at least 4,000 receiving yards. [continue reading…]

{ 5 comments }

NFL Team Job Posting

Given the smart minds that frequent this site, I wanted to pass along a job opening. An NFL team is looking to hire a full-time analyst for football operations (scouting and coaching). The candidate would need to relocate. The ideal candidate would be someone who has:

    Experience in the field (e.g. written a sports analytics paper, authored a blog, worked for a team, created a website, etc). Not necessarily football.
    Majored in statistics or computer science or another quantitative field
    Excellent communication skills

Please pass along all applications to me via email or in the comments below, and I will pass them on to the team.

{ 1 comment }

Additional Thoughts on Sam Bradford

On Thursday, I wrote about the mediocre (and worse) statistics produced by Sam Bradford throughout his career. Today, I wanted try to present the other side of the case. I’ve written about Bradford a few times here at Football Perspective, and some of those articles are instructive:

  • A year ago, I wondered whether Bradford would break out in his first season with the Eagles, and became a quarterback with the rare age 27 breakout season. I wrote that the odds were highly against a quarterback playing like Bradford through age 26 and then turning into a very good quarterback, but number one picks stuck on bad teams were the quarterbacks most likely to buck that trend.

In the context of defending Bradford, it is easy to point to a revolving cast of characters, both at receiver and offensive coordinator. His first three seasons in St. Louis, he had a different leading receiver and different offensive coordinator each year. In fact, he’s now had five different leading receivers in each of his five seasons, and last year was the first time he’s had a player gain even 700 receiving yards:

YearTop ReceiverRec YdsOffensive Coordinator
2010Danny Amendola689Pat Shurmur
2011Bradon Lloyd683Josh McDaniels
2012Chris Givens698Brian Schottenheimer
2013Jared Cook671Brian Schottenheimer
2015Jordan Matthews997Pat Shurmur

As a result, no player has gained even 15% of Bradford’s career passing yards. In fact, Bradford’s career-leading weapon is Brandon Gibson, who has 11.2% of Bradford’s yards. And only Danny Amendola is also over seven percent.

ReceiverTarYdsPerc
Brandon Gibson226165211.2%
Danny Amendola22913989.5%
Chris Givens1199936.7%
Jordan Matthews1179186.2%
Lance Kendricks1249006.1%
Steven Jackson1458715.9%
Zach Ertz1058165.5%
Austin Pettis1206904.7%
Danario Alexander746054.1%
Daniel Fells653912.6%
Brandon Lloyd583512.4%
Laurent Robinson753442.3%
Jared Cook423342.3%
Mark Clayton463322.2%
Brian Quick453152.1%
Darren Sproles652972.0%
Brent Celek202952.0%

That’s a pretty underwhelming set of receivers. One thing that might be instructive is seeing how those players have fared without Bradford. Let’s go in descending order based on the number of targets each player has seen from Bradford. [continue reading…]

{ 2 comments }

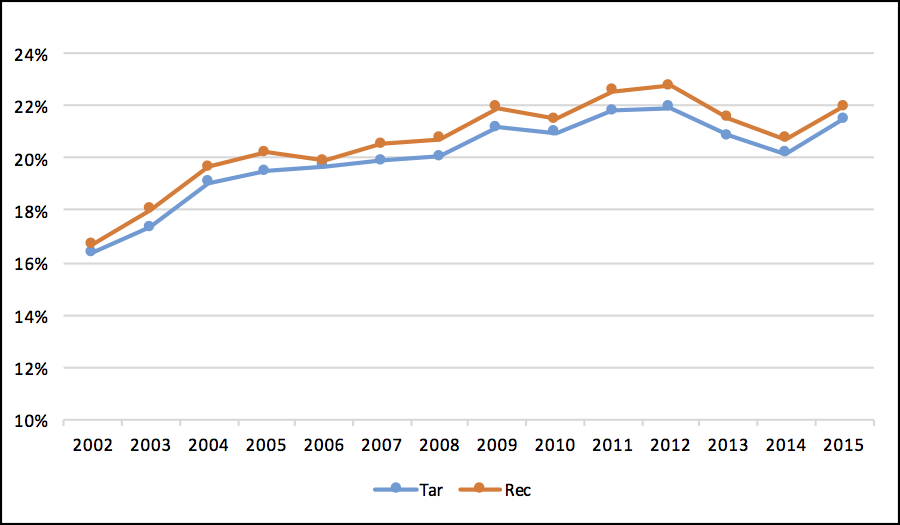
Yesterday, I posted some graphs on league-wide passing distribution. In that post, I noted that tight ends grabbed about 16% of all receiving yards in 2002-2003, but that number has increased to over 20% in recent years.  But that’s just receiving yards: as you might expect, targets and receptions have seen a similar climb:

te rec tar
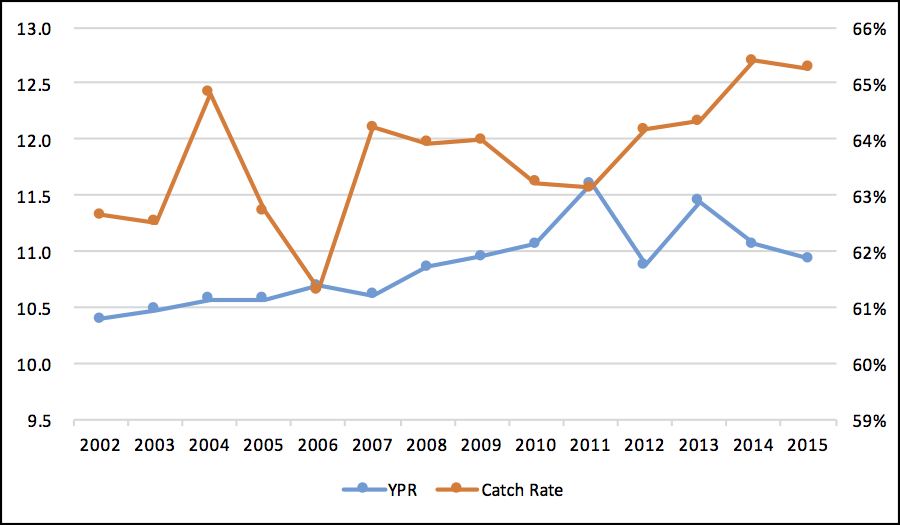
But more targets aren’t the only thing driving the increase.  Tight ends are also averaging slightly more yards per catch, too.  That increase has come despite the general decrease in yards per completion, so this may be a sign that tight ends are more athletic than they were 15-20 years ago, and that teams are sending them on more downfield rights.  In addition, catch rate has also been increasing, although in a more volatile way; still, tight ends are catching more passes, at higher rates, and for more yards.  In the picture below, yards per reception is plotted against the left Y-Axis, and catch rate is plotted against the right Y-Axis.
tar catch rate

Whatever the reason, tight ends seem to be a larger part of NFL offenses they were a decade ago, and for good reason: they’re getting better.

{ 1 comment }

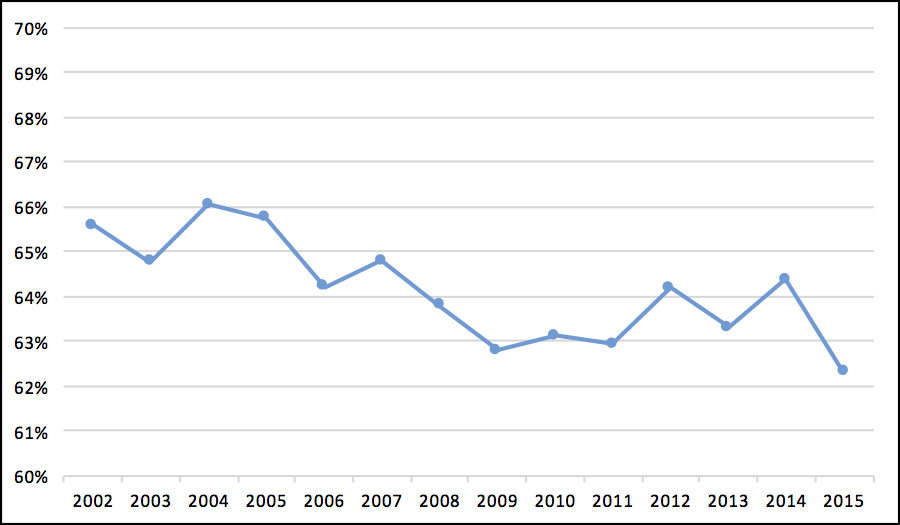
Some quick but interesting data dumps today. First, let’s take a look at receiving yards by wide receivers as a percentage of league-wide receiving yards in each year since 2002. In the early part of that era, wide receivers had about 2/3 of all receiving yards, but that number dipped to just 62% this year, the lowest during this period.

wr 2002 2015 [continue reading…]

{ 4 comments }

Yesterday, Bob Ford wrote DeMarco Murray and, how his 2014 season stands out as a career outlier. Today, I want to look at where it stands among the biggest year-to-year declines.

I looked at all players who rushed for at least 5 games in consecutive years, and rushed for at least 60 yards per game in the first season. For example, Murray rushed for 1,845 yards in 2014, an average of 115.3 yards per game. Last year, in 15 games, Murray averaged only 46.8 rushing yards per game. That’s a dropoff of 68.5 rushing yards per game, which is the second most in NFL history. The first? That honor goes to Lee Suggs.

Suggs was a star at Virginia Tech, rushing for 27 touchdowns in 11 games as a sophomore at Virginia Tech before tearing his ACL as a junior. In his senior year, he had another great season, rushing for 1,325 yards and 22 touchdowns. He was a 4th round pick of the Browns in 2003, where he served as the team’s backup. In ’04, he stole the job from William Green, and rushed for over 100 yards in each of Cleveland’s final three games. He averaged 74.4 rushing yards per game in ’04, but lost his job to Reuben Droughns in ’05. As a result, Suggs saw his average decline by 72.5 yards per game, an even more dramatic dropoff than Murray. [continue reading…]

{ 3 comments }

Bob Ford, a longtime fan of Pro-Football-Reference and Football Perspective, has contributed today’s guest post. Bob is the owner and founder of GOATbacks.com, which looks at the greatest running backs of all time. Thanks to Bob for today’s article!


Is DeMarco Murray in Danger of Joining A Very Exclusive Club?

In 2014 DeMarco Murray rushed for 1,845 yards on 392 carries at 4.7 yards per carry and just over 115 yards a game. That’s a great rushing season by any standard, and it puts Murray in some pretty exclusive company. Since Jim Brown first broke 1,800 rushing yards in 1963, just 16 other running backs have done it a total of 20 times, and only 3 (Dickerson, Sanders and Simpson) did it more than once.

Among the 17 RBs who’ve rushed for 1,800 yards, 10 have posted at least 10,000 career rushing yards, and 4 have at least 9,000. Those 4 are Ahman Green with 9,205, Earl Campbell with 9,407, Chris Johnson with 9,442 and Shaun Alexander with 9,553. And only 2 who’ve retired, Terrell Davis with 7,607 career rushing yards, and Jamal Anderson with 5,336, have failed to break 9,000 career rushing yards. After 5 seasons and 5,228 career rushing yards, DeMarco Murray is still active, so we don’t know how many career rushing yards he’ll eventually have, but all running backs who’ve rushed for more than 1,800 yards in a season have always, with the exception of Anderson and the singularly unique exception of Davis, put up a minimum of 9,000 career rushing yards.

Why do I call Davis a “singularly unique” exception? I’ll get to that in a minute, but consider how far behind the rest of the group Jamal Anderson, who rushed for 1,846 yards in 1998, actually is. He’s nearly 2,300 yards behind Davis and nearly 4,000 behind Green. What’s more, and not enviable for Murray, is that it’s Anderson’s career, not Davis’ or any of the others’, that bears a striking resemblance to Murray’s, and that doesn’t bode well for Murray. [continue reading…]

{ 11 comments }

The Eagles have resigned Sam Bradford, in a move that’s pretty hard to justify. In five different seasons, Bradford has thrown at least 250 pass attempts (he missed all of 2014 with a torn ACL). In those years, he has never ranked as a league-average quarterback as measured by Net Yards per Attempt. Based on PFR’s Advanced Passing Index ratings, Bradford had an 84 NY/A+ as a rookie, a 73 in year two, a 94 in 2012, an 89 in 2013, and a 98 last year.

In these ratings, 100 represents league average, 85 is one standard deviation below league average, and 70 is two standard deviations below league average. That’s five seasons of below-average — and often really below average — quarterbacking. And it now appears as though he’ll be given a sixth year, and you can imagine the smart money is on him once again falling short of league average.

I’m using NY/A instead of ANY/A because NY/A is a better predictive stat and less sensitive to outlier plays, and that arguably hurts Bradford in this analysis. He did post a 102 in ANY/A+ in 2013 because of an excellent interception rate, but the biggest criticism of Bradford is that he doesn’t take enough risks, as he generally throws very short passes. His average pass traveled just 7.04 yards downfield in 2015, which ranked 31st out of 34 qualifying quarterbacks. He ranked 34th out of 37 passers in this metric in 2013, 22nd out of 32 in 2012, 10th out of 33 in 2011, and 30th out of 31 in 2010. As a result, yes, Bradford does throw fewer interceptions, but I don’t think that’s a sign of anything other than conservative quarterback play.

I looked at all quarterbacks who had at least five seasons since 1970 [1]I have included quarterbacks who entered the league before 1970, but only counted their post-1969 seasons. with 250 pass attempts. Every season with a NY/A+ index of less than 100 was graded as “Bad” and every season with a NY/A+ index of 100 or better was “Good.” Bradford therefore goes down as 0/5, giving him a grade of -5. That’s pretty bad, although not the worst score in the group: [continue reading…]

References

References
1 I have included quarterbacks who entered the league before 1970, but only counted their post-1969 seasons.
{ 37 comments }

In 2015, there were just 15 games where a player rushed for at least 150 yards in a single game. That’s the smallest number since 1996, when just 14 players hit that mark. Thomas Rawls (!) was the only player with multiple games of 160+ rushing yards, and Adrian Peterson was the only other player with two 150+ yard rushing games.

Games with at least 150 rushing yards were much more common in the early ’00s, but they have not exactly been frequent throughout history. The graph below shows the number of times players rushed for 150+ yards in a game in each season since 1960. Note that in seasons with fewer than 32 teams/16 games, the number of instances were prorated as if it was a 512-game league season.

150+ rush2

The same trend holds up if we look at 125+ rushing yard games, with 2015 representing a modern low. Again, throughout this post, I have pro-rated non-512 game seasons. [continue reading…]

{ 10 comments }
Previous Posts