≡ Menu

NFC SRS Ratings, 2002 to 2015

On Friday, I looked at the SRS ratings of AFC teams. Today, let’s do the same for the NFC. And let’s start with the NFC East, which has been a consistently inconsistent division that, over time, looks average. The four NFC East teams have each won the division twice over the last 8 years, but the division as a whole has clearly declined over that period:

nfc east srs

The peak NFC East came in 2007: the Cowboys were the #1 seed, the Giants won the Super Bowl, and both Philadelphia and Washington had positive SRS grades. Last year? None of the four teams had a positive SRS grade. [continue reading…]

{ 5 comments }

Today at 538: Putting into context the fact that Dak Prescott, the 135th pick in the 2016 NFL Draft, is going to be the Cowboys starting quarterback in week 1. And that Trevor Siemian, a 7th round pick last year who has never seen meaningful action in an NFL game, is going to be the Broncos starter.

This is rarely charted territory in modern history: In the last 30 years, only three rookie quarterbacks drafted outside of the top 100 picks started their team’s season opener: Orton, Chris Weinke in 2001 and Steve Beuerlein in 1988.1 You have to go all the way back to 1977 to find a quarterback not selected in the first 130 picks of the NFL draft who then went on start his team’s season opener as a rookie.

You can view the full article https://fivethirtyeight.com/features/dak-prescott-is-not-your-average-week-1-starting-quarterback/.

{ 1 comment }

The Jets defense was pretty good last year. New York allowed 29 touchdowns in 2015, tied with the Broncos for the fourth fewest in the NFL. But the Jets allowed a ton of long touchdowns: on average, those 29 touchdowns scored by opposing offenses came from 23 yards away.

That may not mean much to you in the abstract, but only three other defenses (Ravens, Vikings, Rams) saw allowed touchdowns from, on average, at least 20 yards away; by contract, the other 31 teams allowed touchdowns that gained, on average, 16.22 yards. One reason I initially thought the Jets defense fared poorly in this statistic is because of the team’s historically great run defense, and that’s partially true. The Jets allowed only four rushing touchdowns last year, and they came from 1, 1, 2, and 18 yards away.

But if you look at only passing touchdowns, the Jets defense still allowed the longest average touchdown at 26 yards (even worse than the Saints!), compared to an NFL average of 19 yards. The Jets allowed 15 touchdown passes of 20+ yards last year, tied with New York’s other team for the most in the NFL.

What was the reason for those long touchdowns? I went back and re-watched all 15 touchdowns, and tried to assign blame.  In most cases, it was pretty easy. [continue reading…]

{ 1 comment }

I highly recommend the Bill Barnwell podcast, and this week’s episode previewing the NFC South was a good one. When hearing about the Saints terrible defense last year, Barnwell noted that it seemed like the Saints defense was always allowing big touchdowns.

Well, that’s true: New Orleans gave up a whopping ten touchdown passes of 40+ yards last season; Washington was second with 7 such touchdowns, and that included three touchdowns of exactly 40 yards. By contrast, the Saints allowed six touchdown passes of 50+ yards! The last pass defense to allow 10 touchdowns of 40+ yards was the 1989 Houston Oilers, a 9-7 team that made the playoffs.

The most long (i.e., 40+ yards) passing touchdowns allowed in a season? That sad place in history belongs to another Oilers team. In 1966, Houston allowed 15 such touchdowns in a 14-game season. The 1961 Bills allowed 14 touchdown passes of 40+ yards, the 1950 Rams allowed 12 such scores, and the ’83 Cowboys, ’68 Dolphins, ’65 Browns, and ’52 Texans allowed 11 long touchdowns.

Last year’s Saints allowed, on average, 7.9 yards on every opposing dropback last year. That’s the largest average gain since the 1981 Colts defense (8.2), and it was obviously inflated by all those long touchdowns. But the good news for Saints fans is that regression to the mean has to help New Orleans… right? [continue reading…]

{ 3 comments }

Jason Witten: Still On Pace For the HOF

Seven years ago, I wrote an article for the old PFR blog about Cowboys tight end Jason Witten. That article was titled Jason Witten (HOF Class of 2024). At the time, it felt a little premature, but Witten’s numbers were outstanding, and it seemed likely he would retire with HOF numbers.

Three years ago, I updated that post, and noted that Witten hadn’t slowed down.  Today? I wanted to provide another quick update.  Jason Witten completed his age 33 season in 2015.  And here’s the killer stat: nobody in NFL history has more receptions through their age 33 season than Jason Witten. [continue reading…]

{ 21 comments }

AFC SRS Ratings, 2002 to 2015

I thought it would be fun to look at the SRS ratings for each division in the AFC since realignment in 2002. SRS, of course, stands for Simple Rating System: at its core, it’s just points differential (per game) adjusted for strength of schedule. To derive division ratings, I simply took the average of the SRS ratings of each of the four teams in any given season.

Let’s start with the best division in the conference over the last 14 years, the AFC East. From 2002 to 2015, the average AFC East team season has produced an SRS of +2.0. That’s the best division in football, and by a pretty large margin, too (second is the AFC North at +0.9). That said, the AFC East is on a bit of a decline lately: the division was below-average in 2012 and 2013, and barely above-average last year. But in ’04, ’06, ’09, and ’10, the AFC East produced some outstanding seasons. Take a look:

afc east srs

The division hasn’t exactly had a lot of turnover at the top: the Patriots won the division every year but ’02 (Jets) and ’08 (Dolphins), and New England obviously is the driving force here. The Patriots are at +9.5, while the other three teams average a -0.6 rating. But the AFC East also doesn’t have a bottom-feeder, and that helps. The AFC doesn’t have a Raiders, Jaguars, or Browns dragging it down; the Bills SRS rating since ’02 is -1.4, which is easily the best of any 4th-place team in any division in the NFL. Having the best team in the NFL and the best worst team makes it pretty easy to see why the AFC East fares so well here. [continue reading…]

{ 4 comments }

There Only Used To Be A Super Bowl Loser’s Curse

The Carolina Panthers went 15-1 last year but lost in the Super Bowl; obviously the natural follow-up question there is does this mean the 2016 Panthers will be cursed? If this was a decade ago, the answer would almost certainly be yes. Because there was a very scary Super Bowl loser’s curse that went on for about 9 straight years:

The 2006 Bears had a fantastic defense and made the Super Bowl; in ’07, Chicago went 7-9.

The 2005 Seahawks won 13 straight games (excluding a meaningless week 17 performance) before falling in the Super Bowl to Pittsburgh; in ’06, Seattle dropped to 9-7.

The 2004 Eagles started the season 13-1 and were the clear dominant squad in the NFC; after losing in the Super Bowl, Philadelphia and Terrell Owens imploded, and the Eagles went 6-10 the next season.

The 2003 Panthers lost the Super Bowl on the last play of the game; the next year, Carolina went just 7-9.

The 2002 Raiders were favorites entering the Super Bowl, but went 4-12 the next season.

The 2001 Rams were heavy favorites in the Super Bowl, but went 7-9 in 2002. [continue reading…]

{ 5 comments }

Bad Teams Doing Well In Good Divisions

In 2012, the Rams went 4-1-1 in the NFC West, but 3-7 against the rest of the NFL. The NFC West was pretty good that year, which made that even more remarkable: St. Louis had the best record in intradivision games of any NFC West team, but the worst interdivision record.

Then, last year, the Rams did it again, going 4-2 against the NFC West (best record, tied with Arizona) but a division-worst 3-7 against the rest of the NFL.

How often does it happen that a team does this? Perhaps more frequently than you might think. The Bills swept the Dolphins and Jets last year, but were swept by New England. Meanwhile, the Patriots dropped a game to both Miami and New York. But while the Patriots (8-2), Jets (7-3), and Dolphins (5-5) fared better against non-AFC East competition last year, the Bills went 4-6 outside of the division.

Since 2002, it has happened 24 times. Take a look:

YearTmDivIntra W%Inter W%Div Strength
2008NYJAFCEast0.6670.5000.650
2002ATLNFCSouth0.6670.5500.638
2015BUFAFCEast0.6670.4000.600
2005WASNFCEast0.8330.5000.600
2012STLNFCWest0.7500.3000.575
2015STLNFCWest0.6670.3000.575
2002NWEAFCEast0.6670.5000.575
2002NYJAFCEast0.6670.5000.575
2012CARNFCSouth0.5000.4000.550
2012TAMNFCSouth0.5000.4000.550
2012NORNFCSouth0.5000.4000.550
2009NYGNFCEast0.6670.4000.550
2009CINAFCNorth1.0000.4000.525
2009MIAAFCEast0.6670.3000.500
2011KANAFCWest0.5000.4000.475
2010OAKAFCWest1.0000.2000.475
2006GNBNFCNorth0.8330.3000.450
2011PHINFCEast0.8330.3000.450
2006ARINFCWest0.6670.1000.425
2013DETNFCNorth0.6670.3000.425
2006CARNFCSouth0.8330.3000.425
2013DALNFCEast0.8330.3000.400
2010SFONFCWest0.6670.2000.325
2014ATLNFCSouth0.8330.1000.263

The standard bearer for the most Rams team of the post-2002 era? All four AFC East teams won at least 7 games, and the division was 65% (24-16) of its interdivision games that year, the 2nd best season in AFC East history (1999). In those games, the Bills, Dolphins, and Patriots all went 7-3, while the Jets (with Brett Favre) went 5-5. You might think that means the Jets would have struggled in division games, but New York went 4-2, as did New England and Miami, while Buffalo went 0-6.

{ 4 comments }

Footballguys.com – Why Subscribe?

Regular readers know that I’m one of the writers at Footballguys.com. If you are a hardcore fantasy footballer (or daily fantasy sports player), you probably already know that Footballguys.com is the single best source for fantasy football information. If you are a more casual fantasy football player, you’ll find that the tools available at Footballguys will make life much, much easier for you to win your league(s). Either way, I think a Footballguys Insider PRO subscription is a fantastic value for $34.95. Also fantastic values: the Footballguys Draft Dominator for mobile devices, which costs $4.99.

I don’t make extra money if more people sign up for Footballguys or buy an app, but I hope my readers subscribe because I think a subscription is a really good deal. If you play fantasy football and want to win your competitive league or save hours doing research for your local league, a Footballguys subscription is well worth it. For $34.95, you get: [continue reading…]

{ 5 comments }

Super Bowl 51 Odds: Top 6 Teams Or The Field?

Fun article over at SB Nation on national championship odds in college football for this season. The question the folks were trying to answer was what is the smallest number of teams you could group together to give you a 50/50 (or better) shot of containing the eventual champion?  As it turns out, most people thought “taking the top five or six teams presents close to a fair wagering opportunity.”

What about in the NFL? Well, despite the presence of nearly 100 fewer teams, the answer is about the same.  The Patriots, Packers, Panthers, Steelers, Seahawks, and Cardinals form the upper crust of the NFL, at least according to Vegas odds.  Together, that group has about a 50% chance of containing the Super Bowl 51 champion.

Take a look at the odds from Football Locks, which is pretty similar to the odds at other places.  Here’s how to read the table below: The Patriots have 15/2 odds, which translates to 1 out of 8.5, or 11.8%. That includes a vig, tho, and if we remove the vig from each team, that drops the Patriots odds to 9.9%, which is a better approximation of New England’s real odds. I then sorted the teams in the NFL by that number, and calculated the cumulative Super Bowl percentage — after six teams, it’s pretty close to a 50/50 proposition. [continue reading…]

{ 5 comments }

Coaching Hires In The NFL Since 2000

In 2000, the Raiders head coach was Jon Gruden. He was traded to Tampa Bay and replaced by Bill Callahan, who was fired after two years. Norv Turner then took over for two years before he was fired. Oakland then brought back Art Shell for one season, before finding the team’s coach of the future with Lane Kiffin. That lasted just over a season; Tom Cable took over as interim head coach and was retained for the full-time gig for a couple of years. Then it was Hue Jackson, and then Dennis Allen, and now Jack Del Rio.

That’s 9 head coaching hires since 2000, the most in the NFL. The table below shows the number of head coaches (excluding interim coaches) for each team since 2000, the year Bill Belichick came to New England. There were 142 of them: [continue reading…]

{ 8 comments }

Other AFC East Head Coaches During The Belichick Era

A photo from the last era when the Bills were AFC East champs

A photo from the last era when the Bills were AFC East champs

Bill Belichick has made life difficult on the rest of the AFC East for the last 15 years. In 2001, he won his first Super Bowl with the Patriots, and then won another two years later. Since then, the AFC East has had almost constant turnover, with each other franchise trying to find its own Belichick.

  • In 2004, the Bills hired Mike Mularkey. He went 14-18 in two years.
  • In 2005, the Dolphins hired Belichick affiliate Nick Saban. He went 15-17 in two years.
  • In 2006, the Jets got in on the act, and hired a Belichick disciple, Eric Mangini. He went 23-25 in three years. That same year, Buffalo moved on from Mularkey and hired Dick Jauron, who went 24-33.
  • In 2007, the Dolphins hired Cam Cameron as the answer to the team’s offensive woes, who went… 1-15.
  • In 2009, the Jets hired Rex Ryan, who went 46-50 in six years in New York, the longest tenure of any non-Belichick coach in the AFC East since 2000.
  • In 2010, the Bills were back in the market, and hired Chan Gailey. In three years with Buffalo, Gailey went 16-32.
  • In 2011…. no AFC East team made a coaching change! The Jets were in the middle of the peak of the Ryan era, Buffalo just had Gailey, and the Dolphins had not yet given up on Sparano. Of course, before the end of the season, Miami had moved on, and Todd Bowles finished the season as interim head coach.
  • In 2012, the Dolphins hired Joe Philbin as the answer to the team’s offensive woes. He went 24-28 in Miami.
  • In 2013, the Bills hired Doug Marrone. He went 15-17 in two seasons in Buffalo.
  • In 2014, the Jets still had somehow not given up on Ryan, the Bills were only a year into the Marrone era, and Miami was still optimistic about Philbin. Along with 2011, this was the only other season with no offseason coaching changes.
  • In 2015, the Jets moved on from Ryan and hired Todd Bowles, who went 10-6. The Bills then hired Rex Ryan, who went 8-8 last year.
  • In 2016, Miami hired Adam Gase as the team’s answer to its offensive woes.

Putting aside the three current coaches, that’s 10 coaches from ’04 to ’13 that were hired by the other three AFC East teams, and all ten exited the division with losing records. In the last 13 years, Belichick’s Patriots have won the AFC East 12 times, with Sparano being the only other man to win an AFC East title. Before Sparano, the last four head coaches to win the AFC East other than Belichick are ….

Yikes. And now for your trivia of the day: the last head coach to leave the AFC East with a winning record was Wannstedt (42-31).

{ 3 comments }

Playing like cowards

When athletes lose to inferior opponents, the excuses quickly follow. That’s a pretty good rule of thumb, and it applies to women’s soccer, too. Here’s what Hope Solo said after the U.S. lost to Sweden in the Olympics:

“I thought that we played a courageous game,” Solo said. “I thought that we had many opportunities on goal. I think we showed a lot of heart. We came back from a goal down; I’m very proud of this team.

“I also think we played a bunch of cowards. But, you know, the best team did not win today; I strongly, firmly believe that. I think you saw America’s heart. You saw us give everything that we had today. Unfortunately the better team didn’t win.”

The U.S. outshot Sweden 27-2, but the game ended 1-1 after 120 minutes plus stoppage time. The unique thing about soccer is that its tiebreaker is a shootout, which is kind of like playing an NFL game and then having a field goal kicking contest. In other words, once you go to a shootout, the better team suddenly doesn’t have much (any?) of an edge.

Asked to elaborate on what she meant by cowards, Solo referenced Pia Sundhage, the Swedish coach who formerly coached the United States and won two Olympic gold medals.

“Sweden dropped off, didn’t want to open play,” Solo said. “They didn’t want to pass the ball around. They didn’t want to play great soccer, entertaining soccer. It was a combative game, a physical game. Exactly what they wanted and exactly what their game plan was. They dropped into a 50. They didn’t try and press, they didn’t want to open the game and they tried to counter with long balls. We had that style of play when Pia was our coach.

“I don’t think they’re going to make it far in the tournament. I think it was very cowardly. But they won. They’re moving on, and we’re going home.”

[continue reading…]

{ 88 comments }

David Johnson, Receiving Superstar

The great Chris Wesseling at NFL.com published an article this week about Cardinals running back David Johnson.  The piece contained lofty praise about Johnson’s receiving ability, so much so that it made me want to re-evaluate his rookie stats.

One place where Johnson’s receiving ability stands out is in his yards per reception. As a rookie last year, he became the first player (rookie or otherwise) in 16 years to average 12 yards per reception while gaining at least 400+ rushing yards and 400+ receiving yards.   And just the third in the last 25 years:

 
Games Rushing Receiving
Rk Player Year Age Draft Tm G GS Att Yds Y/A TD Y/G Rec Yds Y/R TD Y/G
1 David Johnson 2015 24 3-86 ARI 16 5 125 581 4.65 8 36.3 36 457 12.69 4 28.6
2 Marshall Faulk* 1999 26 1-2 STL 16 16 253 1381 5.46 7 86.3 87 1048 12.05 5 65.5
3 Garrison Hearst 1998 27 1-3 SFO 16 16 310 1570 5.06 7 98.1 39 535 13.72 2 33.4
4 Gary Anderson 1990 29 1-20 TAM 16 13 166 646 3.89 3 40.4 38 464 12.21 2 29.0
5 Barry Sanders* 1990 22 1-3 DET 16 16 255 1304 5.11 13 81.5 36 480 13.33 3 30.0
6 Albert Bentley 1987 27 2-35 IND 12 4 142 631 4.44 7 52.6 34 447 13.15 2 37.3
7 James Brooks 1986 28 1-24 CIN 16 16 205 1087 5.30 5 67.9 54 686 12.70 4 42.9
8 Gary Anderson 1985 24 1-20 SDG 12 6 116 429 3.70 4 35.8 35 422 12.06 2 35.2
9 Curtis Dickey 1983 27 1-5 BAL 16 16 254 1122 4.42 4 70.1 24 483 20.13 3 30.2
10 Darrin Nelson 1983 24 1-7 MIN 15 9 154 642 4.17 1 42.8 51 618 12.12 0 41.2
11 Joe Cribbs 1981 23 2-29 BUF 15 15 257 1097 4.27 3 73.1 40 603 15.08 7 40.2
12 Billy Sims 1981 26 1-1 DET 14 14 296 1437 4.85 13 102.6 28 451 16.11 2 32.2
13 Billy Sims 1980 25 1-1 DET 16 16 313 1303 4.16 13 81.4 51 621 12.18 3 38.8
14 Wilbert Montgomery 1979 25 6-154 PHI 16 16 338 1512 4.47 9 94.5 41 494 12.05 5 30.9
15 Greg Pruitt 1977 26 2-30 CLE 14 14 236 1086 4.60 3 77.6 37 471 12.73 1 33.6
16 Sherman Smith 1977 23 2-58 SEA 14 14 163 763 4.68 4 54.5 30 419 13.97 2 29.9
17 O.J. Simpson* 1975 28 1-1 BUF 14 14 329 1817 5.52 16 129.8 28 426 15.21 7 30.4
18 Mike Thomas 1975 22 5-108 WAS 14 10 235 919 3.91 4 65.6 40 483 12.08 3 34.5
19 Mack Herron 1974 26 6-143 NWE 14 14 231 824 3.57 7 58.9 38 474 12.47 5 33.9
20 Larry Brown 1973 26 8-191 WAS 14 14 273 860 3.15 8 61.4 40 482 12.05 6 34.4
21 Larry Brown 1972 25 8-191 WAS 12 12 285 1216 4.27 8 101.3 32 473 14.78 4 39.4
22 Cid Edwards 1972 29 SDG 12 12 157 679 4.32 5 56.6 40 557 13.93 2 46.4
23 Carl Garrett 1972 25 3-58 NWE 10 6 131 488 3.73 5 48.8 30 410 13.67 0 41.0
24 Essex Johnson 1972 26 6-156 CIN 14 11 212 825 3.89 4 58.9 29 420 14.48 2 30.0

And while you may remember Johnsons’s game-clinching, 55-yard touchdown catch against the Saints, it wasn’t just one or two catches boosting up his average gain. Consider: there were 40 running backs last year who had at least 25 receptions.  Of that group, only Johnson (58%) converted at least half of his receptions into first downs. To find a player with a better conversion rate, you’d have to go down to Arian Foster, who converted 13 of his 22 catches (59%) into first downs.))

RkPlayerRec1Dratio
1David Johnson362158.3%
2Danny Woodhead803948.8%
3James White401947.5%
4Dion Lewis361747.2%
5Benny Cunningham261246.2%
6Bilal Powell472144.7%
7Mark Ingram502244%
7Ameer Abdullah251144%
9Charles Sims512243.1%
10T.J. Yeldon361541.7%
11Theo Riddick803240%
11Chris Thompson351440%
11Marcel Reece301240%
14James Starks431739.5%
15Giovani Bernard491938.8%
16Duke Johnson622438.7%
16Dexter McCluster311238.7%
18Matt Forte441738.6%
19C.J. Spiller341338.2%
20Darren Sproles552138.2%
21DeAngelo Williams401537.5%
21LeSean McCoy321237.5%
21Fred Jackson321237.5%
24Shane Vereen592237.3%
25Javorius Allen451533.3%
25Chris Ivory301033.3%
27Frank Gore341132.4%
28Lamar Miller471531.9%
29Jonathan Grimes26830.8%
30Doug Martin331030.3%
31Darren McFadden401230%
31Adrian Peterson30930%
33DeMarco Murray441329.5%
34Devonta Freeman732128.8%
35Rashad Jennings29827.6%
36Shaun Draughn27725.9%
37Melvin Gordon33824.2%
38C.J. Anderson25624%
39Latavius Murray41922%
40Justin Forsett31412.9%

It’s obviously premature to talk about Johnson as an all-time great receiving back, despite the quotes in Wesseling’s article. But this gives us something else to keep an eye on in 2016.

{ 3 comments }

On Tuesday, former Seahawks safety Kenny Easley was announced as as a senior finalist for the 2017 Hall of Fame.  Yesterday, the two executives up for nomination were announced, too:

Dallas Cowboys Owner/President/General Manager Jerry Jones and former National Football League Commissioner Paul Tagliabue were selected today by the Pro Football Hall of Fame’s Contributors Committee as finalists for the Hall of Fame’s Class of 2017.

Jones bought the Cowboys franchise in 1989 and quickly restored a winning tradition in Dallas. Under his leadership, the Cowboys captured three Super Bowl championships over a four-year period with victories in Super Bowls XXVII, XXVIII and XXX. In addition, the team has won nine division titles during Jones’ era. The Cowboys owner has also had great influence on the growth of the NFL. His impact in areas of sports marketing, promotion and development greatly enhanced the league’s success and also altered the American sports culture over the past three decades.

“I can’t tell you about how humble and gratified I am,” Jones stated today.

Tagliabue served as the NFL’s Commissioner from 1989 through 2006. The NFL grew significantly in a number of areas during his 17-year tenure. With Tagliabue leading the way, the league expanded from 28 to 32 teams; constructed 20 new stadiums, and secured long-term labor agreements with the NFL Players Association. The Commissioner also established an overseas presence, created a league-wide Internet network and launched NFL Network. He also orchestrated historic television deals that ranked as the biggest in entertainment history including a TV package negotiated for 2006-2011 valued at $25 billion.

“I’m deeply appreciative of the vote of confidence from the Selection Committee,” Tagliabue shared moments after learning the news of his selection as a finalist.

Easley, Jones, and Tagliabue will each face an up-down vote: each player must receive 80% to be selected into the Hall of Fame, but none of them are competing with any other person for a spot.

What are your thoughts on this year’s choices so far?

{ 13 comments }

Yesterday, I looked at the best seasons in TD/INT Ratios after adjusting for era. Today? The worst, using the same formula.

Only one quarterback has ever qualified for the league passing crown but also failed to throw a touchdown: Bobby Hoying in 1998. That season is the only thing keeping rookie Ryan Leaf from the bottom of this table.

Here’s how to read it, using Leaf as an example. Leaf threw 2 TDs and 15 INTs in 1998, a 0.13 TD/INT Ratio on 245 passes. Leaf averaged 0.82 TD passes per 100 attempts – a laughably low number that is one of just four below 1.00 seasons — when the league average was 4.23. As a result, meaning he was at just 19% of league average. He threw 6.12 interceptions per 100 attempts, when the league average was 3.27, so he was at just 53% of league average. Multiply those two numbers (19%, 53%) and Leaf has a value of just 0.10, second worst in NFL history. That said, Hoying was so bad he would have needed two touchdown throws to move out of the cellar: [continue reading…]

{ 13 comments }

Era-Adjusted TD/INT Ratios

On Saturday, I asked the question: Is TD/INT Ratio Now Meaningless? That question was shorthand for a less hot-takey view, but fortunately I’m lucky enough to have smart readers who engaged in some excellent discussion in the comments. One of those guys, Bryan Frye, brought up the idea of a TD/INT+ Ratio, or an era-adjusted version.

I spent a bit of time playing with different ways to adjust for era, including using Z-Scores. One problem there was that the variance in TD and INT Rates is pretty significant from year to year, which makes the Z-Score heavily influenced more by year-to-year fluctuation that true era adjustments. So here’s what I did, using Milt Plum in 1960 and Tom Brady in 2010 as examples. Those two players rank 4th and 5th in this system despite playing 50 years apart. The raw numbers? Brady had a 9:1 TD/INT Ratio with 36 TDs and 4 INTs, while Plus was at 4.2:1, courtesy of 21 TDs and 5 INTs.

1) First, we convert to rates. Plum threw 250 passes, while Brady had almost exactly double, with 492 attempts. Plum averaged 8.40 TD/100Att, while Brady was at 7.32 TD/100Att. On the other hand, Plum was at 2.00 INT/100Att, vs. 0.81 INT/100Att for Brady.

2) Next, we adjust for era, using only players who had enough pass attempts to qualify for the league passing crown, and taking a simple average of the rates of those players. Therefore, for the 1960 NFL season, the TD/100Att average was 5.34, while the INT/100Att average was 7.13. So Plum was at 157% of league average at throwing touchdowns and 357% of league average at avoiding interceptions.

Brady? Well, in 2010, the qualifying passers averaged 4.47 touchdowns and 2.78 interceptions per 100 pass attempts. This means he was at 164% of league average in touchdowns and 342% at avoiding interceptions

3) Finally, we multiply the two rates. So Plum’s Adjusted TD Rate times his Adjusted INT Rate was 5.61, while Brady was at 5.60. [continue reading…]

{ 21 comments }

Todd Gurley and Rushing TDs on Bad Offenses

Here’s a good article by Matt Harmon presenting the contrarian case against Todd Gurley as a fantasy player. One of Matt’s arguments against Gurley’s fantasy value is that he’s on a bad offense, and his numbers last year were only strong because he scored such a high percentage of St. Louis offensive touchdowns.

That math checks out: Gurley ran for 10 TDs (with no receiving touchdowns), while the Rams scored 27 total offensive touchdowns. That means that Gurley rushing touchdowns made up 37% of all Rams offensive touchdowns, which was the highest rate in the NFL last year, and the highest rate in the NFL in three years. The only other players in shouting range of that number were Adrian Peterson (11/32, or 34% of all Vikings offensive touchdowns) and Devonta Freeman (11/34, of 32% of Falcons touchdowns). [1]Note that if we included receiving touchdowns, Freeman would vault Gurley, as he accounted for 41% of all Atlanta offensive touchdowns.

Another rookie from the SEC holds the modern record in this category. In 1981, South Carolina’s George Rogers was drafted by the Saints, and he led the NFL in rushing yards as a rookie. He also rushed for 13 touchdowns, despite the Saints finishing last in the league in scoring. Rogers rushed for 13 of the team’s 24 offensive touchdowns, or 54%. The table below shows the top 100 seasons by this metric since 1960: [continue reading…]

References

References
1 Note that if we included receiving touchdowns, Freeman would vault Gurley, as he accounted for 41% of all Atlanta offensive touchdowns.
{ 9 comments }

Is TD/INT Ratio Now Meaningless?

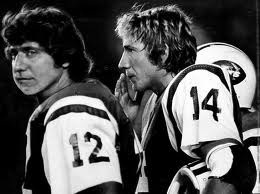
A pair of Crimson Tide/Jets quarterbacks in 1976

A pair of Crimson Tide/Jets quarterbacks in 1976

You remember Jets quarterback Richard Todd, don’t you? Before there was Favre/Rodgers and Montana/Young, Jets fans envisioned a Namath/Todd passing of the torch. Eleven years after New York drafted Joe Namath, the Jets spent the 6th pick in the 1976 draft on Todd: another quarterback from Alabama. For a year, the duo overlapped: a passed-his-prime Namath threw 4 touchdowns against 16 interceptions in 8 starts, while an inexperienced Todd had 3 touchdowns and 12 interceptions in 6 starts.

The duo even looked similar, shaggy hair and all, and you can forgive Jets fans for hoping that another Hall of Fame quarterback had come to them out of Tuscaloosa. Todd failed to meet those lofty expectations, of course, but he did lead the NFL in yards per pass attempt in 1979. Three years later, in the strike-shortened 1982 season, a 29-year-old Todd started every game for the Jets and posted the following stat line: [continue reading…]

{ 38 comments }

Tony Galbreath, A Forgotten Record Holder

Galbreath with the Saints

Galbreath with the Saints

Throughout his playing career, Walter Payton was chasing the ghost of Jim Brown.  At the end of the 1981 season, Payton was in 5th place on the career rushing list.  By ’82, he was in 4th; after ’83, he was up to 3rd place. Then, in 1984, Payton passed both Francos Harris and Brown to move into the top spot on the career rushing yards list.

But at the same time that he was chasing a much more flesh-and-blood figure: Saints/Vikings/Giants running back Tony Galbreath. Let’s jump in a time machine back to 1982. At that time, just seven players had at least 75+ career rushing attempts and 375+ career receptions. Three were Hall of Famers Bobby Mitchell, Charley Taylor, and Elroy Hirsch, but all three players made the HOF in large part because of their work as wide receivers. All three players entered professional football as running backs.

Crazy Legs switched after four years (and just one with the Rams) to become a wide receiver on the high-flying Rams of the early ’50s. Taylor was a running back his first two seasons — and a Pro Bowl one at that — but switched positions midway through the 1966 season and remained at wide receiver the rest of his career. Mitchell was stuck behind Brown in Cleveland, but it wasn’t until he was traded to Washington after his fourth season that he become a receiver.

A fourth member of the 75/475 list was Bobby Joe Conrad. who played with the Cardinals in the ’60s. He also switched positions early in his career, and turned into a star receiver almost immediately. As a result, only three true running backs were on the list: Lydell Mitchell, Rickey Young, and Joe Morrison. A star with the Giants in the ’60s, Morrison retired in 1972; he was still the career leader in receptions by a running back a decade later, with 395 receptions. Mitchell, a borderline HOF running back with the Colts, got up to 376 before retiring. Through age 29, he had 355 receptions and had topped 55 catches in each of his last five years; while he would have seemed like a lock to break Morrison’s record, he caught just two more passes the rest of his career.

That leaves Young, a fullback with the Chargers and Vikings. He caught a league-high 88 passes in ’78, and was at 387 receptions as of 1982. He turned 30 in 1983, his final season in the NFL, but caught another 21 passes, breaking Morrison’s record and retiring as the running back catch king, with 408 grabs. But Morrison didn’t retire with an easy stomach: both Payton and Galbreath were hot on his tails.

As of 1983, Payton, who entered the league in 1975, had 328 receptions. But Galbreath was already at 364 receptions, despite entering the NFL a year later. In ’84, Galbreath became just the second pure running back to hit the 400-catch mark; by ’85, Payton had become the third, and Galbreath had supplanted Morrison as the running back catch king. After ’86, Payton had really narrowed the gap: he had 459 career receptions, while Galbreath was at 464. Who would win up as the all-time running back catch king? That left the 1987 season as the battle ground for the highest of stakes: both Payton and Galbreath would retire after the season.

In the season opener, the duo squared off, with all eyes watching the race with a secondary battle between the Giants and Bears taking place. Payton caught three passes, giving him 462 for his career; Galbreath had just one, upping his total to 465.

By November 8th, Payton had closed the gap entirely: both players stood with 475 career receptions. The next week, Payton had a Pyrrhic victory: his Bears lost in Denver, but he became the running back catch king with the first of his three receptions that day (Galbreath had none). [continue reading…]

{ 5 comments }

Right now, three of the top 20 running backs in career receptions are active: Matt Forte, Darren Sproles, and Reggie Bush. Note that for these purposes, players like Bobby Mitchell, Charley Taylor, and Eric Metcalf — who all entered the league as running backs but then converted to wide receiver — were excluded.

Games Rushing Receiving
Rk Player From To Draft G GS Att Yds Y/A TD Y/G Tgt Rec
Yds Y/R TD Y/G Ctch% Y/Tgt
1 Larry Centers 1990 2003 5-115 198 108 615 2188 3.56 14 11.1 1044 827 6797 8.22 28 34.3 6.51
2 Marshall Faulk* 1994 2005 1-2 176 156 2836 12279 4.33 100 69.8 1013 767 6875 8.96 36 39.1 75.7% 6.79
3 LaDainian Tomlinson 2001 2011 1-5 170 155 3174 13684 4.31 145 80.5 868 624 4772 7.65 17 28.1 71.9% 5.50
4 Keith Byars 1986 1998 1-10 189 160 865 3109 3.59 23 16.4 428 610 5661 9.28 31 30.0 13.23
5 Marcus Allen* 1982 1997 1-10 222 168 3022 12243 4.05 123 55.1 241 587 5411 9.22 21 24.4 22.45
6 Tiki Barber 1997 2006 2-36 154 109 2217 10449 4.71 55 67.9 814 586 5183 8.84 12 33.7 72.0% 6.37
7 Ronnie Harmon 1986 1997 1-16 181 27 615 2774 4.51 10 15.3 462 582 6076 10.44 24 33.6 13.15
8 Roger Craig 1983 1993 2-49 165 133 1991 8189 4.11 56 49.6 62 566 4911 8.68 17 29.8 79.21
9 John Williams 1986 1995 1-15 149 133 1245 5006 4.02 18 33.6 316 546 4656 8.53 19 31.2 14.73
10 Eric Metcalf 1989 2002 1-13 179 77 630 2392 3.80 12 13.4 635 541 5572 10.30 31 31.1 8.77
11 Herschel Walker 1986 1997 5-114 187 137 1954 8225 4.21 61 44.0 296 512 4859 9.49 21 26.0 16.42
11 Earnest Byner 1984 1997 10-280 211 131 2095 8261 3.94 56 39.2 275 512 4605 8.99 15 21.8 16.75
13 Warrick Dunn 1997 2008 1-12 181 154 2669 10967 4.11 49 60.6 710 510 4339 8.51 15 24.0 71.8% 6.11
14 Walter Payton* 1975 1987 1-4 190 184 3838 16726 4.36 110 88.0 492 4538 9.22 15 23.9
15 Tony Galbreath 1976 1987 2-32 170 73 1031 4072 3.95 34 24.0 490 4066 8.30 9 23.9
16 Matt Forte 2008 2015 2-44 120 120 2035 8602 4.23 45 71.7 636 487 4116 8.45 19 34.3 76.6% 6.47
17 Curtis Martin* 1995 2005 3-74 168 166 3518 14101 4.01 90 83.9 606 484 3329 6.88 10 19.8 79.9% 5.49
18 Darren Sproles 2005 2015 4-130 153 23 577 2867 4.97 20 18.7 631 473 4156 8.79 28 27.2 75.0% 6.59
19 Thurman Thomas* 1988 2000 2-40 182 160 2877 12074 4.20 65 66.3 416 472 4458 9.44 23 24.5 10.72
20 Reggie Bush 2006 2015 1-2 121 96 1274 5493 4.31 35 45.4 652 470 3508 7.46 18 29.0 72.1% 5.38

Sproles just turned 33, and entered the league back in 2005.  He was a rookie at 22, but as a late 4th round pick, he had just 42 career receptions before turning 26.

Bush was the second overall pick in ’06, of course, and he entered the NFL at just 21.  He got off to a blazing start, tying the NFL record for receptions through two seasons set by Larry Fitzgerald. [1]By the end of that season, his teammate Marques Colston broke that record, and A.J. Green, Odell Beckham, and Jarvis Landry have all since broken that Bush’s mark. But Bush has not maintain that level of play, and the future isn’t all that bright. He turned 31 in March, and just signed with the Bills, his 5th NFL team.  Bush had just 4 catches  in five games last year, before an ACL injury in St. Louis ended his season.

Forte, despite being only nine months younger than Bush, he entered the NFL two years later. Forte has been a mix of Bush and Sproles when it comes to the age curve: he started off strong, like Bush, but has aged well, like Sproles.  Forte had 223 receptions in his first four seasons in 60 games; In his last 4 years, he has also played in 60 games, and caught 264 passes.

Despite being the youngest of the three, Forte has the most career receptions.  Bush had more receptions last year, but given the age difference, Forte seems like the better bet to become the 5th running back — and only 3rd non-fullback — to hit the 600-reception mark.

References

References
1 By the end of that season, his teammate Marques Colston broke that record, and A.J. Green, Odell Beckham, and Jarvis Landry have all since broken that Bush’s mark.
{ 11 comments }

Positive Yards Per Attempt (Updated)

Adam Steele is back for another guest post. You can view all of Adam’s posts here. As always, we thank him for contributing.


Last year, I introduced a simple alternative to ANY/A called Positive Yards Per Attempt. Today I’m going to update the formula with a few tweaks and more years of data. For those who don’t feel like reading the rationale behind PY/A provided in the link, it basically boils down to this: The magnitude of a QB’s positive plays are a better indicator of skill than the frequency of his negative plays, and positive plays contribute to winning more than negative plays contribute to losing. With this in mind, PY/A only counts yards and touchdowns while ignoring sacks, interceptions, and fumbles. In the updated version, I split air yards and YAC in the years where data is available. Here is the formula:

1992 – Present
PY/A = (Air Yards + YAC/2 + TD Pass *20) / Attempts

1950 – 1991
PY/A = (Pass Yards * 0.8 + TD Pass *20) / Attempts

The next step is to measure PY/A in relation to league average, which I call Relative PY/A or RPY/A. This is simply PY/A – LgPY/A. After calculating RPY/A for every season back to 1950, I noticed a pattern of dome-playing passers rating higher than they should, so I built a weather adjustment. Based on the conditions of each quarterback’s home stadium, I assigned him a bonus or penalty applied on a per play basis. The weather adjustment is not split by attempts at each stadium during a season, as that would be way too much work. These adjustments are arbitrary and almost certainly wrong, but still better than no adjustment at all. You can see the weather adjustment for each QB in the “Wthr” column of the tables.

Now comes the issue of balancing volume and efficiency. This is handled by adding 200 attempts of replacement level ball to each QB’s season total, with replacement level being LgPY/A – 0.5. I must give credit to Neil Paine for this idea, as it’s based on his method of adding 11 games of .500 ball to a team’s record to estimate their “true” winning percentage. After applying the 200 attempt regression to every QB season, I stumbled onto another problem – early AFL and older NFL seasons were rated too highly. I decided to use the regression step as a double for a depth of competition adjustment. The AFL from 1960-64 and NFL from 1950-59 are hit with a sharper regression than the -0.5 used for modern seasons, with the most severe being -2 for the 1960 AFL.

With all the adjustments factored in, we arrive at the final product – True Relative PY/A (abbreviated with the alphabet soupy TRPY/A). The table below shows the top 200 seasons since 1950: [continue reading…]

{ 15 comments }
Antonio Brown is the Steelers leader in touchdown celebrations

Antonio Brown is the Steelers leader in touchdown celebrations

Is Antonio Brown already the best wide receiver in Steelers history? That depends on how you define “best”, of course. But from at least one statistical standpoint, Brown already stands out as the most dominant.

One of my favorite simple methods to measure dominance is to measure receiving yards above the worst starter. For example, the 32nd-ranked player in receiving yards last year gained 922 receiving yards. Brown, meanwhile, had 1,834. As a result, he had 912 receiving yards above the “worst starter” last year.

In 2014, the 32nd-ranked receiving yards leader gained 916 yards; Brown had 1,698, so that’s +782. In 2013, Brown’s 1,499 yards were 603 yards above the baseline of 896, i.e., the amount of yards gained by the 32nd-ranked receiver.

In 2012, the baseline was 855 receiving yards; Brown, with 787 in 13 games, did not rank in the top 32 in receiving yards. Therefore, he gets a 0 for 2012. Finally, in 2011, Browns’ 1,108 receiving yards were 221 receiving yards above the threshold of 887 yards.

As a result, Brown’s six-year career looks like this: +912, +782, +603, 0, +221, 0. That sums to 2,518 yards above worst starter.

Last year, I looked at the leaders in Adjusted Catch Yards over worst starter using the same formula. I re-ran that methodology using receiving yards and pro-rating non-16 games to come up with a career list. The table below shows the top 200 players in football history using this methodology; Brown checks in at #31: [continue reading…]

{ 3 comments }

Carson Palmer has had a very good career. He first started with the Bengals at age 25, and was a very good quarterback from ages 26 to 28. Over the next 3 years, his play declined to more solid levels, before holding out in Cincinnati and eventually being traded to Oakland. With the Raiders, Palmer was productive at ages 32 and 33, before moving on to Arizona. There, he was productive again at ages 34 and 35, with the latter season being cut short after six games due to a torn ACL. Then, at age 36, he had a career year, with an MVP-caliber season.

Palmer averaged 8.41 Adjusted Net Yards per Attempt last year, which was even better before an ugly performance in a meaningless season finale. The league average was 6.26, and if you define replacement level as 80% of league average, then replacement was 5.01 ANY/A. Palmer had 562 dropbacks last year, and was 3.40 ANY/A above replacement; that translates to being 1908 Adjusted Net Yards above replacement. I used that methodology to chart every season of Palmer’s career; as you can see, 2015 was the best season of his career [continue reading…]

{ 4 comments }

You probably aren’t too surprised by this headline: until 2014, no team had ever repeated as NFC South champions (then the Panthers three-peated last year). From ’03 to ’06, all four teams won the division; then, all four teams won a division title from ’07 to ’10, too. It’s been an inconsistent division, but Carolina is now bringing some stability to the top of the NFC South.

That’s ironic, though, because since realignment and expansion in 2002, no team has been as inconsistent as Carolina. Consider the 2009-2010 Panthers; in ’09, Carolina went 8-8 but had an SRS of +3.9 (the .500 record was the product of an SOS of +3.5). But in 2010, the Panthers went 2-14, with an SRS of -13.2. That’s a change of 17.1 points, which is pretty significant. And over the last three years, Carolina has made two big changes: from +9.2 in ’13 to -3.1 in ’14 to +8.1 last year.

In fact, let’s take a look at how Carolina’s SRS changed in every year since realignment. That means starting in 2003, using the ’02 season as the N-1 year: [continue reading…]

{ 9 comments }

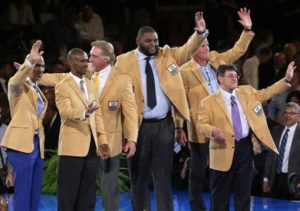
Congrats to the Hall of Fame Class of 2016

Tune in tonight for the 2016 HOF Class Enshrinement

The 2016 Pro Football Hall of Fame Enshrinement Ceremony is tonight.

Congrats to the 2016 Hall of Fame Class, that will be inducted tonight. We spend a lot of time debating and talking about someone’s Hall of Fame worthiness, but today is a day to celebrate and honor some of the game’s best players. We have an 8-person class being enshrined tonight:

[continue reading…]

{ 4 comments }

2016 Coach of the Year Odds

I love the Coach of the Year award, particularly in the pre-season. That’s mostly because it’s such an impossible award to predict.

  • In 2012, I selected Mike Mularkey as my pick. That turned out be very, very wrong, but in COTY predicting, it’s win or go home, so swinging for the fences makes sense.
  • In 2013, I selected Sean Payton; unfortunately for him, a playoff berth was not enough to get him Coach of the Year. That honor instead went to Ron Rivera.
  • In 2014, I chose … Jay Gruden. Washington went 4-12.
  • In 2015, I chose Dan Quinn. That looked good after a 6-1 start, but Atlanta finished just 8-8.

The reason this award is so hard to pick is because in some ways, every coach is on an even playing field in week 1. The winner of this award is the one who usually exceeds expectations the most, so there is a natural equalizer in place. Last year’s winner was Ron Rivera, again, as his Panthers went a surprising 15-1 and wildly exceeded expectations.

Below are the current odds for 2016 Coach of the Year, along with each coach’s percent chance of winning the award once you remove the vig:  [continue reading…]

{ 14 comments }

Checkdowns: Bill Barnwell on Future Hall of Famers

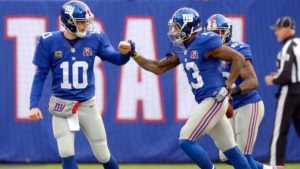
Is there exactly one future HOFer here?

Is there exactly one future HOFer here?

I’m short on time today, but here’s a very fun article courtesy of Bill Barnwell.

There are many interesting tidbits in there, so please feel free to discuss whatever you like in the comments. One thing that stuck out to me was that Barnwell had Odell Beckham Jr. with a slightly higher chance of making the Hall of Fame than Eli Manning. Note that Barnwell’s article is focusing on the “will he” be a Hall of Famer, not the “will he deserve to be” a HOFer. Such distinction is, of course, important.

From one statistical standpoint, Manning is far from a HOFer. Brad Oremland ranked Manning in his top 60, but no higher:

Eli Manning played great in his two Super Bowl appearances, but the other 170 games of his career are pretty close to average. He’s not accurate, he’s inconsistent, and his turnover rate is unacceptable in modern football. Over the past 10 seasons, Eli committed 213 turnovers, by far the most in the NFL. Drew Brees is next (184), and no one else is within 50 of Eli. Manning brought his A-game in the two most important games of his career, and that’s something we should consider when ranking him, but I don’t believe he has a special clutch “ability” other players lack. Despite his “winner” reputation, Manning’s Giants have made the playoffs in only five of his 11 seasons [now 5 of 12], and they’ve lost their first playoff game more often than they’ve won (2-3). Eli is a good player, but he’s not Bart Starr.

Still, Eli feels like he has a decent chance of actually making it to Canton, which is the question here. Beckham? He’s been insanely productive through two seasons, but it’s just two seasons. It feels odd to say he has a higher HOF chance than Eli Manning after two years. Then again, Manning’s entire HOF argument is based on two seasons, so well…. maybe not.

What do you think?

{ 65 comments }

For over two decades, the Green Bay Packers have been lucky to have a Hall of Fame quarterback. How good have things been? Well, last year was only the third time since 1994 that the Packers finished below league average in Adjusted Net Yards per Attempt. But in general, Aaron Rodgers is the best quarterback in the league, and the return of Jordy Nelson should ensure another stellar year for Rodgers.

When discussing Green Bay’s passing attack in the days since the merger, you get a pretty stark split between the pre-Favre/Rodgers eras and the post-Favre/Rodgers eras.  The graph below shows the Packers Relative ANY/A — i.e., the team’s Adjusted Net Yards per Attempt minus the league average ANY/A — in every year since 1970: [continue reading…]

{ 7 comments }

Football Outsiders Almanac 2016

If you’re reading this, chances are you already know about our friends at Football Outsiders and the terrific analysis they provide every year. However, if by some chance you don’t know of them, or maybe you haven’t heard about their outstanding annual book, they now have copies of the 2016 Football Outsiders Almanac available for purchase. The book is jam-packed with FO’s signature data (including game-charting stats), plus the usual stat-geeky essays, team and player previews, and 2016 projections.

Football Outsiders has been a supporter of Football Perspective from the very beginning. But don’t confuse this for charity post: the FOA is a great guide, and I’m sure anyone who buys it will be very happy. It’s one of my favorite reads every year. Here’s the link:

http://www.footballoutsiders.com/store

After working on the Almanac in 2013 and 2014, due to time constraints, I wasn’t able to contribute the past couple of years. But I am still happy to endorse one of the most thorough football products produced every year.

{ 0 comments }
Previous Posts