≡ Menu

This year, Blake Bortles has thrown just one touchdown while playing with the lead. That’s part of a larger development: over his three-year career, Bortles has thrown just four touchdowns while playing with the lead, with half of those coming in what looked like the Jaguars breakout game against the Colts last December.

Bortles has thrown 6 touchdowns while tied, which means his other 58 touchdowns have come while the Jaguars were trailing.  If we count a TD pass while tied as half a TD pass while trailing, and half a TD pass while leading, that would give Bortles 7 touchdown passes while “leading” and 61 touchdowns while “trailing” since he entered the NFL in 2014.  As you might imagine, that’s a pretty significant outlier.

The graph below shows quarterback data since 2014; the X-Axis shows touchdown throws while “trailing” and you can see that Bortles leads the NFL in that category.  The Y-Axis shows TD passes while “leading” and as you could have guessed, Tom Brady leads in that category.  Brady and Bortles represent the two biggest outlier in the entire graph: [continue reading…]

{ 12 comments }

Note: the 2016 Game Scripts page is now updated through week 16.

The big win of the week, not surprisingly, came from the Patriots over the Jets. New England was a 17-point favorite over New York, and won by 38 with a Game Script of +20.6. That’s the third best Game Script of the season.

In the world of misleading final scores, the Cowboys beat the Lions by 21 points, but with a Game Script of only +6.6. The Lions actually led in this game, 21-14, late in the 2nd quarter, and trailed by only 7 with 20 minutes left. Dallas then scored two quick touchdowns, and neither team scored in the final ten minutes.

And the comeback of the week belongs to San Francisco. With 5:14 left, the 49ers trailed by 14 points, facing 3rd-and-10 from the Rams 13-yard line. Colin Kaepernick scrambled for a 13-yard touchdown, the 49ers defense forced a three-and-out, and the 49ers put together their second straight touchdown drive of 73+ yards. Then, the 49ers went for two — which is silly, given that the 49ers didn’t go for 2 after the first touchdown — and Kaepernick scrambled for the conversion. That’s how San Francisco won, 22-21, with a -5.5 Game Script.

Below are the week 16 Game Scripts results: [continue reading…]

{ 4 comments }

Okay, yes, I’m a little late here, but I didn’t want to just forget about week 15. Those expecting week 16 Game Scripts, well, that will be up tomorrow.

Week 15 may feel like a long time ago, so here’s your primer: the Colts destroyed the Vikings, 34-6, and had the best Game Script (+17.8) of the week. Atlanta had a similar margin and Game Script against the 49ers. But the big story were the two upsets of the week.

Houston benched Brock Osweiler and inserted Tom Savage into the lineup after falling behind early against Jacksonville; the Texans trailed 13-0 in the 2nd quarter, and 20-8 late in the third, before ultimately winning 21-20. Houston won with a Game Script of -7.4, the 5th worst Game Script by a winning team all season.

The fourth lowest? That came by Tennessee the same day against the Chiefs. In a game that feels much less relevant now — Tennessee is out of the playoffs, while Kansas City has since clinched — the Chiefs led 14-0 in the first quarter and 17-7 entering the fourth. Kansas City even led 17-16, with the ball, with two minutes to go, but lost on a last-second field goal, 19-17. The final Game Script was -8.0 for the Titans.

Below are the week 15 Game Scripts: [continue reading…]

{ 6 comments }

The Lions began the season 9-4, but have now lost the team’s last two games headed into a winner-takes-the-NFC North showdown with the Packers. Detroit’s success — and failures — have been SOS-related. Detroit’s last two losses came to the two best teams (by record) the Lions have faced all year: the 13-2 Cowboys and 10-5 Giants. And the 9-4 start came with Detroit going 8-1 against teams with a losing record and 1-3 against teams with a winning record. To date, the only wins for the Lions this year against a team with a winning record was a 20-17 home victory over 8-6-1 Washington where Detroit had the ball, down 4, at its own 25, with 1:05 remaining. The Lions have done well by beating bad teams, but if Detroit loses to Green Bay, that unlikely win over the Redskins will be the only impressive win the team has all year.

Eight teams have finished with a winning record, missed the playoffs, and also lost at least their last three games.

  • The final season of Dan Fouts’ career was an odd one. The 1987 Chargers lost their first game, but went 3-0 during the replacement games with Rick Neuheisel and Mike Kelly at quarterback. Then, with Fouts and the regular starters back, the Chargers ran their record to 8-1… before losing their final seven games of the season. San Diego went from 8-1 to eliminated from the playoffs even before the final game of the year, and ended with an 8-7 record.
  • The 1993  Dolphins began 9-2, even though Dan Marino was lost for the season after five games with a torn achilles.  But the 9th win came in the Leon Lett game, and Miami didn’t win another game the rest of the year, while the Cowboys didn’t lose another game that season.  A 5-game losing streak to end the season was particularly painful for the Dolphins, who lost a tiebreaker at 9-7 to two other AFC teams to miss the playoffs.
  • The 2008 Bucs collapsed down the stretch, which resulted in Jon Gruden  losing his job. Tampa Bay began 9-3, but lost their final four games in embarrassing fashion. The Bucs allowed three 4th quarter touchdowns to Carolina to lose 38-23, lost a heartbreaking in overtime to Atlanta, lost by 17 to the Chargers, and then blew a 10-point 4th quarter lead as 10.5-point favorites to the Raiders.
  • The 2002 Saints, 2000 Jets, 1996 Chiefs, 1971 Lions, and 1970 Cardinals all lost their final three games and missed the postseason.  New Orleans, New York, and Kansas City all started 9-4, while Detroit was 7-3-1 and St. Louis was 8-2-1.

[continue reading…]

{ 5 comments }

Matt Ryan Is Having A Historically Great Season

Matt Ryan leads the NFL in the following categories:

  • Touchdown Rate, at 6.8%
  • Yards per Attempt, at 9.3
  • Adjusted Yards per Attempt, at 10.0
  • Yards per Completion, at 13.3
  • Passer Rating, at 115.5
  • Net Yards per Attempt, at 8.21
  • Adjusted Net Yards per Attempt, at 8.90

Ryan also ranks 3rd in passing yards and 3rd in passing touchdowns, despite leading in the rate versions of those categories, because Ryan only ranks 18th in pass attempts, and that’s despite not missing any games. The Falcons rank 27th in pass attempts.  The Falcons rank 12th in rushing attempts, but only rank 25th in total plays.

Why is that? Well, Atlanta only ranks 27th in offensive drives.  And why is that? One reason is that the Falcons defense isn’t good at getting off the field. The Falcons defense is allowing 6.1 plays per drive, at a 2:45 minute clip per drive, and resulting in 2.18 points per drive. All three of those metrics place Atlanta in the bottom quarter of the league, as does Atlanta’s 41.6% third down rate.  Even worse, the Falcons have the worst red zone defense in the league.

The Falcons have also scored 5 return touchdowns this year, which negated five potential possessions for the offense.  But there’s another reason Atlanta has so few drives and plays this year: the offense is really, really good. Just 55 drives have ended in a punt or turnover this year, the fewest in the league.  The Falcons are also the only team to have over half of its drives end in a score. If Atlanta had more three-and-outs, they’d have more drives and maybe more plays, but completed passes keep the clock running.

If the Falcons had a better defense, Ryan would probably have more pass attempts this year, and he might be producing some better raw numbers. If he had 5,200 passing yards, it would be clearer to the average fan that this is a historically great season. And because Atlanta tends to run near the goal line, the team ranks 3rd in rushing touchdowns, which depresses Ryan’s touchdown totals (though provides some assistance to his yards per attempt numbers). Instead, we have to focus on his rate numbers.  So, which league-leading rate number is the best? [continue reading…]

{ 109 comments }

Oakland is going to the playoffs, but the Raiders will do so without starting quarterback Derek Carr. The third-year quarterback had a breakout season, driven in large part by his ability to minimize bad plays: Carr leads the NFL with a 2.8% sack rate, and his 1.1% interception rate ranks 4th in the league. Oakland went 12-3 in games started by Carr, but after breaking his fibula in a win over the Colts, the Raiders are now turning to Matt McGloin to lead them in the postseason. [Update: With McGloin hurt, Connor Cook will now be making his first career NFL start in the playoffs, the first quarterback to do that since at least 1950.]

Oakland isn’t the only team switching quarterbacks as we enter January. Houston started massive bust Brock Osweiler for the first 14 games of the season, and were rewarded with the worst quarterback play in the NFL. The Texans turned to Tom Savage early in the Jaguars game last week; Savage led Houston to a come-from-behind victory to earn the starting job. He struggled against Cincinnati in his first start, but he’s going to be the guy in the playoffs despite starting just one or two games all year (Houston could, in theory, rest Savage this week, as the Texans are locked in to the 4 seed).

Finally, there are the Miami Dolphins. After years of “will he or won’t he?” play from Ryan Tannehill, the Dolphins are finally going to the playoffs…. but maybe without Tannehill. The perennially on-the-verge-of-breaking-out quarterback sprained his ACL and MCL against Arizona three weeks ago, leading his status for the playoffs in doubt. But backup Matt Moore led a game-winning drive against the Cardinals, excelled against the Jets, and was up-and-down in an overtime win against Buffalo on Sunday.

Assuming Moore starts in the playoffs, he’ll be the third quarterback this season to start a playoff game despite fewer than six regular season starts. Here’s every example in NFL history where that happened: [continue reading…]

{ 4 comments }

Are Teams Not Throwing Enough Interceptions?

In before the first “Well the Jets sure are” comment…..

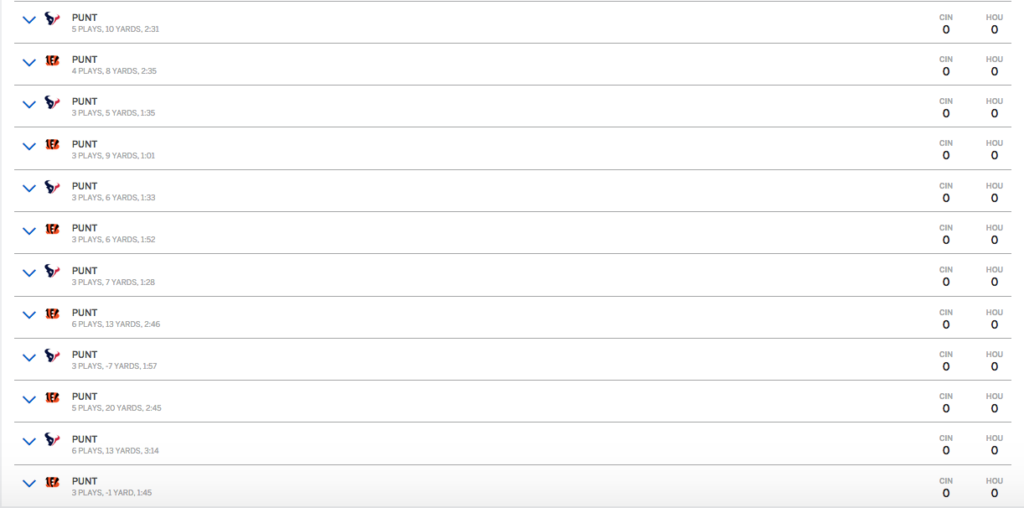
On Saturday night, the Texans/Bengals game opened with 12 straight punts. Here’s the drive chart, in reverse chronological order, after twelve drives:

[continue reading…]

{ 10 comments }

We’re a fan of progressive leaderboards here at Football Perspective, and it’s time to take a look at the all-time single-season leaders in completion percentage.

Officially, Sammy Baugh was the single-season leader in completion percentage from 1945 to 1981, as he completed 70.3% of his passes in 1945. To qualify for the completion percentage crown, a player needs to throw at least 14 passes per team game, or 224 passes in a 16-game season. Baugh threw 182 passes in 1945, during a ten-game schedule for the Redskins, though Baugh himself missed two games. But let’s up the minimum to 224 passes, since completion percentage can be misleading over a small sample size. That’s certainly not “fair” to Baugh, but this is a fun post designed to look at the progressive leaders in history, so omitting everyone from ’45 to ’81 would be pretty boring.

In 1942, Sammy Baugh completed 58.7% of his passes for the Redskins. Washington went 10-1, finishing 3rd in points and 3rd in yards in a 10-team league, and won the NFL championship. As a team, Washington finished 3rd in ANY/A, too.

That record held for five years, until 1947, when Baugh completed 59.3% of his passes. [1]Over in the AAFC, Otto Graham completed 60.6% of his passes, but I’m going to ignore the AAFC today. But it didn’t come with much success: the team finished 4-8, thanks to a very bad defense. Still, don’t blame Baugh: Washington finished 4th in points and 2nd in yards, and easily led the NFL in ANY/A. But the pass defense was nearly as bad as the pass offense was good, and the team lost 13 more fumbles than it recovered, leading to the bad record.

In 1953, Otto Graham smashed the non-Baugh record, completing 64.7% of his passes for the Browns in one of the greatest passing seasons of all time. The Browns had an unreal +5.0 Relative ANY/A that season, and began the season 11-0 before losing the team’s final two games.

In 1974, Ken Anderson completed 64.9% of his passes as part of a strong season for the Bengals. Cincinnati had a good passing offense — it finished in the top 5 in ANY/A — but the team finished just 7-7, in part because the defense finished last in takeaways. [continue reading…]

References

References
1 Over in the AAFC, Otto Graham completed 60.6% of his passes, but I’m going to ignore the AAFC today.
{ 5 comments }

Non-Offensive Touchdowns

This year, the Chiefs have returned four interceptions for touchdowns, and also scored via a fumble return, kickoff return, and punt return. That’s seven non-offensive touchdowns for Kansas City, the most in the league. In addition, Kansas City hasn’t allowed a single non-offensive touchdown, so the Chiefs obviously lead the league in net non-offensive touchdowns: [continue reading…]

{ 6 comments }

Guest Post: Wide Receivers and the Hall of Fame

Today’s guest post comes from one of the longest followers of this blog (and its predecessor), Richie Wohlers. Richie is 44-year-old accountant from Southern California who is a Dolphins fan despite never being to Florida. As always, we thank our guest posters for contributing.


Previously, I looked at linebackers and centers in the Pro Football Hall of Fame. With Andre Johnson’s recent retirement announcement, I thought it would be a good idea to take a look at wide receivers next. As before, I am just taking a look at post-merger players by using some objective factors to try to get a picture of what a typical HOFer looks like. Those factors are All-Pros, Pro Bowls, Weighted AV, Total AV, Super Bowl Appearances and Super Bowl wins). I am going to classify all players into a single position for simplicity. If you are interested in knowing the details of my calculation, see footnote. [1]Methodology: For All-Pros, Pro Bowls, Career AV and Total AV, I am looking at the average numbers for each player at his position. In an attempt to make the average HOFer at a position worth 100 … Continue reading

I explored the relationship between statistics (receptions, yards, touchdowns) and HOF induction for WRs, and it doesn’t improve the correlation. My “Career Score” is more aligned with HOF inductions than any single receiving statistic. The correlations are hurt by weak stats from HOFers like Swann and Hayes. And they are also hurt by big numbers from non-HOFers like Henry Ellard, Harold Jackson and Football Perspective hero Jimmy Smith. [continue reading…]

References

References
1 Methodology: For All-Pros, Pro Bowls, Career AV and Total AV, I am looking at the average numbers for each player at his position. In an attempt to make the average HOFer at a position worth 100 points, I am assigning a weight of 16.6 for each category (16.6 times 6 categories equals 99.6 points). If an average player had 5.7 All Pros I divided 16.6 to get 2.9. So each All Pro is worth 2.9 points at that position. Super Bowls are the exception. I’m just going with a straight points system. One appearance is 8 points, 2 appearances is 14 points, 3 appearances is 18 points, and then 2 more points for each additional appearance. Super Bowl wins are worth 12, 20, 26, 30 and then 2 more per additional win. I add them up for a “Career Score”.
{ 43 comments }

Yes.

Take a look at the Broncos pass defense this year, compared to the Broncos pass defense last year:

Year Tm G Cmp Att Cmp% Yds TD TD% Int Int% Y/A AY/A Y/C Y/G Rate Sk Yds NY/A ANY/A
Sk% EXP
2016 DEN 14 260 483 53.8 2562 10 2.1 12 2.5 5.8 5.1 10.7 183.0 67.5 40 221 4.9 4.2 7.6 72.16
Year Tm G Cmp Att Cmp% Yds TD TD% Int Int% Y/A AY/A Y/C Y/G Rate Sk Yds NY/A ANY/A
Sk% EXP
2015 DEN 16 344 573 60.0 3193 19 3.3 14 2.4 6.2 5.7 10.3 199.6 78.8 52 351 5.1 4.7 8.3 59.89

Three years ago, I looked at the Seattle pass defense and calculate how many standard deviations above average the Seahawks were. At the time, I compared them to an average of the other 31 defenses rather than an average of all 32 defenses, including themselves. I don’t know if there’s a right or wrong answer there, but I’m going to use the latter methodology today, which will explain why the numbers are slightly different.

Anyway, Seattle was 2.80 standard deviations above average in ANY/A allowed in 2013. That’s because Seattle’s pass defense allowed 3.19 ANY/A, while the league average was 5.89 ANY/A. That’s a difference of 2.70 ANY/A, and the standard deviation among the 32 pass defenses that year was 0.97. Divide 2.70 by 0.97, and you see that Seattle was 2.80 standard deviations above average.

The 2016 Broncos? They are allowing just 4.25 ANY/A. That is over a full yard “worse” than Seattle, but worse needs to be put in quotes. For starters, the league average is 6.25 ANY/A this year; in addition, the rest of the league is bunched together. The standard deviation for the 32 pass defenses is 0.74 ANY/A. That means the Broncos have a Z-Score of 2.69 standard deviations better than average (here, negative is better).

That puts Denver as the 5th best pass defense, by this metric, since 1970: [continue reading…]

{ 11 comments }

Which Teams Are Trending Up Or Down?

The Eagles have outscored their opponents by 17 points this year, but Philadelphia is obviously trending in the wrong direction. The Eagles began 3-0 with wins of 19, 15, and 31 points, but have now lost five games in a row.

So what if instead of using traditional points differential, what if we used a weighted version based on when the game occurred? To do this, we multiply the Eagles points differential in each game this season by the game number; that means the team’s third game counts for three times as much as the first game, and the ninth game counts for three times as much as the third game. With 14 games so far this year, to determine the team’s weighted points differential, we sum the weighted results and divide by 105 (14+13+12+11…+1).

By doing this, Philadelphia’s points differential moves from +1.21 to -3.72. Here’s how: [continue reading…]

{ 4 comments }

Browns Continue To Lose … Against the Spread, Too

Cleveland is 0-14 this year, but that’s maybe not the saddest stat of the Browns season. Everyone expected Cleveland to be bad, but Cleveland has also been really bad relative to expectations. After losing against on Sunday to the Bills, and again failing to cover against the spread, the Browns are now just 2-12 against the spread this season.

Cleveland covered in games against the Dolphins and Titans early in the year, but the Browns have now failed to cover the spread in eight straight games. The graph below shows the number of points Cleveland was expected to lose by in black, and the actual points differential in orange. Since the Browns have been underdogs and lost every game, the range goes from 0 to -30: [continue reading…]

{ 2 comments }

Are The Dolphins the New Texans?

Fresh off of Miami’s largest win of the season — and only the team’s second win by more than 7 points — it might seem like an odd time to question the Dolphins. But Miami is now 9-5 and has now only outscored opponents by 1 point. That’s right: it took a 21-point win over the Jets to finally put Miami’s points differential in the black. Miami lost by 32 to Baltimore, which obviously stands out as a big outlier, but the team also lost by 15 to Cincinnati and 13 to Tennessee. And while it doesn’t impact the team’s points differential by much, another loss came by 7 to New England despite a Game Script of -15.6.

A few weeks ago, I asked if the Texans were the worst 6-3 team ever. We may be getting to that point now regarding the 9-5 Dolphins. According to Pro-Football-Reference.com, Miami has also faced the second easiest schedule in the league this year, behind only the Patriots. Miami gets to face the bad NFC West, the mediocre NFC North, and has had two games against the Jets already. Five of Miami’s nine wins came against the Jets, Browns, 49ers, and Rams, and three more came against below .500 teams. As a result, combine a weak SOS and an average MOV, and the Dolphins have a negative Simple Rating System grade.

The graph below shows each team’s winning percentage on the X-Axis, and SRS on the Y-Axis.  The farther south of the trend line, the more a team is “overachieving” in record relative to SRS (think Miami, Detroit, and the Giants), and the farther north of the trend line, the more a team is “underachieving” in record relative to SRS (think Philadelphia, San Diego, Atlanta). [continue reading…]

{ 3 comments }

What Can We Expect from Bryce Petty?

Tonight’s game between the Jets and Dolphins certainly falls short of any threshold necessary for primetime television.  That said, for Jets fans, is there anything to get excited about with Bryce Petty?  What does he need to show over the final three games to enter 2017 as part of the conversation for quarterback of the future?

Petty was a 4th round pick who didn’t play last season; his first start came in New York’s 10th game this season, and he will likely that he’ll finish the year with five starts.

Since 1990, here are the quarterbacks who were drafted in the 3rd round or later, didn’t start in the first half of their rookie season, but started at least 3 games in the second half of that season.  Petty wouldn’t meet this definition, but I wanted to run the numbers for context:

Nick Foles
Ryan Lindley
T.J. Yates
John Skelton
Keith Null
Charlie Frye
Ryan Fitzpatrick
Luke McCown
Mike McMahon
Kent Graham
Tom Hodson

Okay, not exactly a promising group there.  What about players more like Petty — 3rd round or later, didn’t start a game in their rookie year, then didn’t start again until the second half of the season of their second season, and started at least 3 games?

Brodie Croyle
Scott Zolak
Bobby Hoying
Aaron Brooks
Koy Detmer
A.J. Feeley
Derek Anderson
A.J. McCarron
Josh McCown

A couple of promising names there, perhaps, with Brooks (at least to me) sticking out as the most promising case. Over the second half of the ’00 season, Brooks ranked 8th in AY/A.  As for Petty? He hardly has shown much yet: he currently ranks last in Adjusted Yards per Attempt over the second half of the year.  But if he has any chance of throwing his hat into the 2017 ring, it starts tonight.

{ 5 comments }

There were 15 quarterbacks selected in the 2016 NFL Draft. Two notable ones were Big 10 stars Christian Hackenberg and Connor Cook.

Hackenberg had an impressive freshman year at PSU, then regressed significantly. He had the tools but not the resume, making him one of the more polarizing prospects out there. The Jets drafted him 51st overall. Last year, Penn State went 7-6; this year, without Hackenberg, the team went 11-2. That represents an increase in winning percentage of 0.308.

Meanwhile, Cook led the Spartans to a 12-2 record last year. This year, without Cook and a number of other veterans, Michigan State collapsed, going 3-9. That’s a decline in winning percentage of 0.607. That’s the second largest decline, behind Mississippi State post-Dak Prescott.

Here were the 15 quarterbacks drafted:

And here is the record of their college teams last year and this year, through Dec. 15:

RdPkTeamQuarterbackSchool2015 Win%2015 Rec2016 Win%2016 RecDiff
251NYJChristian HackenbergPenn State0.5387-60.84611-20.308
393CLECody KesslerSouthern California0.5718-60.759-30.179
6191DETJake RudockMichigan0.76910-30.83310-20.064
6187WASNate SudfeldIndiana0.4626-70.56-60.038
4139BUFCardale JonesOhio State0.92312-10.91711-1-0.006
126DENPaxton LynchMemphis0.6929-40.6678-4-0.025
6201JAXBrandon AllenArkansas0.6158-50.5837-5-0.032
391NWEJacoby BrissettNorth Carolina State0.5387-60.56-6-0.038
12PHICarson WentzNorth Dakota St.0.92912-10.86713-2-0.062
6207SFOJeff DriskelLouisiana Tech0.6929-40.6158-5-0.077
7223MIABrandon DoughtyWestern Kentucky0.85712-20.76910-3-0.088
5162KANKevin HoganStanford0.85712-20.759-3-0.107
11LARJared GoffCalifornia0.6158-50.4175-7-0.198
4135DALDak PrescottMississippi State0.6929-40.4175-7-0.275
4100OAKConnor CookMichigan State0.85712-20.253-9-0.607

Let’s be clear: wins and losses aren’t a great way to measure a quarterback, and there’s a ton of noise in the data before you start comparing teams across seasons. Connor Cook on the 2016 Spartans wouldn’t have made Michigan State 12-2. That said, I find this stuff interesting in at least a trivia perspective. But maybe there’s a bit more to it, too. What do you think?

{ 3 comments }

Here are the top 6 teams in Net Yards per Pass allowed: Denver, Minnesota, Arizona, Jacksonville, the Giants, and the Rams. Those teams rank 21st, 22nd, 25th, 28th, 18th, and 29th, respectively. The Patriots (3rd in NY/A, 10th in NY/A allowed) are the only team to rank in the top ten in both categories, and Cincinnati of all teams (12th, 12th) is the only other team to rank in the top 12 in both categories.

The graph below shows each team’s rank in the simplest of categories: net yards per attempt on offense is on the X-Axis, and net yards per attempt allowed is on the Y-Axis.

Because the best teams have high NY/A averages and low NY/A allowed averages, the correlation coefficient between NY/A and NY/A allowed would be negative if the league was very top-heavy: that is, if the best teams were great at both metrics, and the worst teams were bad at both metrics, the correlation coefficient among all teams in these categories would be closer to -1.0. Instead, the correlation coefficient this year among teams is 0.10, indicating a weak but positive relationship.

{ 5 comments }

The Falcons blew out the Rams in week 14 in one of the most embarrassing games of the season. Atlanta was up 21-0 at halftime, 28-0 early in the third quarter, and then 42-0 entering the fourth quarter. Two late Los Angeles touchdowns muted the final score, but the 22.0 Game Script tells all.

That was the second biggest Game Script of the season, but it was also only the second most notable Game Script of the week. That’s because of the crazy Jets/49ers game. San Francisco scored two early touchdowns, taking a 14-0 lead in the first four minutes of the game! The 49ers led by 11 or 14 points for the next 50 minutes of game action, too. But New York scored a touchdown, a two point conversion, and a field goal in the second half of the fourth quarter, and ultimately won in overtime, 23-17. Even considering the six plus minutes of overtime, the 49ers finished with a Game Script of +11.5. That’s the largest Game Script of any team that lost since at least 2012, and maybe longer.

Below are the full Game Script results from week 14:

TeamH/ROppBoxscorePFPAMarginGame ScriptPassRunP/R RatioOp_POp_ROpp_P/R Ratio
ATL@RAMBoxscore42142822322556.1%442365.7%
GNBSEABoxscore38102815.2263046.4%422661.8%
CIN@CLEBoxscore23101312.9323845.7%312258.5%
CARSDGBoxscore28161211.8293843.3%442068.8%
TENDENBoxscore131038.9234235.4%54985.7%
PIT@BUFBoxscore272078.8314242.5%301862.5%
MIAARIBoxscore262336.7263145.6%362757.1%
NWEBALBoxscore302376.5392660%541479.4%
KANOAKBoxscore211386.3262749.1%423058.3%
TAMNORBoxscore161156.2283544.4%421672.4%
HOU@INDBoxscore221753.3264138.8%461575.4%
MIN@JAXBoxscore251693342954%412463.1%
DETCHIBoxscore201731.5382857.6%331766%
WAS@PHIBoxscore27225-1.2232350%502566.7%
NYGDALBoxscore1073-2.9313348.4%402561.5%
NYJ@SFOBoxscore23176-11.5414050.6%282750.9%

There have been some games that followed a similar pattern to 49ers/Jets, but what makes that game stand out is how San Francisco was up 14-0 with 11 minutes left in the first quarter. In fact, I only see 25 games since 1998 where a team ran an offensive snap down 14 with over 55 minutes left in the game; the Jets were the fifth to win such a game, with the Giants the previous last such team to do so.

As always, please leave your thoughts in the comments. And the 2016 Game Scripts page is now updated.

{ 7 comments }

Carson Palmer’s Decline Has Been Severe

In 2015, Carson Palmer finished first in ANY/A, as did his Arizona Cardinals. It was a magnificent passing season for Palmer, who was 36 years old last season. In the offseason, I noted that it was a big outlier, but there were a couple of ways you could interpret the data:

If you’re a Palmer fan, the results here can both show how much of an outlier Palmer is, but also might be considered inspiring. Peyton Manning was really good at age 36 and then historic at age 37; Gannon and Steve Young had great years at 36, and then were even better at age 37. The same goes (with a slightly lower baseline) for John Elway, Kurt Warner, and Tom Brady. Supporting cast is undoubtedly a big part of this, and Palmer seems to be playing with one of the best ones. The wildcard in the room is how much his meltdown in the NFC Championship Game impacts him mentally.

The general rule of thumb, I think, for an older quarterback is to project them to be OK until they aren’t. What does that mean? Well, I think of Adam Harstad’s mortality tables. Just because a quarterback is old doesn’t mean he’s going to have a 5 or 10% decline: guys like Manning, Gannon, Young, Elway, Warner, Brady, and Brees are examples of that. But once that decline hits, it’s often severe and permanent. For now, though, Palmer is still one of the rare quarterbacks who had his best season at age 36.

Well, we have our answer. While teams like the Texans, Panters, and Jets have suffered notable declines in the passing game, all three teams are dwarfed by the decline in pass efficiency endured by the Cardinals this season: [continue reading…]

{ 22 comments }

538: Le’Veon Bell’s Historic Performance

Breaking news: Le’Veon Bell is really, really good.  In terms of yards from scrimmage, he had a top-10 performance on Sunday, which has catapulted him to a top-2 season, and into a top-1 career. Today at 538:

Bell’s average of 161.6 yards from scrimmage isn’t remarkable for 2016 alone. If it were to stand through the end of the regular season, Bell’s 2016 performance would rank as the second-highest single-season average since 1932.

This may be Bell’s best season, but he has been a yards from scrimmage monster for much of his career. In 45 career games, Bell has 3,830 rushing yards (85.1 per game) and 1,952 receiving yards (43.4 per game). That translates to 128.5 yards from scrimmage per game for his career, which would be the highest career average since 1932.

You can read the full article here.

{ 1 comment }

Week 14, 2016: Gameday Thread

What’s on your mind today? What do you see happening in today’s games? Post your comments below.

{ 9 comments }

A number of teams produced blowout wins in week 13, with two of those games coming on national television.  The Colts destroyed the Jets on Monday Night Football, 41-10, with a Game Script of +19.9 in a game that was never close. The Ravens murdered the Dolphins, 38-6, producing a Game Script of +18.1. And the Seahawks had a Game Script of +16.8 in a Sunday Night massacre against Carolina.

Only two teams won with negative Game Scripts: Oakland trailed Buffalo for much of the game, and was down 24-9 halfway through the third quarter. The Raiders ultimately won by two touchdowns, despite a Game Script of -1.1. The biggest comeback belonged to Tampa Bay, who won with a -2.2 Game Script in San Diego. The Chargers led for most of the game, including with a 21-17 lead entering the fourth quarter. The Bucs scored 11 points in the final frame to pull out the victory.

Below are the week 13 game scripts: [continue reading…]

{ 0 comments }

538: Is the AFC South Not As Terrible As We Think?

Today at 538: Is the AFC South suddenly not as terrible as we all think? Did you know: the AFC South had a better record this year than the NFC West?

Titans offense

Tennessee has turned into one of the most fun teams in football. After an uneven first month, second-year quarterback Marcus Mariota has been incredible. I looked at stats for each quarterback starting with his team’s fifth game and ending with the 12th. Over that span, Mariota led the NFL in both passer rating (117.7)5 and touchdown passes (21), while throwing just three interceptions. The Titans led the NFL in scoring in that same period, finishing with 8 more points than the New England Patriots have scored since Tom Brady’s return. For the season so far, DeMarco Murray is secondin the NFL in rushing, and the Titans rank third in both rushing yards and yards per carry. Tennessee’s offense will be tested in their next two games, against the Denver Broncos and Chiefs: If the Titans win, the AFC South may be sending the hottest offense in the league to the playoffs.

You can read the full article here.

{ 2 comments }

In 2012, the Atlanta Falcons were 11-1 through 13 weeks, just like the Cowboys are this season. And just like this year, the NFC, no other team had more than 8 wins at that point, with an NFC West squad — then, the 49ers, this season, the Seahawks — holding the second best record at 8-3-1.

Through 13 weeks, how often does a team lead its conference by at least 2.5 games?  I am defining through 13 weeks to mean:

  • In 1993, to mean through 14 weeks, since there were two weeks of byes that year.
  • From 1970 to 1989, to mean through 12 weeks, since there were zero bye weeks before 1990.
  • From 1990 to 2016 (1993, excepted), to mean through 13 weeks! That’s simple, isn’t it?

That gives us 94 seasons to analyze conference data in the post-merger era. This year, the Cowboys are at +2.5, while the Raiders and Patriots are tied at 10-2 in the AFC; that means the AFC leader is at +0. On average, the #2 team in a conference has been 1.1 games behind the #1 team in the conference through 13 weeks. Here is the breakdown: [continue reading…]

{ 0 comments }

Jeff Fisher and the Losingest Coach Kings

Bryan Frye once chronicled the NFL’s passing kings: that is, the career leaders in passing touchdowns throughout every year in NFL history. There are ten men who have been the career leader in touchdown passes, but only eight (soon to be nine) men who can say that they, at one point, had the most losses of any head coach in pro football history. Let’s begin in the natural place: the beginning.

Ted Nesser (1920-1921): 14 career losses

Nesser was the head coach of the Columbus Panhandles in the inaugural 1920 season of the APFA, the predecessor to the NFL. The Panhandles lost their first five games, and finished the season with the most losses in the league. The next year, Nesser’s Panhandles again led the league in losses (8), before the team moved on without him for the 1922 season.  Nesser was a great player — he made the PFRA’s Hall of Very Good — but was 37 by the time he came to the Panhandles as player/coach.

Jim Thorpe (1922-1925): 25 career losses

Yes, that Jim Thorpe took over from Nesser as the career leader in losses. Thorpe also coached in 1920, and by the end of the ’22 season, he was at 15 career losses. He held the title of losing coach in pro football history for four more years — even though he was done coaching after ’23 — finishing his career with 25 losses.

Carl Storck (1926-1928): 26 career losses

Probably the last name on the list you won’t recognize, Storck coached the Dayton Triangles from 1922 to 1926.  He had a winning record his first year, but went just 4-23-4 the rest of his career.  In his last game as a head coach, in 1926, he finally passed Thorpe for most career losses. [continue reading…]

{ 9 comments }

Today at 538: A look at how bad the Rams offense has been under Jeff Fisher.  After a 3-1 start this year, things have quickly gone downhill.

Since then, L.A. has gone 1-7, with the lone victory coming in a 9-6 snoozer against a bad Jets team featuring quarterback Bryce Petty in his first NFL start. And if there’s a theme to the Rams’ unyielding mediocrity under Fisher, it’s a bad offense that seems to get worse the more resources it’s given.

L.A. ranks last in scoring, yards and first downs, and in the case of the latter two categories, for the second year in a row.

You can read the full article here.

{ 3 comments }

Week Fourteen NCAA SRS Rankings: Alabama Finishes #1

The college regular season is over, other than Army/Navy this weekend. Let’s start with a review of the final week of the season for the B12, and the conference championship games for the rest of major college football.

Washington’s destruction of Colorado lead the way, while yet another Alabama blowout only comes in second due to the weaker opponent (yes, Florida is nearly ten points worse than Colorado; 2016 is weird). Also, Temple with a huge upset win over Navy comes in third. [continue reading…]

{ 1 comment }

Week 13, 2016: Gameday Thread

Behind Dak Prescott, Ezekiel Elliott, and an incredible offensive line, the Dallas Cowboys running game has been really, really good. In week 1, Dallas was outrushed by the Giants in the team’s only loss this year, 113-101. But since then, the Cowboys have outrushed their opponent in every game.

No team has ever outrushed its opponent in all 16 regular season games. And only two teams have outrushed their opponent in 100% of all games, with both instances occurring in 1969. Ironically, one of those teams was the Cowboys, who led the NFL in both rushing yards and rushing yards allowed; on average, Dallas outrushed its opponents that year by 88 yards per game. Calvin Hill and Walt Garrison powered the offense, while Bob Lilly, George Andrie, Lee Roy Jordan, and Chuck Howley were the stars of the front seven.

In the AFL, Kansas City did the same thing in every game that year, including the playoffs. Like Dallas, the Chiefs led their league in both rushing yards and rushing yards allowed; for KC, a three-headed monster of Mike Garrett, Robert Holmes, Warren McVea handled the load on offense, while just about everyone was a star in the KC front seven.  No, really: Curley Culp, Buck Buchanan, Bobby Bell, and Willie Lanier all made the Pro Bowl, and Jerry Mays (Pro Bowler every year from ’64 to ’68) and Jim Lynch (’68) were Pro Bowlers the prior year. [continue reading…]

{ 23 comments }

The Browns Are 0-12…. In the ANY/A Battle, too

You know the Browns are 0-12, and you know that the Browns are not very good at passing or stopping the pass.  Cleveland is 31st in the league in Adjusted Net Yards per Attempt (ahead of only the Texans), and 31st in the league in Adjusted Net Yards per Attempt allowed (ahead of only the Colts).

But did you know that Cleveland has had the worse ANY/A in every game this season? Take a look at the ANY/A for Cleveland’s offense (in brown) and defense (in orange) from each game this year: [continue reading…]

{ 8 comments }

Today at 538: The Cowboys started the year 9-1 against the spread; the Browns, meanwhile, can’t seem to beat anyone, even with the help of Las Vegas:

On the other end of the spectrum are the Cleveland Browns, who have the league’s worst record against the spread. Cleveland has been an underdog in all the games it’s played so far this season (12), the only team in the league with that distinction. (On average, the Browns have been underdogs by 7.1 points.) It’s been an ugly season for Cleveland — remarkable not only because the Browns have failed to win a game but also because they are just 2-10 against the spread!

Since 1978, 20 teams (including this year’s Browns) have been underdogs in every game. And the majority of those teams were even larger underdogs, on average, than Cleveland has been. So these were really bad teams. But none was as bad against the spread as Cleveland has been so far this season: Among those 19 other teams, the worst record was a more respectable 5-11, set by another Browns team, the one from 16 years ago:

You can read the full article here.

{ 0 comments }
Previous Posts