≡ Menu

On Saturday, I noted that Matt Ryan and Tom Brady were the top two quarterbacks in ANY/A in 2016, setting up a rare Super Bowl matchup of the two leaders in that metric. The Falcons and Patriots offenses as a whole also rank 1st and 2nd in ANY/A: Matt Ryan averaged 9.03 ANY/A, and since he handled all but 3 of the Falcons pass attempts this year, you won’t be surprised to know that the Falcons offense averaged 9.01 ANY/A. Brady averaged 8.81 ANY/A, but of course missed four games due to a suspension; the Patriots team ANY/A was 8.46, still good enough for second-best in the NFL.

But as regular readers will remember, the Falcons and Patriots don’t just rank 1-2 in ANY/A; they rank first and second in ANY/A differential, too. Atlanta’s ANY/A differential was 2.70 (9.01 on offense, 6.31 on defense), just a hair ahead of New England (8.46, 5.78, net of 2.68). No other team was within 1 ANY/A of those two, making them the clear best teams in the NFL in ANY/A differential. [continue reading…]

{ 19 comments }

Best Offensive/Defensive Super Bowl Matchups

Three years ago, I wrote about how the Broncos/Seahawks Super Bowl was going to be the best matchup between offensive and defensive teams in Super Bowl history. This year doesn’t quite match that hype — particularly given that the Patriots defense isn’t as good as you might think, and that New England is actually more of an offensive team than a defensive team. If anything, this Super Bowl should be remembered as a matchup of two great passing attacks, rather than an offensive/defensive showdown.

But if we want to just look at points scored and points allowed, then yeah, this still stands out as a pretty good matchup of the number one scoring team in the NFL (Atlanta) against the number on team in points allowed (New England). The Falcons scored 33.8 points per game this year, while the Patriots allowed just 15.6; that produces a differential of 18.1 (difference due to rounding), which would make this the 5th best “offense/defense showdown” in Super Bowl history: [continue reading…]

{ 2 comments }

Super Bowl Streaks And Conference Affiliation

The NFL and the Lombardi Packers won the first two Super Bowls. Then, each conference went on a long streak:

  • The AFL/AAFC won 11 of the next 13 Super Bowls (1968-1980): the Jets and Chiefs closed out the AFL with Super Bowl upsets, while the Steelers, Dolphins, and Raiders carried the AFC.
  • Then, from 1981 to 1996, the NFC won 15 of the next 16 Super Bowls, with the 49ers and the NFC East teams (well, not all of them) carrying the conference to 13 of those titles.
  • The balance shifted then to the AFC, as the conference won 8 of the next 10 Super Bowls (1997 to 2006).  The Patriots won three of those, but perhaps most surprising was that the run ending with 18-0 New England losing as heavy favorite to the Giants.

Since then? The NFC went on a mini-run, winning 6 of 8 Super Bowls from 2007 to 2014.   The AFC has responded by winning the last two Super Bowls, and the conference is again a favorite in Super Bowl LI. Here are the results in graphic form, with NFL/NFC wins in blue, and AFL/AFC wins in red: [continue reading…]

{ 9 comments }

The two leaders in ANY/A in 2016.

Matt Ryan and Tom Brady finished the season ranked 1st and 2nd in the NFL in Adjusted Net Yard per Attempt. How unusual is that?

  • In 1966, Bart Starr led the NFL in ANY/A and was the NFL MVP. Len Dawson led the AFL in ANY/A, and was the AFL’s first-team All-Pro selection at quarterback (running back Jim Nance was the MVP). The Packers and Chiefs met in the Super Bowl, of course, making it one of just two times that the Super Bowl featured two first-team All-Pro choices at quarterback. The other? Super Bowl III, featuring Earl Morrall and Joe Namath).
  • In 1971, Roger Staubach had a historically great season, producing a remarkable 7.81 ANY/A. The runner-up that year was Bob Griese, at 6.35, and no other passer was over 6.00. Those 1971 seasons from Staubach and Griese both ranked in the top 50 in my era-adjusted passer rating seasons, too. Alan Page was the AP MVP choice that year, Staubach won the Bert Bell Award for Player of the Year, and Griese won the third MVP, given by the NEA. So when the Cowboys and Dolphins met in the Super Bowl, it featured two MVP quarterbacks, a feat that could be matched this year. The PFWA has already named Ryan as its MVP, but the AP or the Bert Bell Award could choose Brady, which would give us another set of dueling MVPs.
  • In 1984 Dan Marino was a unanimous MVP (AP, NEA, PFWA, Bert Bell) on the back of a groundbreaking performance. His raw numbers (48 TDs, 5,084 yards) were remarkable, but so was his 8.94 ANY/A average. Joe Montana had a darn good year, too: his 49ers went 15-1 and his 7.93 ANY/A was 1.24 ANY/A better than any quarterback not named Marino. From an ANY/A dominance standpoint, it’s very similar to what Ryan and Brady have done this year.

[continue reading…]

{ 1 comment }

Today’s guest post/contest comes from Thomas McDermott, a licensed land surveyor in the State of California, a music theory instructor at Loyola Marymount University, and an NFL history enthusiast. As always, we thank him for his hard work. You can view all of his work at Football Perspective here.


I wrote this article last year, when I generated the statistics and then ranked all starting quarterbacks in 2015 based on how well they played in “clutch” [1]Note that throughout this post, anything that happens within this situation is termed “clutch”; as in “clutch yards”, “clutch plays”, “clutch touchdown”, etc. situations. I used a simple definition: if it occurred in the 4th quarter or overtime, when the game was tied or the quarterback’s team was trailing by as much as one score (8 points), then it was a clutch situation.

The main metric used was Bryan Frye’s Total Adjusted Yards per Play, and today we’ll use the same methodology [2]In my post last year, I included a 2-point conversion bonus of 15 yards which I’m going to leave out for now. Besides not really adding much to the study, when I started collecting the data for the … Continue reading to find the 2016 Clutch Value Leader as well as the single season leaders since 1994. Here’s Bryan’s TAY/P formula, which Chase supports as an all-encompassing basic measure of quarterback performance:

(passing & rushing yards + (touchdowns * 20) – (interceptions * 45) – (fumbles lost * 25) – ( sack yards)) / (pass attempts + rush attempts + sacks) [3]Note that Bryan uses a 25-yard penalty for all fumbles (lost or recovered) while this study uses that penalty for lost fumbles only (which are the only ones being counted here).

The other change I’m making from the previous post, is that I’ll be using a 3-year rolling league average, as opposed to a single year league average, when adjusting for era. Thanks to Bryan (through his great website GridFe) for providing me with that information.

So let’s get to it. Below are the quarterbacks in 2016 who had at least 30 clutch action plays, [4]For 2015, I used 24 actions plays as the cutoff, after looking at the numbers more when doing the single-season rankings, 30 seemed more appropriate. and here’s how to read the table: [continue reading…]

References

References
1 Note that throughout this post, anything that happens within this situation is termed “clutch”; as in “clutch yards”, “clutch plays”, “clutch touchdown”, etc.
2 In my post last year, I included a 2-point conversion bonus of 15 yards which I’m going to leave out for now. Besides not really adding much to the study, when I started collecting the data for the single season and career leaders in this metric, I found that the data on 2-point conversions is somewhat spotty before 2005; in fact, in most cases before 1998, the players involved aren’t even mentioned. So, for those of you who read the last post, taking away that conversion bonus means Eli Manning is at the top for 2015 and not Jay Cutler.
3 Note that Bryan uses a 25-yard penalty for all fumbles (lost or recovered) while this study uses that penalty for lost fumbles only (which are the only ones being counted here).
4 For 2015, I used 24 actions plays as the cutoff, after looking at the numbers more when doing the single-season rankings, 30 seemed more appropriate.
{ 23 comments }

Before last year’s Super Bowl, I wrote that Carolina led the NFL in points scored in a unique way. What made the Panthers scoring success so unusual? Most notably were these two facts:

  • Carolina ranked only 11th in yards, the worst-ever ranking for the top-scoring team; and
  • Carolina ranked only 9th in NY/A, the worst-ever ranking for the top-scoring team.

With the Patriots, you may be surprised to learn that while New England finished 1st in points allowed, the defense ranked just 16th in DVOA. There are a few explanations here:

  • The Patriots faced by far the easiest schedule of any defense in the NFL.  New England’s SOS was -7.1%, while Tennessee was 31st at -4.2%, and the Bills were 30th at -3.0%.  The Patriots would be tied for 8th in DVOA if that metric was not adjusted for strength of schedule, which is why the defense falls to 16th with those adjustments.
  • New England had just 11 turnovers, tied with the Falcons for fewest in the league. Combined with a generally good offense, and the average opponent’s drive against New England started inside the 25-yard line, the best in the league. That means the Patriots defense had a lot of turf behind them, making life much easier for the defense.
  • Opposing kickers missed 8 of 29 attempts, including three from within 45 yards.  In addition, the Patriots were 8th in red zone defense and 3rd in goal-to-go defense, which helps the points allowed numbers.

New England’s defense was hardly bad by traditional numbers: the Patriots ranked 8th in total yards allowed, 6th in Net Yards per pass Attempt allowed, and 3rd and 4th in yards per carry allowed and rush defense DVOA.  That’s a good defense, but again, is boosted by the very easy schedule. [continue reading…]

{ 13 comments }

Beating the Patriots in a Shootout

Can the Falcons beat the Patriots in Super Bowl LI in a shootout?  On some level, the answer is of course.  Atlanta was the highest-scoring team in the regular season, and the Falcons offense has been historically great. And yet, the early returns from the media on how Atlanta can beat New England tend to focus on whether the Falcons defense and pass rush can dominate the game.

That’s not surprising given the post mortem written following the Patriots two Super Bowl losses, and there is no doubt that “getting the better of Brady” has been the m.o. for most teams that have knocked New England out of the playoffs.   So can Atlanta win a 35-31 style game against the Patriots?

In general, the conventional wisdom is true regarding how to beat New England: the Patriots are 19-1 when scoring over 21 points in playoff games since 2001, with the only loss coming in the classic 2006 AFC Championship Game against the Colts.  But there are other exceptions.  There have been 12 games in the Tom Brady era that I would classify as a shootout, which means:

  • Both teams combine for 60+ points;
  • The game is decided by 15 or fewer points; and
  • Both teams combined for 600+ passing yards (which, surprisingly, eliminates the ’06 AFCCG)

The first of those games was Super Bowl XXXVIII against the Panthers; that game, of course, was in fact decided by the last team to have the ball, which was New England. The Patriots are “only” 8-4 in these games, though, which means there may in fact be a blueprint for the Falcons to follow.  Let’s look at those losses and see if they meet the spirit of the question:

  • 2009, SNF at Indianapolis: This was the “4th and 2” game, and it wouldn’t surprise anyone if the Patriots (or Falcons) employed a similarly aggressive tactic in this year’s Super Bowl.  The Patriots led the 9-0 Colts 31-14 early in the 4th quarter, when Peyton Manning kicked it into overdrive.  He led Indianapolis on a 5-play, 79-yard drive for a touchdown; after a Patriots punt, a Manning deep pass was intercepted.  New England responded with a FG to extend the lead to 34-21, but Manning responded with another 79-yard touchdown drive. New England tried to run out the clock, but faced a 4th-and-2 with 2:08 to go at the Patriots own 28.  The idea of giving Manning two minutes while trying to prevent a 6-point lead didn’t sound very good — and it wouldn’t against 2016 Matt Ryan, either — so the Patriots went for it but fell a yard short.  Manning responded with a quick touchdown, and Indianapolis won, 35-34.
  • 2011, week 3, at Buffalo: Yes, the “If Ryan Fitzpatrick can do it” game. Both Brady and Fitzpatrick cleared 350 passing yards, and Buffalo recorded four interceptions, one of which was a pick six. Buffalo had a 95-yard touchdown drive in the 4th quarter, and hit a field goal as time expired for a 34-31 win.
  • 2012, SNF at Baltimore: Another primetime game on the road against a hated rival. This was a back-and-forth game that saw Brady and Joe Flacco combine for over 700 yard through the air.  With 7:29 left in the game, Baltimore had the ball at their own 8, down by 9 points.  The Ravens drove 92 yards for the score, forced a punt, and then hit the game-winning field goal as time expired to steal a 31-30 win.
  • 2012, SNF vs. San Francisco: Yet another primetime game, and this one was a crazy one. The 49ers jumped out to a 31-3 lead, with Randy Moss, Delanie Walker, and Michael Crabtree all pulling in touchdowns.  The Patriots then stormed back with four touchdowns to make it 31-31 in the 4th quarter, before Kaepernick hit Crabtree for another touchdown.  The 49ers iced it with a field goal late, and a last-minute field goal by New England made the final score 41-34.

There are also these 12 regular season games that, for one reason or another, don’t fit the above criteria, but involved New England losing and the opponent scoring over 30 points:

Points
Tm
Year Date Time LTime Opp Week G# Day Result OT PF PA PD PC
NWE 2016 2016-11-13 8:30 SEA 10 9 Sun L 24-31 24 31 -7 55
NWE 2015 2015-12-06 4:25 4:25 PHI 13 12 Sun L 28-35 28 35 -7 63
NWE 2014 2014-09-07 1:03 1:03 @ MIA 1 1 Sun L 20-33 20 33 -13 53
NWE 2014 2014-09-29 8:31 7:31 @ KAN 4 4 Mon L 14-41 14 41 -27 55
NWE 2010 2010-11-07 1:02 1:02 @ CLE 9 8 Sun L 14-34 14 34 -20 48
NWE 2009 2009-11-30 8:40 7:40 @ NOR 12 11 Mon L 17-38 17 38 -21 55
NWE 2009 2010-01-03 1:02 12:02 @ HOU 17 16 Sun L 27-34 27 34 -7 61
NWE 2005 2005-10-02 1:02 1:02 SDG 4 4 Sun L 17-41 17 41 -24 58
NWE 2005 2005-11-07 9:08 9:08 IND 9 8 Mon L 21-40 21 40 -19 61
NWE 2004 2004-10-31 4:15 4:15 @ PIT 8 7 Sun L 20-34 20 34 -14 54
NWE 2003 2003-09-07 1:04 1:04 @ BUF 1 1 Sun L 0-31 0 31 -31 31
NWE 2001 2001-10-28 2:15 2:15 @ DEN 7 7 Sun L 20-31 20 31 -11 51

Do any of those games (or the ones described in more detail above) stick out to you as the right blueprint for Atlanta?  Would you say Atlanta has better odds of winning in a shootout, or in a low-scoring game?

{ 24 comments }

Would the Atlanta Falcons be the worst franchise to win the Super Bowl? The Falcons have a franchise regular season record of 341-437-6, which translates to a 0.439 winning percentage.

In 51 years, the Falcons have made the playoffs just 13 times. Atlanta didn’t record back-to-back winning seasons as a franchise until Matt Ryan arrived; the team had five straight years with a winning record, but hasn’t had repeated the feat since (next year, perhaps). Atlanta has never led the NFL in offense; it hadn’t led the league in scoring until this year. It only led the league in points allowed one time, the historic ’77 team, but has never finished first in yards allowed.

In short, this is not a good franchise. It may be one of the three worst franchises to ever win a Super Bowl, yet it may still be the best franchise from the NFC South to ever pull off that feat. Here are my rankings of the worst franchises to win a Super Bowl.

5) 2001 Patriots: Sure, it’s easy to think of New England as one of the best franchises in the league. But 15 years ago? Not so much. New England had a 291-328-9 record (0.471), 37 games below .500, when the team won its first Lombardi Trophy. The franchise had been on the rebound from the ugly days of the early ’90s, but the franchise’s history was mostly bad, even when the team was good (see: Super Bowl XX).

4) 1974 Steelers: Another team that used its first Super Bowl victory as the birth of a dynasty. But Pittsburgh was 199-280-19 (0.419) at the conclusion of the 1974 regular season; at 81 games below 0.500, this was a bad franchise. In the ’50s and ’60s, the Steelers had the second most losses of any team in the NFL. That all changed once Chuck Noll came to town, and quickly turned the Steelers into the team of the ’70s.

3) 2016 Falcons, with a win: Atlanta is currently an underdog in Super Bowl LI, but this feels like the appropriate slot for the team. At 96 games below .500 and with a 0.439 winning percentage, this is a bad franchise. Under Rankin Smith, Atlanta went 129-218-5 in the team’s first 24 years of existence, with just one playoff victory. He handed the keys to the organization to his son, Taylor, in 1990; Atlanta won a playoff game in ’91 and then two more in 1998, culminating in the team’s only Super Bowl appearance prior to this year. Still, three playoff wins and an 83-109 record in 12 years wasn’t much better.

The team was sold to Arthur Blank in 2002, and the Falcons have been good under Blank in large part because the team landed Michael Vick and then Matt Ryan.  The Falcons are 129-110-1 in the Blank years, with a 5-6 playoff record. Perhaps most impressive: in 15 years, Atlanta has had a losing season just five times.

2) 2009 Saints: New Orleans was a whopping 103 games below .500 after the 2009 season, courtesy of a 275-378-5 record (0.422).  This was a bad, bad franchise: under founding owner John Mecom Jr., the team went 78-176-5 in 18 years without a single playoff appearance!  Tom Benson took over in 1985, but the Saints didn’t win their first playoff game until 2000!  Entering the ’09 playoffs, the franchise had just two playoff wins, but won three that year to capture the team’s sole Lombardi Trophy.

1) 2002 Bucs: Tampa Bay had a 0.382 winning percentage at the end of the 2002 regular season, and stood at 99 games below 0.500 with a 160-259-1 franchise mark. This team was called the “Yucks” for a reason: from Hugh Culverhouse was the team’s original owner, and the franchise famously lost its first 26 games.  Culverhouse died after 18 years, and Tampa Bay had won just a single playoff game during his time; overall the Bucs were 81-194-1, easily the worst franchise in the NFL over that period.

In 1994, the Bucs went 6-10 without a true owner; the Culverhouse estate sold the team to Malcolm Glazer, who had a pretty nice start.  His first two draft picks were Warren Sapp and Derrick Brooks, and the team soon turned from laughingstock to contender once Tony Dungy came on board in 1996.  Glazer controversially fired Dungy and traded two first-rounders, two second-rounders, and $8 million for Jon Gruden, but the moved proved to be an immediate (if not necessarily long-term) success: the Bucs won the Super Bowl in ’02, the first year under Gruden.

{ 11 comments }

Background reading:

Part I

Part II

Part III

Part IV

Part V (Career Passer Ratings)

In the interest of making all data available to you, the reader, the table below shows the averages for each professional football league since 1932 in the relevant passing statistics used to calculate passer rating: [continue reading…]

{ 9 comments }

Through 10 weeks, the Packers were 4-6 with a -29 points differential, 8th-worst in the NFL. If Green Bay wins today, the Packers will become the 5th team to make the Super Bowl after being 2 games below .500 at any point during the season.

  • In 1993, Emmitt Smith famously held out during the first two weeks of the season; Dallas lost both of those games (and a third game in November in which Smith left due to injury after just one carry), beginning the season 0-2.  The Cowboys went on to repeat as Super Bowl champions.
  • In 1996, the Patriots began the season with road losses to Buffalo and Miami.  New England wasn’t a great team that year, but finished 11-5, and a Jaguars upset in Mile High cleared the path for the Patriots to make it to the Super Bowl.
  • Five years later, the Patriots again began the season 0-2, with Drew Bledsoe of course being injured in the second game of the season.  Enter Tom Brady, who won his first game but lost his second, meaning the Patriots were against two games under .500 at 1-3 after four games.  New England, of course, won the franchise’s first Super Bowl that season.
  • In ’07, the Patriots lost the Super Bowl to a Giants team that started the year 0-2 with two losses.  New York allowed 80 points in those games, but it turned out to be a bit of a scheduling issue: those games came against the 13-3 Cowboys and 13-3 Packers, teams the Giants later beat in the playoffs.

The Packers would be a bit of a different case, of course, as 4-6 is different than 0-2 (although I’m not sure which is more “impressive” to come back from).  The latest in a season a Super Bowl team was under .500?  The 1979 Rams were 5-6 after 11 games, which means the Packers would “tie” this record if Green Bay wins today.  What about Super Bowl champions? Well, that would be the ’01 Patriots, at 3-4 after 7 games; so if the Packers win two more games, they would set that record. [continue reading…]

{ 0 comments }

Can The Steelers Pass Rush Lead Them To The Super Bowl?

Over the first 8 weeks of the season, the Pittsburgh Steelers had just 8 sacks.  That was the fewest in the NFL, and the corresponding 2.84% sack rate was also the worst in the league.

Since then, things have changed pretty significantly.  Pittsburgh has 36 sacks, most in the league since the start of week 9, five more than any other team in the NFL.  [1]Notably, the Giants are 2nd in sacks over that period, with 31; meanwhile, the Giants had the second-worst sack rate, at 2.85%, and second fewest sacks, with 8, over the first eight weeks.  And only Arizona’s defense (8.94%) has a higher sack rate than Pittsburgh’s 8.53% since then.

Here’s the sack rate for the Steelers defense in each game this season: in a black horizontal line, I’ve shown the league average sack rate. [continue reading…]

References

References
1 Notably, the Giants are 2nd in sacks over that period, with 31; meanwhile, the Giants had the second-worst sack rate, at 2.85%, and second fewest sacks, with 8, over the first eight weeks.
{ 2 comments }

Adjusting Passer Rating for Era: Part V: The Results

Background reading:

Part I

Part II

Part III

Part IV

All week, I have been discussing how to adjust passer rating by era. Now that I have explained the formula, it’s time to generate the results. In a given season, ratings won’t change (unless a player moves below or above a limit as a result of the era adjustment), so the most interesting thing to do is to present career passer ratings.

To calculate career passer ratings, I first calculated each player’s passer rating in each season. Then, I created their career rating by averaging the player’s passer rating in each season, weighted of course by their number of attempts in that season. And now, the results.

The table below shows all 185 players with at least 1500 career pass attempts (this includes the 2016 season). Here is how to read the table below. Otto Graham is the career leader in era adjusted passer rating (this includes his AAFC time). He ranks 115th in career pass attempts with 2,626. Since passer rating is the sum of four variables multiplied by 100 and divided by 6, I figured we might as well present the era adjusted variables, too. In completion percentage, Graham scores a 1.40; in yards per attempt, he is at a whopping 1.53; in touchdown percent, 1.25, and in interception percentage, a remarkable 1.53. As a result, his era adjusted passer rating is 95.2. [continue reading…]

{ 17 comments }

Background reading:

Part I

Part II

Part III

I’m going to assume you have read the first three parts of this series; today, I want to go through how to adjust passer rating by era while keeping the weights of 5, .25, 20, and 25 on the four variables. As a reminder, here are the formulas used for the four variables in passer rating, once you ignore the upper and lower limits:

A = (Cmp% – .30) * 5
B = (Y/A – 3.0) * .25
C = TD% * 20
D = 2.375 – Int% * 25

Adjusted Completion Percentage

For completion percentage, we can do a simple era adjustment because the multiplier is not directly tied to league average. Instead, league average is intended to be 20% higher than the floor, which is 0.30 in the original formula. So we need to rewrite completion percentage as simply

A = (Cmp% – (League_Avg_Cmp% – 0.20) ) * 5

So in an environment where the league average completion percentage was 50%, you would insert 0.3 in the blue parenthetical; in 2016, tho, you would insert 43.0%. [continue reading…]

{ 13 comments }

There are no fewer than four problems with passer rating.

1. It does not adjust for era.

2. It only includes four variables — completion percentage, yards per attempt, touchdown rate, and interception rate — which means valuable information like sacks, first downs, and rushing are excluded.

3. The variables it does include are improperly weighted: a completion is worth 20 yards (too much), a touchdown is worth 80 yards (also too much), and an interception is worth -100 ways (again, too much).

4. Like nearly all non-proprietary formulas, it does not provide any situational context: an interception on 1st-and-goal from the 1 is the same as an interception on a Hail Mary, a 10-yard catch on 4th-and-9 is the same as a 10-yard catch on 3rd-and-30, etc.

These are just some of the reasons why passer rating is stupid. For reasons I can’t quite articulate, I only want to focus on solving the issue presented by problem number one. Yes, it may be silly to artificially tie one hand behind my back, but my goal here is not to come up with a new formula, but just to fix one specific issue with passer rating that everyone can acknowledge.

The past two days, I have been writing about passer rating. If you ignore the upper and lower limits in the formula, passer rating’s four variables can be re-written like this: [continue reading…]

{ 14 comments }

In yesterday’s post, I examined the methodology behind passer rating. Here were the passer ratings for the 30 quarterbacks who threw enough passes to qualify for the crown in 2016:

RkPlayerTmAttCmpYdsTDIntCmp%Yd/AttTD%INT%Rating
1Matt Ryan*+ATL534373494438769.9%9.267.1%1.3%117.1
2Tom Brady*NWE432291355428267.4%8.236.5%0.5%112.2
3Dak Prescott*DAL459311366723467.8%7.995.0%0.9%104.9
4Aaron Rodgers*GNB610401442840765.7%7.266.6%1.1%104.2
5Drew BreesNOR6734715208371570.0%7.745.5%2.2%101.7
6Sam BradfordMIN552395387720571.6%7.023.6%0.9%99.3
7Kirk CousinsWAS6064064917251267.0%8.114.1%2.0%97.2
8Derek Carr*OAK560357393728663.8%7.035.0%1.1%96.7
9Andrew LuckIND5453464240311363.5%7.785.7%2.4%96.4
10Marcus MariotaTEN451276342626961.2%7.605.8%2.0%95.6
11Ben Roethlisberger*PIT5093283819291364.4%7.505.7%2.6%95.4
12Ryan TannehillMIA3892612995191267.1%7.704.9%3.1%93.5
13Matthew StaffordDET5943884327241065.3%7.284.0%1.7%93.3
14Russell WilsonSEA5463534219211164.7%7.733.8%2.0%92.6
15Andy DaltonCIN563364420618864.7%7.473.2%1.4%91.8
16Alex SmithKAN489328350215867.1%7.163.1%1.6%91.2
17Colin KaepernickSFO331196224116459.2%6.774.8%1.2%90.7
18Tyrod TaylorBUF436269302317661.7%6.933.9%1.4%89.7
19Philip RiversSDG5783494386332160.4%7.595.7%3.6%87.9
20Carson PalmerARI5973644233261461.0%7.094.4%2.3%87.2
21Jameis WinstonTAM5673454090281860.8%7.214.9%3.2%86.1
22Eli ManningNYG5983774027261663.0%6.734.3%2.7%86.0
23Trevor SiemianDEN4862893401181059.5%7.003.7%2.1%84.6
24Joe FlaccoBAL6724364317201564.9%6.423.0%2.2%83.5
25Carson WentzPHI6073793782161462.4%6.232.6%2.3%79.3
26Blake BortlesJAX6253683905231658.9%6.253.7%2.6%78.8
27Case KeenumLAR322196220191160.9%6.842.8%3.4%76.4
28Cam NewtonCAR5102703509191452.9%6.883.7%2.7%75.8
29Brock OsweilerHOU5103012957151659.0%5.802.9%3.1%72.2
30Ryan FitzpatrickNYJ4032282710121756.6%6.723.0%4.2%69.6

Now, as we learned yesterday, passer rating is the result of four variables: completion percentage, yards per attempt, touchdown rate, and interception rate. Those variables are all scaled so that the average score is 1.0 for each variable. Then, we take an average of the four variables and multiply it by 66.67, since that was intended to be the league average passer rating (or, said differently and how it is more commonly represented in formulas, we sum the four numbers, divide by six, and multiply by 100).

So let’s take a look at the scores in each of the four variables for these 30 quarterbacks to better understand their 2016 passer ratings. The far right column shows the average of those variables, which again, is equivalent to their passer rating divided by 66.67. [continue reading…]

{ 28 comments }

Adjusting Passer Rating for Era: Part I

Passer rating is a dumb stat. Let’s get that out of the way. As I’ve written before, passer rating is stupid because it gives a 20-yard bonus for each completion, a 100-yard penalty for each interception, and an 80-yard bonus for each touchdown. In reality, there should be no (or a very small) weight on completions (or, better yet, a bonus for completions that go for a first down), a 45-yard weight on interceptions, and a 20-yard weight on touchdowns. But given how ubiquitous passer rating is in analysis of passing, let’s at least try to understand it more.

Let’s begin with the formula one needs to calculate passer rating in Excel:

=IF(C2>223,SUM(MEDIAN(0,2.375,(D2/C2-0.3)*5),MEDIAN(0,2.375,[1]E2)/C2-3)*0.25),MEDIAN(0,2.375,F2/C2*20),MEDIAN(0,2.375,2.375-(G2/C2*25)/6*100,0)

To make this formula work, you need to put the following categories in these cells:

C2 = Attempts
D2 = Completions
E2= Passing Yards
F2 = Passing Touchdowns
G2 = Interceptions

That formula probably seems like gibberish to you, so let’s unpack it a little bit.

=IF(C2>223,SUM(MEDIAN(0,2.375,(D2/C2-0.3)*5),MEDIAN(0,2.375,[2]E2)/C2-3)*0.25),MEDIAN(0,2.375,F2/C2*20),MEDIAN(0,2.375,2.375-(G2/C2*25)/6*100,0)

This part is simple enough: if a quarterback doesn’t have at least 224 pass attempts (during a 16-game season), they fail to qualify for the passer rating crown.  You can lower this number for non-16-game seasons as necessary.

Passer Rating – Four Components

Passer rating comprises four components: completion percentage, yards per attempt, touchdowns per attempt, and interceptions per attempt.  Let’s see how the above formula addresses these concerns:

Completion Percentage

=IF(C2>223,SUM(MEDIAN(0,2.375,(D2/C2-0.3)*5),MEDIAN(0,2.375,[3]E2)/C2-3)*0.25),MEDIAN(0,2.375,F2/C2*20),MEDIAN(0,2.375,2.375-(G2/C2*25)/6*100,0)

Take a look at the bolded blue text — What are we doing? Taking completions and dividing them by attempts is how we come up with completion percentage, of course.  You take that result and subtract 0.3, or 30%.  Savvy readers will pick up on the fact that if your completion percentage is 29% or 0%, you get the same credit in passer rating: there is a floor of 30%. [continue reading…]

References

References
1, 2, 3 E2)/C2-3)*0.25),MEDIAN(0,2.375,F2/C2*20),MEDIAN(0,2.375,2.375-(G2/C2*25
{ 9 comments }

The median amount of points scored in Falcons games this year is 57 points; in Packers games, that number is 53 points. So why is the over/under 60 points?

The average isn’t much different: there have been 58.9 points scored in Atlanta games, and 52.0 points scored in Green Bay games. You may be surprised to learn that during Green Bay’s 8-game winning streak, there have been 51.6 points scored per game: 32.1 by the Packers, and 19.5 by Packers opponents.

Of course, what’s really driving these numbers is not the points scored by both teams in these games, but by both offenses. The Packers are averaging 28.0 points per game this year over 18 games, 32.1 points per game during this 8-game winning streak, and 34.8 over the team’s last 5 games. Atlanta is averaging 33.9 points per game over 17 games, and 38.0 points over their current 5-game winning streak.

So by that line of thinking, a 60-point over/under probably feels low. But it is currently (the line may change) tied for the 2nd highest over/under of any game since 1978, with the only other playoff game on the list:

WinnerLoserYearWeekBoxscoreLineOver/UnderPFPATotal Pts
STLSFO20009Boxscore-763342458
NORDET2011WCBoxscore-10.560452873
KANOAK200416Boxscore-9.560313061
CARSTL200010Boxscore13.559.5272451
DENWAS20138Boxscore-1158.5452166
STLIND200116Boxscore-1358.5421759
STLATL20007Boxscore-1858.5452974
GNBNWE201413Boxscore-358262147
INDMIN20049Boxscore-758312859
CARSTL200014Boxscore85816319
DENPHI20134Boxscore-11.557.5522072

What do you think? Over or Under?

{ 5 comments }

In the wildcard round last season, all four road teams won.  It isn’t unusual to see a lower seed win in the wildcard round, as often you have the stronger team being on the road against a weak division winner.  That was probably the case when we saw KC beat Houston and Green Bay win in Washington last year; in addition, the Steelers upset the Bengals and Seahawks beat the Vikings.

Since then? Not a single road team has won a playoff game.  The four teams with bye last year — Carolina, Arizona, New England, and Denver — all won in the division round of the playoffs.  Then the #1 seeded Broncos and Panthers won, too, marking six straight home wins.  We skip the Super Bowl, although for trivia fans, the champion Broncos were in fact the designated home team.

In the first round of the playoffs this year, all four home teams won.  The “weak division winner” Texans were aided by a QB injury and beat the Raiders, while the 4 seed in the NFC (the Packers) rode a hot end-of-year streak to beat the Giants.  In addition, Seattle and Pittsburgh won as 3 seeds.

Then, yesterday, the 1 seeded Patriots and 2 seeded Falcons beat the Texans and Seahawks, respectively.  That runs the streak up to 12 straight wins by home teams in the playoffs.  That’s easily the most in NFL history.

In addition, if we include last year’s Super Bowl, that means the last 8 playoff games have been decided by at least 13 points.

Points
Tm Year Date
Time Opp Week Day Result PF PA PD
CAR 2015 2016-01-24 6:42 ARI 20 Sun W 49-15 49 15 34
DEN 2015 2016-02-07 6:39 CAR 21 Sun W 24-10 24 10 14
HOU 2016 2017-01-07 4:35 OAK 18 Sat W 27-14 27 14 13
SEA 2016 2017-01-07 8:15 DET 18 Sat W 26-6 26 6 20
PIT 2016 2017-01-08 1:05 MIA 18 Sun W 30-12 30 12 18
GNB 2016 2017-01-08 4:40 NYG 18 Sun W 38-13 38 13 25
ATL 2016 2017-01-14 4:35 SEA 19 Sat W 36-20 36 20 16
NWE 2016 2017-01-14 8:15 HOU 19 Sat W 34-16 34 16 18

There had never even been six straight games decided by at least 13 points, so this is also an NFL playoff record.

{ 4 comments }

Scoring 3 Different Ways In One Game

Last night, Dion Lewis scored a touchdown for the Patriots on a kickoff return, along with scoring touchdowns on a reception and on a rush attempt. Earlier this year, Tyreek Hill did the same thing to provide the margin of victory over the Broncos.  Those were the 12th and 13th times since 1960 that a player has scored touchdowns three different ways in a game.

  • In 1995, Jimmy Smith pulled off a unique hat trick against the Broncos: He recovered a blocked punt in the end zone for a fumble return touchdown, scored on a lateral on a kickoff return, and caught a touchdown.
  • In 1976, Freddie Solomon, then with the Dolphins, scored via punt return, catch, and run against the Bills.
  • In 1969, Travis Williams of the Packers scored via an 83-yard punt return, a 96-yard kickoff return, and on a 1-yard run against the Steelers.
  • In 1965, Gale Sayers did it three times.
    • Against the Vikings, Sayers scored three touchdowns in the 4th quarter — one on a catch, one on a kickoff return, and one on a rush.
    • Later in his rookie season, Sayers rushed for four touchdowns, caught a touchdown, and had a touchdown on a kickoff return against the 49ers.
    • Two years later, Sayers had another hat trick — and again against San Francisco — by scoring via a kickoff return, punt return, and rushing touchdown.
  • Also in 1967, Saints Walter Roberts pulled off a hat trick against the Eagles, with a kickoff return, fumble return, and receiving touchdown.
  • In 1962, Timmy Brown of the Eagles did what Sayers did in ’65 and what Hill and Lewis did this year.  Against the Redskins, Brown had a 99-yard kickoff return, a 3-yard rushing touchdown, and a 10-yard touchdown reception.
  • In the AFL in 1961, Abner Haynes nearly single-handedly pulled off an incredible 4th quarter comeback against the Bills, with a 69-yard touchdown catch, 3-yard touchdown run, and 87-yard kickoff return touchdown in the final frame.
  • Bobby Mitchell — the other great running back on the Browns in the early ’60s — did it twice. Against the Cowboys in 1960, he had a 46-yard touchdown catch, 30-yard touchdown run, and 90-yard kickoff return touchdown.  A year later, against Washington, Mitchell scored on a punt, catch, and run.

And for completeness’ sake, prior to 1960, Frank Minini, Joe Scott, Spec Sanders, Billy Hillenbrand, Hugh Gallarneau, Jay Arnold, Hank Bruder, Buckets Goldenberg, Art Folz, and Roddy Lamb had a touchdown hat trick at one point in their careers.

{ 3 comments }

The Seahawks and Falcons face off today, and the over/under for the game is 51 points. If that sounds like a lot of points, that’s because it is: it’s the first Seahawks game where the over/under is greater than 50 points since 2004.

13 of 16 Falcons games this season went “Over”, and there was a push in the Falcons/Panthers game in December with an over/under of 49 points. The Seahawks maybe have their worst defense in years (which isn’t much of an insult) with Earl Thomas out, and are facing a dominant Falcons offense.  So it makes sense that this is expected to be the highest scoring Seattle game in years.  Although earlier this year, on the road in a dome against another NFC South team, the over/under was 50 points.

{ 5 comments }

There is a lot of talk about the large point spread in the Patriots/Texans game. New England is a 15.5-point favorite over Houston tonight, tied for the second largest spread ever in a non-Super Bowl playoff game behind only Minnesota/Arizona in 1998.  The over/under is 44.5, which means the projected final score is 30-14.5.

Let’s say the Texans pull off the upset. Are they more likely to do so in a low-scoring game, or in a shootout?  If Houston wins 14-13, they will have come in under their projected points total by 0.5, but held New England to 17 fewer points than expected.  If the Texans win 31-30, they would have exceeded their projected points total by 16.5 points, while holding New England to exactly the number of expected points.

So, which result is more likely? My intuition says a low-scoring game, but what do the numbers say? There have been 24 games since 1985 where a team won despite being an underdog of at least 14 points.  As it turns out, intuition is correct: on average, these underdogs exceeded their projected points for total by 7.8 points, but held their opponents to 13.3 fewer points than expected. [continue reading…]

{ 8 comments }

The Chargers franchise started in Los Angeles in 1960, before moving to San Diego in 1961.  The team spent 56 years in San Diego before deciding to move to Los Angeles yesterday. That’s the longest amount of time any professional football team has spent in one city before relocating.

The Cleveland Browns existed for 50 years, from 1946 to 1995, before Art Modell moved the franchise to Baltimore. Cleveland was given an expansion team three years later, and the new Browns entered the league in 1999.

The Rams also began in Cleveland, playing there from 1937 to 1945.  The team moved west to Los Angeles in 1946, and remained in the greater Los Angeles area [1]The team played in Anaheim from 1980 to 1994. until 1994, when the franchise moved to St. Louis.  That means the Rams existed in LA for 49 seasons before moving to the midwest.  Of course, after 21 seasons in St. Louis, the Rams returned home last season.

The Cardinals were one of the NFL’s original franchises, playing in Chicago from 1920 through 1959.  Then, after 40 seasons in Chicago, the Cardinals moved to St. Louis in 1960.  The team stayed there for 28 years, before moving to Arizona in 1988.

The Houston Oilers were one of the AFL’s initial franchises in 1960, but Bud Adams took the franchise east to Tennessee in 1997.  So after 37 years in Houston, the Oilers moved, but the city received the expansion Texans a few years later.

The only other team to move after 25 years in one city was the Colts, of course.  The franchise began in complicated fashion: the franchise was awarded to Carroll Rosenbloom in 1953, although it really was a legacy of the ’52 Dallas Texans.  The Colts stayed in Baltimore for 31 years, before Robert Irsay – who had traded for the Colts in 1972 – moved the team to Indianapolis after the 1983 season.

What do you think of the Chargers moving to LA?

References

References
1 The team played in Anaheim from 1980 to 1994.
{ 15 comments }

2016 Approximate Value Released

With the All-Pro votes now in, the initial 2016 Approximate Value numbers have been released by PFR. Here are the leaders:

Query Results Table
Games Misc
Rk Player Year Age Draft Tm Lg G GS Yrs PB AP1 AV
1 Matt Ryan 2016 31 1-3 ATL NFL 16 16 1 1 1 21
2 Damon Harrison 2016 28 NYG NFL 16 16 1 0 1 18
3 Aaron Rodgers 2016 33 1-24 GNB NFL 16 16 1 1 0 18
4 David Bakhtiari 2016 25 4-109 GNB NFL 16 16 1 0 0 17
5 Von Miller 2016 27 1-2 DEN NFL 16 16 1 1 1 17
6 Bobby Wagner 2016 26 2-47 SEA NFL 16 16 1 1 1 17
7 Drew Brees 2016 37 2-32 NOR NFL 16 16 1 0 0 16
8 Calais Campbell 2016 30 2-50 ARI NFL 16 16 1 0 0 16
9 Ezekiel Elliott 2016 21 1-4 DAL NFL 15 15 1 1 1 16
10 Julio Jones 2016 27 1-6 ATL NFL 14 14 1 1 1 16
11 Sean Lee 2016 30 2-55 DAL NFL 15 15 1 0 1 16
12 Andrew Luck 2016 27 1-1 IND NFL 15 15 1 0 0 16
13 Alex Mack 2016 31 1-21 ATL NFL 16 16 1 1 0 16
14 Khalil Mack 2016 25 1-5 OAK NFL 16 16 1 1 1 16
15 Le’Veon Bell 2016 24 2-48 PIT NFL 12 12 1 1 0 15
16 Jack Conklin 2016 22 1-8 TEN NFL 16 16 1 0 1 15
17 Kirk Cousins 2016 28 4-102 WAS NFL 16 16 1 0 0 15
18 Aaron Donald 2016 25 1-13 LAR NFL 16 16 1 1 1 15
19 Devonta Freeman 2016 24 4-103 ATL NFL 16 16 1 1 0 15
20 David Johnson 2016 25 3-86 ARI NFL 16 16 1 1 1 15
21 Zach Orr 2016 24 BAL NFL 15 15 1 0 0 15
22 Dak Prescott 2016 23 4-135 DAL NFL 16 16 1 1 0 15
23 Tyrod Taylor 2016 27 6-180 BUF NFL 15 15 1 0 0 15
24 Olivier Vernon 2016 26 3-72 NYG NFL 16 16 1 0 0 15
25 Travis Frederick 2016 25 1-31 DAL NFL 16 16 1 1 1 14
26 Chris Harris 2016 27 DEN NFL 16 15 1 1 1 14
27 Dont’a Hightower 2016 26 1-25 NWE NFL 13 13 1 0 0 14
28 T.Y. Hilton 2016 27 3-92 IND NFL 16 16 1 1 0 14
29 Zack Martin 2016 26 1-16 DAL NFL 16 16 1 1 1 14
30 LeSean McCoy 2016 28 2-53 BUF NFL 15 15 1 1 0 14
31 Benardrick McKinney 2016 24 2-43 HOU NFL 16 16 1 0 0 14
32 C.J. Mosley 2016 24 1-17 BAL NFL 14 14 1 1 0 14
33 Matthew Stafford 2016 28 1-1 DET NFL 16 16 1 0 0 14
34 Aqib Talib 2016 30 1-20 DEN NFL 13 13 1 1 1 14
35 Russell Wilson 2016 28 3-75 SEA NFL 16 16 1 0 0 14
Provided by Pro-Football-Reference.com: View Original Table
Generated 1/12/2017.

You can view the top 100 players here, and individual player AV by team is available as well.

{ 29 comments }

Larry Fitzgerald led the NFL in receptions this year, with 107. That’s good, but how important is leading the league in catches? The triple crown is thought of as the leaders in receptions, receiving yards, and receiving touchdowns, but I think we can all agree that receiving first downs is a better indicator of receiver play than receptions. If I was in charge of stats-keeping, I’d place far more emphasis of receiving first downs than receptions, because receptions that don’t go for first downs are far less valuable than receptions that do go for a first down. And while receptions may be a decent proxy for receiving first downs, there’s a lot of variance there.

The leader in receiving first downs this year was Mike Evans, and he certainly had a better statistical year than Fitzgerald.  Evans had a stat line of 96-1321-12, with 81 first downs, compared to Fitzgerald’s 107-1023-6 and 59 first downs.  That’s right: Evans had 22 more first downs on just 11 fewer grabs, thanks to his 84.4% first down rate compared to Fitzgerald’s 55.1%. Evans dominated the league in this metric, finishing with 15 more than anyone else. [1]Best as we can tell, the record for receiving first downs in a season was 92, shared by Calvin Johnson (2012) and Marvin Harrison (2002), until Julio Jones broke it last year with 93. Evans finished with 6 out of the 100 votes cast for the AP All-Pro team, which seems like a criminally low number that would be higher in first downs were as widely-reported as they should be.

In the interest of data disclosure, the table below shows the receptions, receiving yards, touchdowns, *and receiving first downs* for the top receivers last season. I have also included each player’s receiving first down percentage, and their total number of Adjusted Catch Yards, defined here as receiving first downs * 9, plus receiving yards, plus receiving touchdowns * 11 (because a receiving TD already gets 9 yards since it is counted as a first down, too). [continue reading…]

References

References
1 Best as we can tell, the record for receiving first downs in a season was 92, shared by Calvin Johnson (2012) and Marvin Harrison (2002), until Julio Jones broke it last year with 93.
{ 58 comments }

Additional Thoughts On The 2016 Falcons Offense

Atlanta had “only” 175 drives on offense this year, tied with Washington for the fifth fewest drives in the NFL. That’s partially because the offense was so good — Atlanta had the 2nd fewest number of drives end in a 3-and-out, behind only New Orleans — but also because the defense was below average, keeping the offense off the field.

Despite that, Atlanta scored a whopping 540 points. But here’s another way to think about it: the Falcons had just 11 turnovers and 48 punts, meaning just 59 drives ended in a punt or a turnover. That’s the fewest in modern history, one fewer than the 2007 Patriots (who had just 167 drives). And Atlanta scored 58 offensive touchdowns, meaning the offense had nearly as many drives end in a touchdown as a punt or turnover. And that’s just, well, crazy: [continue reading…]

{ 40 comments }

2016 AP All-Pro Teams Announced

On Friday, the AP announced the 2016 All-Pro teams. One confusing change this year: the removal of the fullback and the second running back spot (there used to be 12 first-team All-Pros on offense), and the substitution of a “Flex” spot that seems to go to… anyone? David Johnson finished second in running back voting, but first in Flex voting, whatever that means.  And while 12 1APs may not make sense, there are still 12 on defense, which makes it pretty odd.   There’s also now a defensive back category in addition to CB and S, which… again, I don’t quite get.  But there are 2 first team edge rushers, 2 interior defenders, 3 linebackers, 2 cornerbacks, 2 safeties, and one defensive back.

Quarterback

Matt Ryan, Atlanta, 29; Tom Brady, New England, 15; Aaron Rodgers, Green Bay, 5; Derek Carr, Oakland, 1.

Running Backs

Ezekiel Elliott, Dallas, 47; David Johnson, Arizona, 3.

Wide Receivers

Antonio Brown, Pittsburgh, 43; Julio Jones, Atlanta, 30; Odell Beckham Jr., New York Giants, 16; Mike Evans, Tampa Bay, 6; Jordy Nelson, Green Bay 5.

Tight End

Travis Kelce, Kansas City, 44; Greg Olsen, Carolina, 5; Rob Gronkowski, New England, 1.

Flex

David Johnson, Arizona, 24; Le’Veon Bell, Pittsburgh, 18; Odell Beckham, New York Giants, 3; Antonio Brown, Pittsburgh, 1; Larry Fitzgerald, Arizona, 1; LeSean McCoy, Buffalo, 1; Jarvis Landry, Miami, 1; Travis Kelce, Kansas City, 1.

Left Tackle

Tyron Smith, Dallas, 27; David Bakhtiari, Green Bay, 8; Joe Thomas, Cleveland, 7; Trent Williams, Washington, 3; Jason Peters, Philadelphia, 2; Taylor Lewan, Tennessee, 1; Donald Penn, Oakland, 1; Andrew Whitworth, Cincinnati, 1.

Right Tackle

Jack Conklin, Tennessee, 27 1-2; Mitchell Schwartz, Kansas City, 6; Marcus Cannon, New England, 6; Bryan Bulaga, Green Bay, 5 1-2; Zach Strief, New Orleans, 2; Ryan Schraeder, Atlanta, 2; Marcus Gilbert, Pittsburgh, 1;

Left Guards

Kelechi Osemele, Oakland, 47; Marshal Yanda, Baltimore, 2; James Carpenter, New York Jets, 1. Right Guard

Zack Martin, Dallas, 40; David DeCastro, Pittsburgh, 5; Marshal Yanda, Baltimore, 4; Kevin Zeitler, Cincinnati, 1.

Center

Travis Frederick, Dallas, 29; Alex Mack, Atlanta, 14; Rodney Hudson, Oakland, 5; Maurkice Pouncey, Pittsburgh, 1, Brandon Linder, Jacksonville, 1.

Defensive Players

Edge Rushers

Khalil Mack, Oakland, 46; Vic Beasley Jr., Atlanta, 30; Cameron Wake, Miami, 3; Olivier Vernon, Miami, 3; Jadeveon Clowney, Houston,m 3; Brandon Graham, Philadelphia, 3; Michael Bennett, Seattle, 2; Cameron Jordan, New Orleans, 2; Danielle Hunter, Minnesota, 2; Cliff Avril, Seattle, 2; Everon Griffen, Minnesota, 1; Joey Bosa, San Diego, 1.

Interior Linemen

Aaron Donald, St. Louis, 47; Damon Harrison, New York Giants 16; Ndamukong Suh, Miami, 12; Calais Campbell, Arizona, 7; Gerald McCoy, Tampa Bay, 7; Fletcher Cox, Philadelphia, 6; Geno Atkins, Cincinnati, 5.

Linebackers

Bobby Wagner, Seattle, 48; Von Miller, Denver, 47; Sean Lee, Dallas, 41; Lorenzo Alexander, Buffalo, 4; Luke Kuechly, Carolina, 2; C.J. Mosley, Baltimore, 1; Zach Brown, Buffalo, 1; Zachary Orr, Baltimore, 1; Alec Ogletree, Los Angeles, 1; Dont’a Hightower, New England, 1; Bernardick McKinney, Houston, 1; Lavonte David, Tampa Bay, 1; Whitney Mercilus, Houston, 1.

Cornerbacks

Aqib Talib, Denver, 27; Marcus Peters, Kansas City, 23; Janoris Jenkins, New York Giants, 17; Malcolm Butler, New England, 8; Casey Hayward, San Diego, 8; Richard Sherman, Seattle, 7; Xavier Rhodes, Minnesota, 5; Chris Harris, Jr., Denver, 4; Dominique Rodgers-Cromartie, New York Giants, 1.

Safeties

Landon Collins, New York Giants, 47; Eric Berry, Kansas City, 31; Devin McCourty, New England, 4; Ha Ha Clinton-Dix, Green Bay, 4; Earl Thomas, Seattle, 3; Harrison Smith, Minnesota, 3; Reggie Nelson, Cincinnati, 2; Kam Chancellor, Seattle, 2; Malcolm Jenkins, Philadelphia, 1; Eric Weddle, Baltimore, 1; Quintin Demps, Houston, 1; Darian Stewart, Denver, 1.

Defensive Back

Chris Harris, Jr., Denver, 14; Dominique Rodgers-Cromartie New York Giants, 6; Malcolm Butler, New England, 5; Eric Berry, Kansas City 3; Casey Hayward, San Diego, 3; Malcolm Jenkins, Philadelphia, 3; Patrick Peterson, Arizona, 2; Marcus Peters, Kansas City, 2; Xavier Rhodes, Minnesota, 2; Ha Ha Clinton-Dix, Green Bay, 2; Janoris Jenkins, New York Giants, 2; Aqib Talib, Denver, 1; Darius Slay, Detroit, 1; Devin McCourty,, New England, 1; Brent Grimes, Tampa Bay, 1; Richard Sherman, Seattle, 1; Eric Weddle, San Diego, 1.

Special Teams

Placekicker

Justin Tucker, Baltimore, 50.

Punter

Johnny Hekker, Los Angeles, 42; Marquette King, Oakland, 4; Pat McAfee, Indianapolis, 2; Brad Wing, New York Giants, 1; Sam Martin, Detroit, 1.

Kick Returner

Cordarrelle Patterson, Minnesota, 41; Tyler Lockett, Seattle, 5; Tyreek Hill, Kansas City, 5.

Punt Returner

Tyreek Hill, Kansas City, 50.

Special Teamer

Matt Slater, New England, 14; Nate Ebner, New England, 12; Dwayne Harris, New York Giants, 6; Justin Bethel, Arizona, 3; James Develin, New England, 3; Michael Thomas, Miami, 3; Chase Reynolds, Los Angeles, 3; Eric Murray, Kansas City, 2; Chris Maragos, Philadelphia, 1; Eric Weems, Atlanta, 1; Josh Bellamy, Chicago, 1.

{ 14 comments }

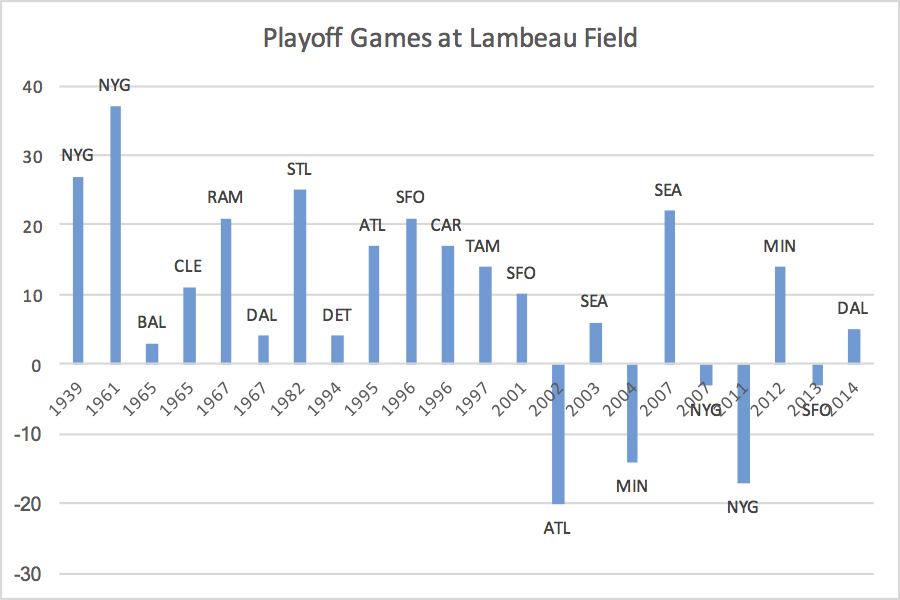
The Packers won every home playoff game for over 60 years. Green Bay was 13-0 at home in playoff games until Michael Vick and the Atlanta Falcons won as 6.5-point underdogs at the end of the 2002 season. Since that 13-0 start, the Packers are a much less intimidating 5-4 in the postseason. Below is the points differential in every playoff game in Green Bay in NFL history:

[continue reading…]

{ 11 comments }

Three games this year had an over/under of 38 points: Rams/Seahawks in week 2, Jaguars/Vikings in week 14, and Broncos/Chiefs in week 16. But today, with the Brock Osweiler-led Texans — Houston ranked 30th in offensive DVOA — facing off against the Connor Cook-led Raiders, in his first ever start, the over/under in Houston is just 37 points.

In addition to being the lowest in a game this season, it’s also the lowest in a playoff game in five years.  Two years ago, the Ryan Lindley Cardinals and Panthers faced off in Carolina; the over-under was 37.5, and Lindley had one of the worst playoff games ever. But the last time a playoff game had an over/under of 37 or lower was in 2011, when Tim Tebow and the Broncos traveled to Pittsburgh. Tebow wound up having an incredible game, leading Denver to a 29-23 win in a game where the over/under was just 34.

In a game with the worst quarterback in the NFL during the 2016 regular season against a quarterback who has never made an NFL start, you can understand why we have the lowest over/under of the season.

But betters, take note. From 2002 to 2015, there were 18 playoff games where the over/under was less than 37.5. In those games, 11 went over, 1 was a push, and 6 went under.

What do you predict today? I was leaning Oakland, but I think the loss of Donald Penn will change things. This feels like a true toss up.

{ 3 comments }

Post Your 2016 Playoff Predictions here

Post your playoff predictions in the comments. Here are mine:

Wild Card Round

(5) Oakland over (4) Houston
(3) Seattle over (6) Detroit
(3) Pittsburgh over (6) Miami
(5) New York Giants over (4) Green Bay

Divisional Round

(1) Dallas over (5) New York Giants
(2) Atlanta over (3) Seattle
(1) New England over (5) Oakland
(2) Kansas City over (3) Pittsburgh

Conference Championships

(1) New England over (2) Kansas City
(1) Dallas over (2) Atlanta

Super Bowl

(1) New England over (1) Dallas

This is a pretty chalky set of picks, but it feels like there are a few tiers in the NFL:

Tier 1: New England. Okay, the Patriots do seem vulnerable without Rob Gronkowski. Tom Brady averaged 9.33 Adjusted Yards per Attempt during the regular season (excluding sacks). On passes to Gronk, Brady averaged an unreal 15.8 AY/A, with 540 yards and 3 touchdowns on 38 targeted passes. On all other passes, he averaged 8.85 AY/A. That’s still great, but an offense with the two highest targeted players are Julian Edelman and James White has the ability to be contained in the playoffs. And while the Patriots don’t have a great defense, the team easily led the NFL in both points allowed and points differential. [continue reading…]

{ 31 comments }

The regular season is now over, and it ended with a whimper. Of the 16 games in week 17, 6 featured margins of 17+ points, and a 7th had a Game Script of +15.2. There were two big comebacks, but they came in meaningless games: The Colts overcame a 17-0 deficit to win 24-20, with the final margin coming on a touchdown pass in the final seconds.

The Steelers, with their stars rested, trailed most of the day against the Browns. This game wasn’t meaningless to San Francisco, though: Cleveland led 14-0 early and 14-7 entering the 4th quarter; had the Browns won, the 49ers would have had the number one pick. Instead, Pittsburgh won in overtime, cementing a 1-15 year for the Browns.

Below are the week 17 Game Scripts. [continue reading…]

{ 4 comments }
Previous Posts