≡ Menu

Today’s guest post/contest comes from Thomas McDermott, a licensed land surveyor in the State of California, a music theory instructor at Loyola Marymount University, and an NFL history enthusiast. As always, we thank him for his hard work. You can view all of his work at Football Perspective here.


If you can get five people in a room to agree on what a sports dynasty is, you’ll probably have achieved the most miraculous agreement in history since the Congress of Vienna. We know a sports dynasty when we see one (the current Patriots, the New York Yankees, 1990s Bulls, etc.), but it becomes less clear once we attempt to actually define it:,When does the dynasty start? How long must it last? What are the requirements?

In this article on NFL dynasties, FiveThirtyEight does a nice job of negotiating the quagmire by just listing the “best team over any number of years”. [1]Their definition of “best” being their ELO ratings. I’m going to do the same thing here, but focusing solely on NFL defenses since the merger (regular season only). The metric is points allowed by the defense (meaning: fumble, interception, kick and punt return touchdowns, and safeties aren’t included), adjusted for era and strength of schedule (basically, SRS ratings). Regular readers may recall that I published these results back in August 2015. To differentiate this stat from Pro-Football-Reference’s DSRS, I’ll call it “DfSRS”.

Below is a table of defensive dynasties, ranging from 1 to 15 years: [continue reading…]

References

References
1 Their definition of “best” being their ELO ratings.
{ 15 comments }

The Jets, The Giants, And MetLife Stadium

MetLife Stadium opened in 2010. Over that time period, the Jets are 30-26 at home (a hair below-average), while the Giants are 32-24 (right at league average). And, over that same time period, the Jets are 22-34 on the road (slightly below-average), while the Giants are 26-30 in road games (slightly above-average). [1]Note that this includes the two games where the Jets and Giants played at MetLife Stadium; the “road” team won in both games.

So the Jets are +8 in games at MetLife, while the Giants are +6. In home games, the Giants have outscored opponents by 142 points (16th-best), while the Jets have only outscored opponents by 51 points (23rd-best). In road games, the Giants are at -121 (also 16th-best), while the Jets are at -344 points (28th-best).

The Giants had a great year at home in 2016 while the Jets did not; the numbers were much different a year ago, when the Jets appeared to be gaining a much better home field advantage at MetLife than the Giants. That was driven, in large part, by performance in one score games. From 2010 to 2015, the Giants were 8-13 in home games decided by 7 or fewer points, while the Jets are 13-8; that made the Giants one of the worst teams at home in close games, and the Jets were one of the best. But last year, the Giants went 6-1 in home games decided by a touchdown or less, and the Jets went 0-3.

So the conclusion in today’s post? The Jets and Giants are getting about the same home field advantage from MetLife Stadium. That in and of itself isn’t necessarily an important conclusion [2]Although past research showed the Giants may have been better at Giants Stadium. But there are two worthwhile takeaways from this post. [continue reading…]

References

References
1 Note that this includes the two games where the Jets and Giants played at MetLife Stadium; the “road” team won in both games.
2 Although past research showed the Giants may have been better at Giants Stadium.
{ 2 comments }

According to the Pro-Football-Reference.com coaching database, there’s only one man in NFL history that has been, at various points in his NFL career, both an offensive coordinator and a defensive coordinator. Can you name him?

There are some coaches, off the top of my head, who have spent time coaching on both sides of the ball.   Bill Belichick has been heavily involved with the Patriots offense for about a decade (New England didn’t even have an offensive coordinator in 2009 or 2010), and while he never held any official title, he also was the Detroit Lions receivers coach in 1977. Eric Mangini was an offensive assistant for the Browns and Ravens, and also a tight ends coach for the 49ers, while spending time as a defensive assistant (and later head coach) for the Jets, and defensive backs coach and defensive coordinator for the Patriots (he also was the 49ers DC in 2015, his last coaching gig). Juan Castillo has mostly been an NFL assistant on the offensive side of the ball (never serving as an offensive coordinator, however), but he did get surprisingly tapped as the Eagles defensive coordinator in 2011, and worked in that role for a couple of years (well, he was fired in October 2012).

But being both an offensive coordinator and a defensive coordinator in the NFL? That just doesn’t happen. Our mystery coach was a position coach on both sides of the ball in college, including as offensive line coach at SMU in 1976 and 1977. He left the college game to joint the NFL as a scout with the Bucs in ’78.

Then, in 1982, the Patriots hired SMU head coach Ron Meyer, and Meyer picked our mystery man to became the Patriots offensive line coach.  He served under Meyer for his entire tenure in New England, which ended in 1984.  In 1985, he joined Darryl Rogers in Detroit as the Lions offensive line coach, and stayed with the team for four seasons.

While our man was in Detroit, Meyer had been hired as the Colts coach, and Meyer inherited defensive coordinator George Hill. But after the ’88 season, Meyer hired our mystery man to join him in Indianapolis as the team’s defensive coordinator.  At that point, he had no really experience coaching defense other than at Delaware Valley, Rhode Island, and Idaho State, but Meyer nonetheless chose him for the job.  The Colts defense wasn’t great (although it wasn’t terrible, either) in ’89 and ’90, but in ’91, Meyer moved from Indianapolis defensive coordinator to Indianapolis offensive line coach. [continue reading…]

{ 11 comments }

There are currently five head coaches in the NFL that used to be coordinators for the Atlanta Falcons. If you’re a betting man, Steve Sarkisian may be the next to join the list.  Sark was a Pac-12 head coach for six years (four in Washington and two at USC) before spending last season as the Alabama offensive coordinator.  He’s now the 2017 Falcons offensive coordinator, and that’s a pretty good place to be. The last four offensive coordinators for the Falcons — Kyle ShanahanDirk KoetterMike Mularkey, and Hue Jackson — are the current head coaches in San Francisco, Tampa Bay, Tennessee, and Cleveland. Mike Zimmer, the Falcons defensive coordinator opposite Jackson in the Bobby Petrino-doomed 2007 season, is the Vikings head coach, giving Atlanta a league-high five former coordinators who are current head coaches.

In the last few years, the Broncos have had four coordinators go on to become head coaches elsewhere: Jack Del Rio and Adam Gase are the head coaches in Oakland and Miami, while Mike McCoy (San Diego) and Dennis Allen (Oakland) have since been fired. The Ravens have also had four coordinators in the last decade get promoted: Gary Kubiak (Denver) and Rex Ryan (Jets, Bills) are no longer current head coaches, while Chuck Pagano (Colts) and Jim Caldwell (Detroit) are still active head coaches.

In addition to Atlanta, the Bengals are responsible for three current head coaches: the Cincinnati platform lifted Hue Jackson to Cleveland, Mike Zimmer to Minnesota, and Jay Gruden to Washington.

Since 1990

Since 1990, two teams have sent an incredible 9 coordinators to become head coaches of different franchises. For Denver, in addition to the four above, Gary Kubiak, Jim Fassel, Wade Phillips, Mike Shanahan (due to his time as head coach in Washington), and Chan Gailey were all coordinators in Denver since 1990 and then become head coaches elsewhere.

The other team is the 49ers, although all 9 coordinators were in San Francisco from 1991 to 2006. The full list, from most recent to least:
Norv Turner, Mike McCarthy, Jim Mora, Marty Mornhinweg, Pete Carroll, Marc Trestman, Ray Rhodes, Mike Shanahan, and Mike Holmgren.

Fewest

As discussed yesterday, the last Tampa Bay coordinator to become a head coach at another franchise was back in 1984. Each other team has sent at least one coordinator since ’05 on to become the head coach somewhere else.

Since 1990, three teams have vaulted just one coordinator to a head coaching job for another team. The Colts had Bruce Arians as the team’s offensive coordinator (and interim head coach) in 2012, and has been the Cardinals head coach since. For Houston,
the coordinator history has not been great, and Kyle Shanahan (the team’s OC in ’08 and ’09 before moving on to Washington) just became the first one to get a head coaching gig. The final team is Detroit: Dick Jauron was the Lions defensive coordinator in ’04 and ’05 (also serving as interim head coach), before becoming the Bills head coach in ’06.  Detroit and Tampa Bay are the only teams that don’t have a coordinator since ’06 go on to be a coach elsewhere, but with Jim Bob Cooter and Teryl Austin being highly regarded, that could change soon.

The table below shows all offensive and defensive coordinators since 1990 to become head coaches at other teams (ignoring interim head coaches): [continue reading…]

{ 5 comments }

In the Tampa Bay Buccaneers franchise history, they have only had two coordinators become head coaches after leaving central Florida (Dirk Koetter, of course, went from Bucs OC in 2015 to Bucs HC in 2016): Wayne Fontes was the Bucs first ever secondary coach, during the team’s inaugural season of 1976, and he stayed in that role throughout his time in Tampa Bay under John McKay. Fontes was promoted to defensive coordinator in ’82, and led the defense for the final three years of McKay’s tenure.  When McKay retired from coaching after 1984, Fontes nearly got the Tampa Bay head coaching job: when it went to Leeman Bennett instead, Fontes went to Detroit to become the Lions defensive coordinator.  From there, he got promoted to interim head coach in 1988, and became the team’s head coach on a full-time basis beginning in 1989.

McKay also had another young assistant turn into a head coach: Joe Gibbs.  The Hall of Fame head coach famously coached under the great Don Coryell in both St. Louis (as running backs coach from ’73 to ’77) and San Diego (as offensive coordinator in ’79 and ’80), along with the San Diego State Aztecs in the ’60s.  So how did Gibbs wind up in Tampa Bay?

Well, the Cardinals lost their final four games in 1977, Coryell was hired and planned to the the year off from coaching (that didn’t entirely work out). That left Gibbs without a job in ’78, but the timing was right: Gibbs coached under McKay at Southern Cal in 1969 and 1970, and since the Bucs were looking for an offensive coordinator, the timing worked out nicely.  Gibbs was instrumental in Tampa Bay drafting Doug Williams that year, and the rookie was an above-average passer in 10 starts.  After the year, Gibbs reunited with Coryell in San Diego for two seasons before building his legacy in Washington.

Incredibly, though, Fontes and Gibbs are the only two coordinators in Tampa Bay history to go to become head coaches. Take a look: [continue reading…]

{ 13 comments }

In 5 years, one of Tom Brady, Peyton Manning, and Drew Brees will be the all-time leader in passing touchdowns. Currently, Manning is the passing touchdown king with 539 touchdowns, but will Brees or Brady catch him?

A year ago, I wrote about the fascinating touchdown race between Brady and Brees: at the end of the 2015 season, both had thrown 428 career touchdown passes. Last year, Brees threw 37 while Brady threw 28 in 12 games, so Brees is currently up 9 on Brady, 465-456.

But when I measured Brees and Brady last year, I measured them by calendar year. Both threw their first touchdown pass in 2001, so I thought a calendar year-by-year chart would be cool. But it probably makes more sense to compare the passers year-by-year by age, as I did yesterday with Brees and Manning for passing yards. That’s because Brees is about a year and a half younger than Brady (in turn, Brady is about a year and a third younger than Manning, but we haven’t compared them by calendar year).

So if we plot their passing touchdowns by age, Brees appears to have a huge leg up on Brady. That is, unless Brady plays until he’s 45: [continue reading…]

{ 107 comments }

Drew Brees didn’t get much of a headstart on his way to becoming the NFL’s all-time leader in passing yards. As you know, Peyton Manning is the current leader in that category, having retired with 71,940 passing yards.  Manning and Brees both entered the NFL at the age of 22, but Manning started 16 games as a rookie, while Brees played in just one game.  Young Manning was also a bit better than young Brees: that fact, combined with Manning’s 3,518-yard edge as rookies, and Brees missing 5 games at the age of 24 gave Manning a huge early lead.

Thru ages 26, 27, and 28, Manning had a lead of over 8,000 yards on Brees.  But beginning at age 29, Brees started to fight back.  Through age 34, Manning’s lead had dwindled to 3,747 passing yards, though they remain the only two players with over 50,000 passing yards through age 34.  Manning would miss all of his age 35 season with his neck injury, which allowed Brees to finally pass him and become the career leader in passing yards through age 35.

Since then? Well, Brees continues to match Manning, even putting up his own 5,000-yard season at age 37, which is what Brees was in 2016.  For Manning, age 37 was his last great season, age 38 was his last good season, and age 39 was his final year, where he threw for just 2,249 yards.  In other words, if Brees has made it this far, the tough stuff is done: exceeding Manning’s production through age 37 was the hard part.

The graph below shows each player’s career passing yards through X. It’s color-coded by team, showing Brees’ time with the Chargers and Saints, and Manning’s with the Colts and Broncos.  As you can see, Brees has had the edge on Manning over the last three seasons: [continue reading…]

{ 19 comments }

Pythagenpat History, 1960-2016

Yesterday, I looked at Pythagenpat records in 2016. Today, let’s look at the Pythagenpat records for each team since 1960. [1]Note that since today’s dataset covers a much longer period, I used 0.255 as the best-fit exponent to determine what exponent used for each team. More explanation available here. The table below shows the following information for all 1,613 teams since 1960:

The top team by Pythagenpat winning percentage was the 1962 Green Bay Packers, who scored 415 points and allowed just 148 points. That translated to a 0.929 winning percentage, and an even better 0.934 Pythagenpat Winning Percentage. The Packers therefore “underachieved” by 0.005, which ranks as the 851st best difference since 1960. The team’s main passer (by attempts) and coach (by games) were Starr and Lombardi, of course.
[continue reading…]

References

References
1 Note that since today’s dataset covers a much longer period, I used 0.255 as the best-fit exponent to determine what exponent used for each team. More explanation available here.
{ 8 comments }

2016 Pythagenpat Records

If you’re not familiar with how to calculate Pythagenpat records, you can read this post.

But the short version is, this is a slight upgrade on using Pythagorean records, which I assume most of you are familiar with. The formula to calculate a team’s Pythagorean winning percentage is always some variation of:

(Points Scored^2) / (Points Scored ^2 + Points Allowed^2)

Here, instead of using 2 as the exponent, we use a dynamic exponent that changes based on how much scoring occurs in each team’s games. Here are the 2016 Pythagenpat records: [continue reading…]

{ 5 comments }

Superman Eddie Price

Eddie Price, wearing 31 for the Giants

Even the most hardcore of NFL fans probably haven’t heard of former Giants running back Eddie Price. His career totals — 3,292 rushing yards, 24 touchdowns, 672 receiving yards — are unimpressive; his football career was anything but.

In 1942, Price was considered perhaps the best high school football prospect in the country, but World War II prevented him from being part of the next great super team at Notre Dame. Instead of going to play for Frank Leahy and the Fighting Irish, Price reported to New Orleans for his service. After the war, he stayed in New Orleans and attended Tulane, and helped power one of the best teams in school history. Price played at Tulane in the late ’40s and was a superstar:

He became the first Green Wave player to rush for more than 200 yards in a game, the first to top 1,000 yards in a season and the first in NCAA history to surpass 3,000 yards for his career.

He was named an All-American in 1949 and was twice named All-SEC. He also set the SEC rushing record with 1,178 in 1949. Price nearly beat his record in 1950 with 1,137 yards and his 1949 mark stood unbroken for 27 years.

Price’s career at Tulane was legendary. In his first collegiate game, he had a 103-yard kickoff return against Alabama for a touchdown that led to a 21-20 upset. He later helped Tulane beat the Crimson Tide in ’48 and ’49, too. In fact, Price was so dominant in his three years with the Green Wave that he retired as the NCAA’s all-time leading rusher with 3,095 yards.  He helped Tulane beat LSU by the score of 46-0 in 1948 by rushing for 116 yards and two scores; the Louisiana schools used to face off every year, but the Green Wave didn’t beat the Tigers again until 1973.  As a senior, Price led the NCAA in yards per carry.

In 1950, Price was the 20th player selected, going in the second round to the Giants. And that’s when he really took off.  As a rookie, he led the NFL in rushing yards per game at 70.3. Price missed two games, but otherwise had a magnificent rookie season: he finished the season with 145 yards, 156 yards, and 103 yards rushing in three of the Giants final four games. [continue reading…]

{ 20 comments }

In general, sack data for team defenses is not super consistent from year to year. Since 1990, the correlation coefficient between sack rate (for defenses) in Year N and sack rate in Year N+1 is 0.27. The best-fit formula (using a linear regression cover the years from ’90 to ’16) to predict sack rate for next year would be to use a constant of 4.8%, and then add 26% of the defense’s sack rate from the prior season.

That’s not too surprising of a result, but I was curious whether adding  each team’s concentration index would help make sacks more predictive. As it turns out, the answer is a little complicated. I ran the same regression as above, but used each defense’s concentration index as a second variable.  The change didn’t improve the correlation at all, and the p-value on the concentration index variable is 0.65, making it essentially meaningless.  But it may be a little more complicated than that.

The team with the biggest decline since 1990 in sack rate, year over year, is the 2008 Chiefs. In ’07, Kansas City had a sack rate of 7%, the 8th-highest in the NFL. In 2008, it dropped to just 2%, the lowest in modern NFL history. And in 2007, Kansas City had the second most concentrated pass rush in the NFL, largely based on Jared Allen and his 15.5 sacks.  In ’08, Allen was in Minnesota, and the Chiefs didn’t have a single player more than three sacks.  This makes perfect sense: KC’s pass rush was very good in ’07 but centered around a superstar defender; without him the next year, the pass rush fell apart.

Sounds simple, right? Except that’s just one example.  In 2000, the Titans had the 2nd best pass rush but just the 28th most concentrated: six Tennessee defenders had at least four sacks, and another six had at least two sacks, while Jevon Kearse and his 11.5 sacks made up just 21% of the team’s sacks.  This sounds like a diverse pass rush that should be more sustainable from year to year, but in ’01, the team’s sack rate basically fell in half.

Analyzing sack data is very complicated: you have to factor in regression to the mean, Game Scripts, and also the randomness involved with something that only happens once every 15 or so passing plays. That said, the table below shows the 50 teams with the most concentrated pass rushes since 1982. In other words, these were the teams that were built around just one or a handful of elite pass rushers: [continue reading…]

{ 2 comments }

Concentration Index and Defensive Sacks

Are sacks more highly concentrated among a few players now? Look at the 2016 Raiders: Khalil Mack, who won the Defensive Player of the Year award by one vote over Von Miller, had 11 sacks. But Mack and Bruce Irvin (7.0 sacks) were the only Oakland defenders to record more than three sacks last year, and only six Raiders finished the year with a sack. In Atlanta, Vic Beasley led the NFL with 15.5 sacks, but only eight other Falcons had a sack, and no other Falcon had more than five. Meanwhile, the ’86 Oilers had 17 players record at least one sack and no player with more than five sacks!

In 2014, J.J. Watt had 20.5 of Houston’s 38 sacks. And in 2012, Aldon Smith had just over half of the 49ers sacks, too. But are things really getting more concentrated? Memory can play tricks on us: after all, in 1989, Tim Harris had 19.5 sacks for the Packers, which represented 57% of all Green Bay sacks that year.

As it turns out, the Raiders and Falcons weren’t great examples to measure the modern NFL. They were the two most concentrated teams in the NFL last year in terms of sacks. Let’s look at the Raiders sack totals more closely, and use the same methodology we’ve used the last few days (also known as the Herfindahl index): [continue reading…]

{ 5 comments }

RBBC, Rushing Concentration, and Outliers

In 1984, James Wilder had 407 carries for Tampa Bay at a time when the league was only beginning to shift away from running back by committee. In fact, by the end of the ’84 season, three of the highest single-season carry totals in NFL history had taken place that year, with Walter Payton and Eric Dickerson joining Wilder as true workhorses. The ’84 Bucs had the most concentrated rushing attack of any team in an era of increasingly concentrated rushing attacks.

Take a look: in ’84, Wilder had 1,544 rushing yards, which represented 86.94% of all Bucs rushing yards. The square of that is 75.58%; sum the squares of all players who gained rushing yards for Tampa Bay last year, and you get a concentration index of 75.87%.

PlayerRushYdsPercSqrd
James Wilder407154486.94%75.58%
Steve DeBerg28593.32%0.11%
Mel Carver11442.48%0.06%
Jack Thompson5351.97%0.04%
Adger Armstrong10341.91%0.04%
Michael Morton16271.52%0.02%
Gerald Carter1160.9%0.01%
Scott Dierking3140.79%0.01%
George Peoples120.11%0.00%
James Owens110.06%0.00%
Total4831776100%75.87%

James Wilder was a one man offense

That was a truly remarkable number in the historical context of 1984. It crushed an NFL record set just one year earlier: the ’83 Rams, with a rookie Dickerson, had a rushing concentration index of 65.95%. Only one other team – the ’81 Oilers — had a concentration index of over 60% when the Bucs hit 76% in 1984.

The average team had a rushing concentration index of 35.5%, and the standard deviation among the teams in 1984 was 13.7%. As a result, Tampa Bay’s rushing concentration index was 2.96 standard deviations above average, known as the Z-Score. That was the 2nd most concentrated score from 1946 to 1984, snugly fit in between the 1966 Patriots (2.93) and 1967 Patriots (2.97).

In 1966, the Patriots led the AFL in rushing attempts and featured a two-back offense with Jim Nance (299 carries) and Larry Garron (101 carries). But since Nance averaged 4.9 yards per carry and Garron just 3.2, Nance wound up rushing for about 74% of the Patriots rushing yards that season. In ’67, New England ran less often, but Nance took a larger share of the load. He had 269 carries to Garron’s 46, and had 76% of all Patriots rushing yards in a very RBBC-centric era. From ’66 to ’67, Nance wasn’t just the top RB in the AFL but in all of pro football. Thanks to his heavy workload, he easily outrushed two HOF RBs in the primes of their career during those seasons.

The table below shows each team that had a Z-Score of at least 1.25 in rushing concentration. Here’s how to read it. In 1991, the Cowboys behind Emmitt Smith had 1,726 rushing yards. [1]This excludes any player who finished the season with negative rushing yards. The squared result of each player’s percentage — i.e., the concentration index — was 82.3%. The standard deviation among all teams that year was 13.9%, and the league average was just 33.9%, giving the ’91 Cowboys a Z-Score of 3.48. In other words, the ’91 Cowboys’ rushing attack was so concentrated for that season that it was 3.48 standard deviations above average. That’s why it ranks 1st in this metric. [continue reading…]

References

References
1 This excludes any player who finished the season with negative rushing yards.
{ 6 comments }

Three years ago, I looked at the single-season leaders in percentage of team rushing yards. Then and now, the top two seasons belonged to Edgerrin James: he had 94% and 92% of the Colts rushing yards in his first two seasons in the league. There were only three other seasons where a running back had at least 90% of his team’s rushing yards: Emmitt Smith in 1991, Barry Sanders in 1994, and … Travis Henry in 2002. In that post, I calculated for each team the percentage of his team rushing yards gained by that team’s top rusher. Then I calculated the league average percentage gained by each team’s top rusher, and plotted how that varied over time. This was intended to measure how running back back committee centric the league was in each year.

For a less rigorous method to measure RBBC-ness, you can see this post, which looked at games with more than 15 carries.

Both methods show RBBC being heavy in the ’70s, and the stud RB era peaking about 10 years ago.  But if you want to measure rushing concentration, a better method is probably to use the formula described yesterday. So for each team, I calculated the percentage of team rushing yards gained by every player on the team, squared that result, and then summed those numbers for each player on the team. You can read yesterday’s post for more info on the methodology, but here were the results for 2016: [continue reading…]

{ 9 comments }

Five years ago, in one of the first posts at Football Perspective, I looked at league-wide passing distribution in terms of what percentage of receiving yards were gained by the WR1, WR2, WR3, TE1, and RB1 for each team. Today I want to examine passing distribution in a different way: how much are teams spreading it around than ever before?

In the comments to Wednesday’s post, Quinton White described one way economists measure how concentrated industries are, using a relevant football example:

If you wanted to incorporate more than just the #1 guy, then you could sum up the squared shares for all a QBs receivers. For example, say a QB threw to 7 guys, and the first guy caught 30% of the yards and the second 20% and the remaining 5 guys each caught 10%, then he would have a concentration index of .3^2 + .2^2 + .1^2 + .1^2 + .1^2 + .1^2 + .1^2 = .18. The higher the number, the more concentrated the passer is. The max is 1 (Brees threw all his passes to Cooks then 1^2 = 1). If he threw 10% to ten guys each, then the index would be .1.

Let’s say we did that for the 2016 Falcons, who had the best passing game in the NFL last season. Atlanta’s skill position players gained 4,960 receiving yards last year. In the table below, column 2 shows the number of receiving yards gained by each player, column 3 displays their number of receiving yards divided by 4,960, and column 4 shows the squared result of what is in column 3. The bottom right cell in the table is the sum of all the numbers in column 4, or 14.14%. [continue reading…]

{ 18 comments }

There’s no debate: FP is really good and a team effort.

On June 15, 2012, I launched Football Perspective. Since that day, Football Perspective has posted a new article every single day. Remarkably, this is the 1,998th post published at this site.  You can fact check that claim here, and at the top of every page is a link to the Historical Archive, a page that is updated after each post is published.

There’s no way this site could still be up and running — much less producing content daily — without this community.  Getting to know you, getting help from you, and just learning and enjoying football with you is an awesome experience. Your contributions to Football Perspective is what makes this a website and not a diary. A special thanks to all the guest writers, who help keep this site fresh and interesting.

Every day, I consider myself lucky to be able to participate in a community where people willingly take time out of their busy lives to check this little site.  But today, I consider myself just that much luckier.  Thank you to the many people who have helped me get this site to where it is today. I hope you forgive me if the site’s 1,998th post is a little shorter than most, but hey: we have a birthday to celebrate.

{ 22 comments }

Drew Brees and Spreading It Around

In 2016, Odell Beckham gained 34% of all Giants receiving yards, the highest share in the NFL. For 31 of 32 teams, at least one player gained 20% of their team’s receiving yards, but for the Bills, Robert Woods led the team in receiving despite being responsible for only 19% of Buffalo’s receiving yards.

But since Drew Brees came to the Saints in 2006, no team has spread it around more than New Orleans. On average, Brees’ leading receiving has been responsible for only 22% of the Saints receiving yards each year. The table below shows the average percentage of team receiving yards gained by the top receiver (RB, WR, or TE) for each team in each season over the last 11 years. The Falcons, buoyed by long runs of success by Roddy White and then Julio Jones, have been the most WR1-heavy passing game, while the Saints have been the most diverse: [continue reading…]

{ 14 comments }

Saints wide receiver Michael Thomas is in about as good a situation as it gets. Here’s what he has in his favor:

  • The Saints pass the ball a ton. The last three years, New Orleans ranked 2nd each season in pass attempts, finishing 2 attempts behind the Colts in 2014, 9 attempts behind the Ravens in 2015, and 5 attempts behind the Ravens last year. The Saints have an even 2,000 attempts over the last three seasons, the Ravens are 2nd with 1,909, and the Colts are 3rd with 1,864. It’s true that New Orleans did just add Adrian Peterson, but the Saints are well-established as the league’s preeminent pass-heavy team.
  • Thomas, unlike players on the Ravens, gets to play with a superstar quarterback in Drew Brees. Because more important than the 2,000 attempts is that New Orleans has thrown for 14,808 gross passing yards the last 3 years, more than 1,000 yards more than anyone else. Only the Falcons, Steelers, and Patriots have even 13,000 passing yards.
  • As a rookie, Thomas and Brandin Cooks were essentially WR1A and WR1B in New Orleans. Cooks had 117 targets, 1,173 receiving yards, and 8 TDs in 16 games, while Thomas had 121 targets, 1,137 yards, and 9 TDs despite missing one game. But here’s where it gets exciting for Thomas: Cooks was traded in the offseason, and will be replaced with 32-year-old Ted Ginn.

Is there a more favorable situation for a WR to produce massive stats? Unless you just think Thomas will be harmed by all the attention — and that’s where Peterson should help — this is basically as good as it gets. He’s on the league’s most pass-happy offense, with a top-3 quarterback, and he is likely going to get fed a significant amount of targets. As a rookie, Thomas was targeted on 18.2% of passes. That number is almost certainly going to rise this year. The most targets any Saint has had with Brees is 149, set by Jimmy Graham in 2011.

But there is one other thing that helped Thomas last year. The Saints threw 59% of their passes to wide receivers last year, a new high in the Brees era. That coincided with just 17% — a record low since 2008 — of passes going to tight ends. In 2006 and 2007, Reggie Bush was a target monster while Mark Campbell and Eric Johnson were the top tight ends. But beginning in ’08, the Saints had Jeremy Shockey and then Jimmy Graham and a breakout season from Ben Watson in 2015. Last year, Coby Fleener was the tight end, and he was underwhelming. Fleener had a lower catch rate than any Saints wide receiver last year, and that’s not exactly how its supposed to work.

In 2014, Siants receivers had 47% of targets, then 54% in 2015 and 59% last year. Meanwhile, TE targets dropped from 27% with Graham to 24% with Watson and then 17% with Fleener. Take a look: the graph below shows the percentage of targets in New Orleans by position since 2006: [continue reading…]

{ 7 comments }

How Have Previous Michael Thomases Fared?

Five years ago, I asked two questions: how often does the first receiver selected in the Draft turn out to be the best rookie receiver? And how often does the best rookie receiver turn out to be the best receiver from his draft? Yesterday, we updated that post to answer the first question. Today, we look at the second one, and that makes Saints star Michael Thomas (who had 1,137 receiving yards as a rookie in 2016) the focus of this post.

How likely is it that Thomas will turn out to be the best receiver from his class? Thomas has some competition, but though he was farther ahead of the pack than the average top receiver:

Drafted Players Table
Misc Misc Appr Rece Rece Rece
Rnd Pick Tm Player Pos Age To AP1 PB St CarAV G Rec Yds
TD College/Univ
2 47 NOR Michael Thomas WR 23 2016 0 0 1 10 15 92 1137 9 Ohio St. College Stats
2 40 NYG Sterling Shepard WR 22 2016 0 0 1 5 16 65 683 8 Oklahoma College Stats
1 21 HOU Will Fuller WR 22 2016 0 0 1 6 14 47 635 2 Notre Dame College Stats
2 55 CIN Tyler Boyd WR 21 2016 0 0 0 5 16 54 603 1 Pittsburgh College Stats
5 165 KAN Tyreek Hill WR 22 2016 1 1 0 10 16 61 593 6 West Alabama
5 140 TEN Tajae Sharpe WR 21 2016 0 0 1 5 16 41 522 2 Massachusetts College Stats
1 15 CLE Corey Coleman WR 22 2016 0 0 1 3 10 33 413 3 Baylor College Stats
4 112 NWE Malcolm Mitchell WR 23 2016 0 0 0 4 14 32 401 4 Georgia College Stats

So how optimistic should we be that Thomas will in fact finish as the top receiver from this class? You may be surprised to learn that from 1999 to 2013, the top rookie receiver (as measured by receiving yards) *never* finished as the top receiver from his class (as measured by receiving yards). Bookmarking those years? Randy Moss in 1998, and Odell Beckham in 2014. There are a few cases where the top rookie had a great career (Anquan Boldin, Marques Colston, and A.J. Green stand out) but ultimately was bested (to date, in the case of Green) by another star, but also a large number of guys who didn’t quite live up to their potential after year one.

YearTop RookieTeamTeamCareer RkCareer LeaderSame?Rk As Rookie
2016Michael ThomasnorNOR1Michael ThomasSame1
2015Amari CooperraiOAK1Amari CooperSame1
2014Odell BeckhamnygNYG1Odell BeckhamSame1
2013Keenan AllensdgSDG4DeAndre HopkinsDiff2
2012Justin BlackmonjaxJAX13T.Y. HiltonDiff2
2011A.J. GreencinCIN2Julio JonesDiff2
2010Mike WilliamstamTAM8Antonio BrownDiff14
2009Hakeem NicksnygNYG4Mike WallaceDiff4
2008Eddie RoyaldenDEN5DeSean JacksonDiff2
2007Dwayne BowekanKAN2Calvin JohnsonDiff2
2006Marques ColstonnorNOR2Brandon MarshallDiff5
2005Reggie BrownphiPHI5Roddy WhiteDiff4
2004Michael ClaytontamTAM9Larry FitzgeraldDiff4
2003Anquan BoldincrdARI2Andre JohnsonDiff2
2002Antonio BryantdalDAL3Deion BranchDiff5
2001Chris ChambersmiaMIA5Steve SmithDiff13
2000Darrell JacksonseaSEA3Laveranues ColesDiff5
1999Kevin JohnsoncleCLE7Torry HoltDiff2
1998Randy MossminMIN1Randy MossSame1
1997Rae CarruthcarCAR11Derrick MasonDiff4
1996Terry GlennnweNWE7Terrell OwensDiff6
1995Joey GallowayseaSEA1Joey GallowaySame1
1994Darnay ScottcinCIN4Isaac BruceDiff7
1993Horace CopelandtamTAM9Curtis ConwayDiff6
1992Courtney HawkinstamTAM4Jimmy SmithDiff36
1991Lawrence DawseytamTAM13Keenan McCardellDiff20
1990Ricky ProehlcrdPHO1Ricky ProehlSame1
1989Shawn CollinsatlATL8Andre RisonDiff2
1988Sterling SharpegnbGNB4Tim BrownDiff2
1987Ricky NattieldenDEN10Mark CarrierDiff2
1986Bill BrookscltIND3Ernest GivinsDiff2
1985Eddie BrowncinCIN5Jerry RiceDiff2
1984Louis LippspitPIT2Irving FryarDiff9
1983Willie GaultchiCHI4Henry EllardDiff6
1982Lindsay ScottnorNOR9Mark DuperDiff31
1981Cris CollinsworthcinCIN1Cris CollinsworthSame1
1980Art MonkwasWAS1Art MonkSame1
1979Jerry ButlerbufBUF4Drew HillDiff8
1978John JeffersonsdgSDG3James LoftonDiff2
1977Wesley WalkernyjNYJ2Stanley MorganDiff2
1976Sammy WhiteminMIN4Steve LargentDiff2
1975Rick UpchurchdenDEN3Freddie SolomonDiff2
1974Nat MooremiaMIA2John StallworthDiff7
1973Isaac CurtiscinCIN1Isaac CurtisSame1
1972Ahmad RashadcrdSTL2Cliff BranchDiff8
1971Randy VatahanweNWE6Harold CarmichaelDiff6
1970Ron ShanklinpitPIT2Ken BurroughDiff6

You might be surprised to see that the median rank of these rookie receivers is just to finish fourth in their class. In recent years, we’ve seen Tampa Bay’s Mike Williams, Eddie Royal, and Tampa Bay’s Michael Clayton excel as rookies but have disappointing careers. Excluding the players from 2014, 2015, and 2016, the only receivers since 1982 to finish 1st as both a rookie and overall were Proehl, Galloway, and Moss.  Do you think there’s something there, or is that a fluke?

Another interesting: other than Antonio Brown, none of the receivers who wound up as the top receiver in their class really struggled as a rookie. Since 2002, Brown is the only one who didn’t rank in the top five.

{ 4 comments }

How have previous Corey Davises fared?

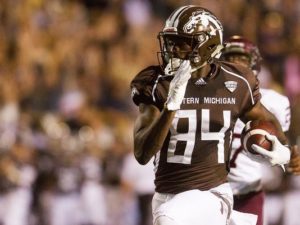
The next star receiver wearing 84 from a directional Michigan school?

Five years ago, I asked two questions: how often does the first receiver selected in the Draft turn out to be the best rookie receiver?  And how often does the best rookie receiver turn out to be the best receiver from his draft?  In the 2017 NFL Draft, the Titans selected Corey Davis, the excellent wide receiver from Western Michigan with the fifth overall pick.

At the time of my original post, the protagonist was Justin Blackmon, the highest selected receiver in the 2012 Draft.  And at the time, the odds looked ugly: from 1970 to 2010, only 4 out of 31 times did the first receiver drafted lead his rookie class in receiving yards: Ahmad Rashad in 1972, Isaac Curtis in 1973, Jerry Butler in ’79, and then Willie Gault in 1983.  When A.J. Green did it in 2011, it ended a streak of 27 straight years where the top receiver didn’t lead the league in receiving yards.

So what’s happened since then? Well, Blackmon did in fact lead all rookies in receiving yards, although the margin over T.Y. Hilton was just four yards. In 2013, Tavon Austin was the first wideout drafted, but he ranked 9th among that group in receiving yards as a rookie with 418. Instead, Keenan Allen (1,046) took top honors that year.

In 2014, Sammy Watkins was the first wideout selected in perhaps the best wide receiver class ever.  Watkins had a very good year with 982 yards (ranking 4th among wide receivers drafted that season), but that was a far cry behind Odell Beckham and his 1305 yards (in just 12 games).  But then two years ago, Amari Cooper joined Green and Blackmon by being the top rookie wide receiver in both the draft and the regular season. Cooper was the 4th overall pick and had 1,070 yards, beating undrafted Willie Snead (984).  Finally, last season, Corey Coleman was the first wide receiver drafted, but he had only 413 yards in 10 games.  In 2016, there was just one great rookie wideout: Michael Thomas had 1,137 yards, and no other rookie receiver had even 700 yards. [continue reading…]

{ 2 comments }

It’s early June, but pretty soon we will all be gearing up for 2017. So I thought I’d open things up and ask what you guys want to read (or write — freelance articles are always welcome!) about over the next three months.

Do you want more analysis of the 2016 season? Articles covering NFL history? Preview articles for 2017? Deep stat dives?

Throw it all out there, and I’ll chime in in the comments.

Thanks,

Chase

{ 22 comments }

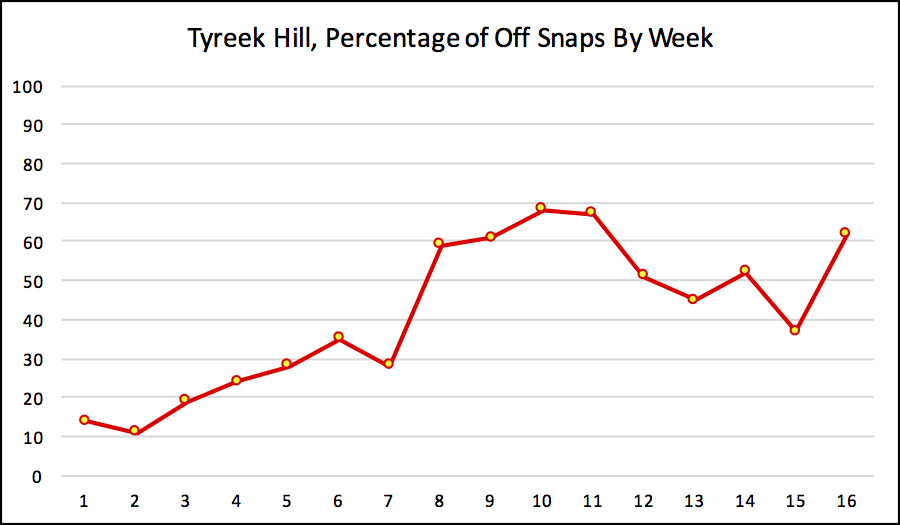
Tyreek Hill was noticeably absent from yesterday’s list of yards from scrimmage leaders. The main reason for that? Hill was a part-time player for the first seven weeks, failing to take the field on even half of Kansas City’s offensive snaps in even a single game.  By the end of the year, he was a more regular part of the offense, although he never participated in 70% or more of the Chiefs offensive plays in any regular season game (and in the playoff loss to Pittsburgh, he was present for 69% of Kansas City’s offensive snaps). The graph below shows the percentage of offensive snaps he was on the field each week of the 2016 regular season:

[continue reading…]

{ 5 comments }

Doug Drinen wrote this article 11 years ago, and it serves as a good reminder to always look at offensive numbers in the context of a player’s team. Yesterday, I looked at tackle leaders as a percentage of team tackles.  Today we will do the same thing with yards from scrimmage.

Arizona running back David Johnson led the NFL in yards from scrimmage last year with 2,118 yards. The Cardinals as a team gained 6,157 yards of offense (before deducting for sack yards lost), which means Johnson gained 34.4% of his team’s total output. That also led the league. However, Steelers RB Le’Veon Bell missed three games due to suspension and sat out a meaningless week 17 game.  Bell averaged 157 yards per game last year, the third-most in NFL history. He was responsible for 30.7% of the Steelers total yards from scrimmage last year, but on a pro-rated basis (i.e., multiplying that by 16/12), that jumps to an insane (although not historically extraordinary) 40.9%.

That’s the column the table is sorted by below. Here’s how to read Bell’s line. He gained 1,884 yards for Pittsburgh, while the Steelers as a team had 6,137 total yards. Bell therefore was responsible for 30.7% of Pittsburgh’s yards, but he only played in 12 games. On a pro-rated basis, he ranks first at 40.9%. The table below shows the top 75 leaders in this metric, minimum 6 games played: [continue reading…]

{ 4 comments }

Kuechly’s stats match his hype

Do you know who led the NFL in tackles in 2016? It was Tampa Bay’s second-year linebacker Kwon Alexander, with 108 solo tackles.  If you give half-credit for assists, Kwon – who had 37 assists — would get 126.5 total tackles.  That would be the second-most in the league, just behind Seattle linebacker  Bobby Wagner (86 solos, 82 assists, for 127 total tackles).

Tackles aren’t a great stat for a lot of reasons.  One reason is the statistic treats all tackles the same.  Another is it ignores opportunity: the 49ers led the NFL last year with 855 total tackles (again, treating assists as half-tackles), which helped safety Antoine Bethea rank 9th in the league in solo tackles.  That’s because the 49ers defense was on the field a ton last year; meanwhile, the Eagles recorded the fewest total tackles in the NFL last season with just 699.  Eagles linebacker Nigel Bradham had 67 solos and 81 assists last year, but that total looks a lot better when you realize he was responsible for about 12% of all Eagles tackles in 2016.

In addition to looking at total tackle numbers as a percentage of his team’s tackles, there’s one other adjustment worth making. Carolina’s Luke Kuechly had 86.5 total tackles last year, good enough for 11.0% of Carolina’s 785 total tackles. But Kuechly played in just 10 games! If we multiply his 11.0% tackle share number by 16/10 — in other words, pro-rating for missed games — that means Kuechly gets credit for a whopping 17.6% of all Panthers tackles.

Another player who benefits from this sort of adjustment is Bears linebacker Jerrell Freeman, who had a great first season in Chicago. Freeman had 98 total tackles, or 12.5% of the Bears total tackles, despite missing four games.  If you pro-rate those numbers, he gets credit for 16.6% of all Chicago tackles, second in the league behind Kuechly.

Do this for every defensive player in the NFL, and the top three players in adjusted total tackle share are Kuechly, Freeman, and Wagner.  Alexander, while still impressive, drops to 7th via this method. Below are the top 75 players in pro-rated adjusted total tackle share. [continue reading…]

{ 4 comments }

Like the Browns’ future, Myles Garrett is in good shape.

Before the 2017 NFL Draft, Bill Barnwell wrote about the incredible amount of draft value accumulated by the Browns. At the time, Cleveland’s 2017 draft picks equaled 96.7 points of draft value, but because of some trades – particularly involving Houston’s trade up for QB DeShaun Watson (which hurt the Browns 2017 Draft but added a 2018 1st round pick), along with a pair of trade-ups by the Browns that cost the team some value – Cleveland wound up using 86.9 points of draft value. That was still, by a good measure, the largest amount of draft value for any team in 2017.

In the last 20 years, only two teams had even 85 points of draft value — the expansion Texans (85.2 points) and 2008 Chiefs (86.6 points). As a result, the 2017 Browns had more draft value than any team since the 1993 Patriots (88.4 points)! Meanwhile, the current iteration of the Patriots had very, very little draft value: New England started behind the 8-ball with the last pick in each round, and things only got worse after trading a 1st round pick for Brandin Cooks, a 2nd round pick for Kony Ealy, and a 4th round pick for Dwayne Allen and a 6th rounder. That’s the lowest in the last five years, topping the 2014 Colts (17.3 points of value), and the fewest since the 2012 Raiders, who had just 14.9 points. [continue reading…]

{ 4 comments }

Kaepernick … tuning out the critics?

Yesterday, I wrote Colin Kaepernick was an extreme outlier in 2016 in terms of TD/INT ratio relative to his Net Yards per Attempt average.  Kaepernick ranked tied for 6th in TD/INT ratio, but was 2nd-to-last in NY/A.  At a high level, we have a good clue that the sparkling TD/INT ratio wasn’t as valuable as it seems: that’s because Kaepernick went 1-10 as a starter last year, and the one win came in a game where Kaepernick threw an interception! Now we all know that win-loss record isn’t a good way to judge quarterbacks, especially considering that Kaepernick played for a team that ranked last in points allowed and yards allowed. But the 49ers ranked 27th in points scored and 31st in yards gained, so it’s not as though the defense deserves all of the blame. Because while Kaepernick had a great TD/INT ratio, that disguises how ineffective the passing attack really was. [continue reading…]

{ 12 comments }

A quarterback who was constantly harassed and took a ton of abuse in 2016 and Colin Kaepernick

This website has been pretty light on coverage of Colin Kaepernick, despite his name turning into a traffic boom for the rest of the football world. The last time Kaepernick’s name appeared in a headline was over a year ago, when I wrote about him declining for three straight years (that ended last season). In fact, Kaepernick’s name has appeared in the text of just three articles at FP in 2017, where his name was used in passing in each case.

And I’m not interested in getting into the usual Kaepernick debate. But there is something that Football Perspective is well-equipped to address: the citing of Kaepernick’s 16/4 TD/INT ratio as evidence of his productive play. Regular readers know that I’m not a fan of TD/INT ratio, and Kaepernick is a pretty good case study in why TD/INT ratio is a poor way to judge a quarterback. A 4.00 TD/INT ratio is very good, no doubt: but in the abstract, it doesn’t mean much. And what do I mean by the abstract?

For starters, it only tells us what happened on 5% of all dropbacks Kaepernick had last year. The much more predictive measure of passing performance is Net Yards per Attempt, and there, Kaepernick ranked 29th out of 30 qualifying passers. [1]Neither the Bears nor Browns had a single passer finish with 224 attempts. And, for what it’s worth, he has the worst NY/A average over the past two seasons among the 35 passers with at least 400 attempts since 2015.

So we have a pretty significant disconnect, with Kaepernick ranking 2nd from the bottom, ahead of only Brock Osweiler, in passing efficiency, but tied for 6th with Sam Bradford but in TD/INT ratio. The best thing to do, of course, is to combine the two metrics as we do in ANY/A. There, Kaepernick ranks 23rd out of the 30 qualifying passers. That’s bad, but not horrible, for a starting quarterback. [continue reading…]

References

References
1 Neither the Bears nor Browns had a single passer finish with 224 attempts.
{ 12 comments }

The normal way to measure a franchise’s winning percentage is the simplest. All you need to do is take the team’s total number of wins, add to that number the total number of ties divided by two, and then take that sum and divide it by the team’s total number of games.

That’s simplest and makes sense and is perfectly correct. However, it also means games in 1960 are given the same weight as games in 2016. And depending on what you want to measure, that may not be what you want to do. If you want to measure something like the amount of pleasure a fanbase receives from its team [1]Why would you want to do this? I have no idea., you want to put more weight on recent seasons. [continue reading…]

References

References
1 Why would you want to do this? I have no idea.
{ 19 comments }

Average Age Of Quarterback Starts

Yesterday, I looked Josh McCown’s weird, winding career. McCown started 33 games through age 33, but has since started 27 more games. He’s had one of the weirdest and back-loaded careers in NFL history.

Which made me wonder: how can we measure which quarterbacks had the most front-loaded or back-loaded careers? Here’s one clean way to do it. For every quarterback, identify his exact age for every start of his career, and then calculate the average age in all games he started. For McCown, with 60 starts, his average age (summing his age in every start, and dividing by 60) so far is 30.7. If Josh McCown somehow starts 16 games for the Jets this year, the first will come when he is 38.2 years old, and the last will come when he is 38.5 years old. That will bring his average age of start up to 32.3. That would be pretty old, but not remarkably old the way his median age would be (more on this in a minute).

By this method, the quarterback with the oldest average age is Doug Flutie. The CFL superstar and Bills fan favorite started 66 games in his NFL career, but on average, he was 35.5 years old during his average start. If you read yesterday’s post, you won’t be surprised to learn that after Flutie, Warren Moon, Roger Staubach, and George Blanda have the next oldest average age. Babe Parilli, who is 5th in median age, is down at #10, thanks to 9 starts coming at the age of 22 or 23.

The table below shows the average age and median age of start for all 179 quarterbacks with at least 50 starts. Some fine print: this only covers starts beginning in 1950, so this list may overstate the average age for quarterbacks who played pre-1950; similarly, for current quarterbacks like Luck, this obviously is biased in the other direction. The table below is fully sortable and searchable; by default, it lists the 15 oldest players based on average age of start. [continue reading…]

{ 16 comments }

Josh McCown Is A Really, Really Late Bloomer

Let’s say Josh McCown starts 6 games for the Jets this season. That will give McCown 66 career starts, and shockingly, half of those starts will have come after McCown turned 34 years old. That is remarkable no matter how you slice it, because at the start of the 2013 season, the odds would have been infinitesimal that McCown would start 33 more games in his career. Take a look at his career through 2012: the most likely outcome, I suspect, would be him never starting another game:

 
Year Age Tm G GS QBrec Cmp Att Cmp% Yds TD Int Y/G Rate Sk Yds NY/A ANY/A
2002 23 ARI 2 0 7 18 38.9 66 0 2 33.0 10.2 5 50 0.70 -3.22
2003 24 ARI 8 3 1-2-0 95 166 57.2 1018 5 6 127.3 70.3 25 174 4.42 3.53
2004 25 ARI 14 13 6-7-0 233 408 57.1 2511 11 10 179.4 74.1 31 263 5.12 4.60
2005 26 ARI 9 6 3-3-0 163 270 60.4 1836 9 11 204.0 74.9 18 101 6.02 4.93
2006 27 DET 2 0 0 0 0 0 0 0.0 0 0
2007 28 OAK 9 9 2-7-0 111 190 58.4 1151 10 11 127.9 69.4 14 92 5.19 3.75
2008 29 CAR 2 0 0 0 0 0 0 0.0 0 0
2009 30 CAR 1 0 1 6 16.7 2 0 0 2.0 39.6 1 6 -0.57 -0.57
2011 32 CHI 3 2 1-1-0 35 55 63.6 414 2 4 138.0 68.3 7 43 5.98 3.73
2012 33 CHI 0 0 0 0 0 0 0
{ 22 comments }