≡ Menu

Week 12 Game Scripts: Goff, Wentz, Pass To Victory

The Eagles and the Rams were the two most pass-happy teams of week 12. For Philadelphia, Carson Wentz (and Nick Foles) still had 40 dropbacks in a blowout against the Bears; Eagles running backs combined for only 24 carries despite the game being out of reach for most of the day. Philadelphia had the largest Game Script of the week and also the 5th most pass-happy performance among the 16 winning teams.

In Los Angeles, Jared Goff and the Rams had the most pass attempts and the highest pass ratio of any winning team in week 12; this despite a +7.0 Game Script. This was likely because Goff and the passing attack was very successful, in part because the Saints were down their starting two cornerbacks.

The full week 12 Game Scripts below: [continue reading…]

{ 0 comments }

As it turns out, having Ben Roethlisberger, Philip Rivers, and Tom Brady causes teams to be pretty pass-happy.

In week 11, the Steelers, Chargers, and Patriots all were very pass-happy. Pittsburgh passed on 70 of its plays despite blowing out the Titans, winning by 23 points with a +8.8 Game Script. The Chargers had the biggest Game Script of the week at +20.1, but still passed more often than they ran. There have only been 22 games in history where a team led by 28 points after 2 quarters and after 3 quarters and passed more often than they ran; the last 11 prior to this game all featured Hall of Fame quarterbacks. Speaking of Hall of Fame quarterbacks, the Patriots just became the 4th team to pass on over 65% of plays despite leading by 14+ at halftime and 28+ after three quarters, and one of those teams was the 1999 Panthers in week 17 who kept passing to attempt to run up the score to make the playoffs.

The full week 11 Game Scripts below: [continue reading…]

{ 2 comments }

Carson Wentz and Winning It All On Your First Try

Carson Wentz and the Eagles are 10-1, and are the frontrunners to earn the #1 seed in the NFC and win the conference. Once we get to the playoffs, though, you can imagine what a common refrain will be:

Yes, Wentz and the Eagles are good, but they are unproven in the playoffs!

So, is that a meaningful criticism? Let’s leave out that the quarterbacks of the other two best teams in the NFC are Case Keenum (or Teddy Bridgewater) and Jared Goff, as the NFC playoff field will still likely see Drew Brees and a combination of Cam Newton, Matt Ryan, Russell Wilson, and Matthew Stafford. Here’s the real question: how likely is a QB to win a Super Bowl his first time making the playoffs?

You may be surprised to learn that ten quarterbacks have won the Super Bowl in their year they started their first playoff game (and another ten made it to the Super Bowl and lost).

The list, hidden in spoiler tags for those who want some trivia:


To be fair, only a few of those would count as young funs. Plunkett and Theismann were both 33, Staubach and Hostetler were 29, and Warner was 28. McMahon and Aikman were both 26 but in their 4th year (and Aikman played in a playoff game in reserve in his third year), but Brady, Montana, and Namath certainly qualify as “Wentz-like” when it comes to age and experience.

But what about the hosts of young stud quarterbacks that haven’t won a Super Bowl? In other words, if Brady/Montana/Namath are the 3 positive examples, how many negatives ones are there? There are only 9 quarterbacks who started their first playoff game at the age of 25 of younger and also were on the team that won (or tied for) the most games in their conference. In reverse order…

  • Dak Prescott, as a 23-year-old rookie led the #1 seed Cowboys into the playoffs in 2016, but Dallas lost after the bye to the Packers. Prescott played well in that game, however.
  • A.J. McCarron technically makes the list, as he started a playoff game in place of Andy Dalton. The Bengals lost that game to the Steelers (which was arguably not McCarron’s fault), but given that he was a backup, he doesn’t feel like a great comparison.
  • In 2004, another Pennsylvania young gun took the country by storm: Ben Roethlisberger and the Steelers went 15-1 that year in Roethlisberger’s rookie season at age 22. Roethlisberger struggled in two playoff games, particularly in the loss to the Patriots in the first half of the AFC Championship Game (two first half interceptions, including a pick six, as the Steelers were held to 3 points).
  • In 1986, Doug Flutie started his first playoff game for the Bears in a McCarron-esque situation (he started just one game in the regular season).
  • In 1983, a rookie Dan Marino made the postseason for the 12-4 Dolphins at the age of 22. He lost his first playoff game, although he played pretty well and had a 3-point lead late in the 4th quarter.
  • In 1981, Montana made the playoffs with the 49ers, who had the #1 seed. San Francisco won all three games.
  • In 1975, Ron Jaworski started a playoff game for the Rams in another McCarron/Flutie-esque situation; starter James Harris was injured in the second-to-last regular season game. Jaworski won his only start, although he played most of the NFC Championship Game against the Cowboys, which was a bloodbath.
  • Finally, we have Bob Lee for the 1971 Vikings.  This was another McCarron/Flutie/Jaworski situation: Lee went 3-1 as the Vikings starter due to injuries in 1971, got the start in the playoff game against the Cowboys, and imploded.

So if you are an Eagles fan, yes it’s pretty rare for a young quarterback to win the Super Bowl.  But it’s also pretty rare for a young quarterback to guide his team to the best record in his conference: only Prescott, Rivers, Roethlisberger, Marino, and Montana have done that.  Of that bunch, none of them played badly except for Roethlisberger, with some bad luck (including facing an all-time great QB and/or blowing a fourth quarter lead) ending the seasons for Prescott, Rivers, and Marino.

In the last 20 years, Cam Newton, Matt Ryan, Daunte Culpepper, Donovan McNabb, and Peyton Manning have been young quarterbacks who first led their team to the playoffs in a year where their team finished one game behind the conference leader in wins.  Those stories aren’t quite as impressive.   In general, though, being on the best team in a conference is a pretty good place to start.

{ 9 comments }

The Philadelphia Eagles are 10-1 for the fourth time in franchise history. The Eagles have never started a season 11-0, so this season makes the short list for best start in franchise history.

In 1948, behind head coach Greasy Neale, QB Tommy Thompson, and future HOFers RB Steve Van Buren and WR Pete Pihos, and RB Bosh Pritchard, the Eagles went 9-2-1 and won the NFL title.  In 1949, the Eagles brought back Neale, Thompson, Van Buren, Pihos, and Pritchard, and had similar success.  The team lost to the Bears in week 4 but finished the regular season with a sparkling 11-1 record. Philadelphia repeated as champions, defeating the Rams 14-0 in the NFL title game.

In 1980, the Eagles lost to the Cardinals in week 4, but started the season 11-1 before finishing 12-4 and winning the NFC.  The head coach was Dick Vermeil, the QB was Ron Jaworski, and while RB Wilbert Montgomery and WR Harold Carmichael were the stars on offense, Philadelphia sported a dominant defense that ranked 1st in points allowed, and 2nd in rushing yards allowed, net yards per pass attempt allowed, and rushing yards allowed.  Alas, despite being 3-point favorites, the Eagles lost in the Super Bowl to the Raiders.

The 2004 Eagles was the best Philadelphia team of the modern era.  The team began the season 13-1, with the only loss coming to the 15-1 Steelers in Pittsburgh.  Philadelphia clinched the NFC East after week twelve. The Packers were the 2nd best team in the NFC, and the Eagles bludgeoned them in December 47-3 before a pair of garbage time touchdowns. Philadelphia had a great defense, but the offense centered around Donovan McNabb, Brian Westbrook, and Terrell Owens was unstoppable. In the 14th game, however, Owens broke his fibula and injured his ankle; expected to miss the rest of the year, Owens returned for the Super Bowl, but it was not enough: Philadelphia fell to the Patriots.

If you are an Eagles fan, that’s some pretty good company: all three teams made it to the championship game.

This year’s team seems worthy of being in that discussion. Philadelphia leads the NFL with a 31.9 points per game average, thanks in part to an otherwordly (and unsustainable) red zone success rate of 73.3%.  The Eagles rank 8th in points per game allowed (17.4), and rank in the top 10 in just about every major defensive category.  The Eagles rank 1st in the NFL in points differential, at 14.5 per game.  That’s also the 3rd best in Eagles history through 11 games, behind the ’49 team (+19.6), ’48 team (17.8), and ahead of the 1980 team (+14.3). [continue reading…]

{ 6 comments }

Penn State, at 10-2 and a runner-up in the Big Ten East, is not in the college football playoff discussion. But that doesn’t mean the Nittany Lions haven’t been as good as any team this season. After all, had Penn State had played Ohio State at home and won by 1 point instead of losing on the road the Buckeyes by 1 point, the Nittany Lions wouldn’t be any “better” than they are now, while their record would be much better. An 11-1 Penn State with wins over Ohio State, Iowa, Michigan, and Northwestern, and be a lock to make the college football playoff with a win over Wisconsin in the Big 10 Championship Game.

Penn State ranks 7th in points scored and 7th in points allowed among the 130 teams in the FBS. The Nittany Lions are the only team in the top 10 in both categories, and Alabama (1st in points allowed, 12th in points scored) is the only other team in the top 15 in both; Washington (18th in scoring, 6th in points allowed) is the only other team to rank in the top 20 in both. Penn State has outscored opponents by 26.1 points per game, second to only Alabama (27.6) despite a harder schedule. Penn State lost two games on the road by a total of 4 points; but, even though the Nittany Lions rank 1st in the SRS, the loss to Ohio State — which goes down as the best loss of the season (edging Utah’s 3-point road loss in Washington) — is enough to eliminate them from contention.

As always thanks to Dr. Peter R. Wolfe for providing the weekly game logs. The full week 13 NCAA SRS ratings below: [continue reading…]

{ 0 comments }

When the Los Angeles Chargers started the season 0-4, it was tempting to think that the season was over. But, as I cautioned, not all 0-4 teams are created equally. And while only one team had ever gone from 0-4 to the playoffs (ironically, the Chargers in 1992), that was a little misleading. Most 0-4 teams don’t make the playoffs because of the 0-4 start *and* because they are bad teams. But if the team is a good team, an 0-4 start is not necessarily a death sentence.

Los Angeles is proving that to be the case. Right now, the Chargers rank 7th in the NFL in Adjusted Net Yards per Attempt, and 4th in Adjusted Net Yards per Attempt allowed. The Chargers rank 3rd in the NFL in ANY/A Differential — the difference between those two statistics — and rank 1st in the AFC in that category. Take a look: Take a look: the Y-Axis shows each team’s winning percentage, while the X-Axis displays ANY/A differential.
[continue reading…]

{ 1 comment }

One of the very first trivia questions posted at Football Perspective was about the first quarterback to lose 100 games as a starter. You might have thought that the answer was Archie Manning (35-101-3 career record), but he only had the worst record of all-time; he wasn’t the first to get to 100 losses (answer in the original post). (Actually, that post now appears to have been wrong. At some point since 2012, PFR has updated the career record of Norm Snead from 52-99-7 to 52-100-7. The extra start came in 1965, specifically this game against the Browns; five years ago, PFR had King Hill starting that game; now it had Snead — who went 0/1 — as the starter.

Well, last night, Archie’s son set another record. With the Giants loss to the Redskins on Thanksgiving, Eli Manning became the first quarterback in NFL history to lose 100 starts with a single team. The table below shows all quarterbacks with at least 70 losses with one team, through November 24, 2017: [continue reading…]

{ 4 comments }

Yesterday, I appeared on the Wharton Moneyball Podcast on Sirius XM. It is available on SoundCloud here:

https://soundcloud.com/user-780849378/112217-wharton-moneyball

My segment starts at 31:25.

{ 0 comments }

Every year, I look at the least-conforming games in the NFL. What do I mean by least-conforming? Well, let’s use the Titans trip to Jacksonville in week 2 this season as an example. Tennessee has an SRS of -5.1 this year, while the Jaguars have an SRS of +9.3. Given that the game was in Jacksonville, we would expect the Titans to lose by 17.4 points, assuming 3 points for the home team. In reality, the Titans won by 21 points, a swing of 38.4 points! That was the “weirdest” game of the year.

The Titans were also in the second least-conforming game of the season. Facing a Deshaun Watson Texans team, the Titans traveled to Houston and lost by a whopping 43 points. The Texans — thanks in part, of course, to several non-Watson games — have an SRS of -0.4. So at home against Tennessee, we would have expected the aveage Texans team to win b 7.8 points, not 43 points. That difference of 35.2 was one of just three games where the difference between the actual result and expected result exceeded 30 points. [continue reading…]

{ 0 comments }

Rams kicker Greg Zuerlein has been outstanding this year. Consider:

  • He is 4/4 on kicks from 50+ yards this year. Kickers have made 72% of field goal attempts from that range this season, so the average kicker would have made 2.9 such field goals. As a result, Zuerlein has made 1.1 more 50+ yard kicks than the average kicker.
  • He is 9/9 on kicks from 40-49 yards. Kickers have made 79% of kicks from that range this season, so the average kicker would have made 7.1 of those 9 attempts. Therefore, he made 1.9 more field goals than an average kicker from that range.
  • He is 9/10 on kicks from 30-39 yards. Kickers have made 84% of such kicks this year, so an average kicker would have made 8.4 of his 9 attempts. As a result, Zuerlein has made 0.6 more field goals fro 30-39 yards than the average kicker.
  • From 0-19 yards he was 1/1, and from 20-29 yards, he is 5/5. All kickers have made all attempts form under 20 yards, so he gets no credit for that. And kickers have made 99% of kicks from 20-29 this season, so he gets credit for being .1 field goals made above average here.
  • Kickers have made 94.5% of extra points this year, while the Rams star is 31 of 31. Since the average kicker would have made 29.3 of 31 kicks, it means Zuerlein has made 1.7 more extra points than the average kicker.

Add it up, and Zuerlein has made 3.7 more field goals than the average kicker — worth 11.2 points — and 1.7 more extra points. That translates to 13.0 points above average, the most of any kicker in the NFL. In fact, other than Kansas City’s Harrison Butker, Zuerlein has added twice as much value as all other kickers this year. [continue reading…]

{ 3 comments }

The SRS ratings this week didn’t change much, with very few meaningful games among top teams.

Penn State, Notre Dame, Washington, and Iowa State fell a bit in close wins over bad teams, while Oklahoma State and Iowa suffered losses. The only other top-25 teams (by the SRS) to lose lost to even better teams: Michigan lost to Wisconsin, and N.C. State losing to Wake Forest.

Right now, three Big 10 teams crack the top four, with Georgia and Auburn combining with #1 Alabama to give the SEC three top-10 teams. The full week 12 SRS ratings are below. As always thanks to Dr. Peter R. Wolfe for providing the weekly game logs. [continue reading…]

{ 0 comments }

Over the first two weeks of the season, the Saints had the worst pass defense in the NFL. New Orleans was torched by Sam Bradford and then Tom Brady — which admittedly looks less embarrassing in hindsight — as those two quarterbacks produced arguably the best two performances of the NFL those weeks.

Since then? New Orleans has had the best pass defense in the NFL by a considerable margin. The table below shows passing stats for each defense from weeks 3 through 10. Here’s how to read the Saints line. New Orleans has the best pass defense over that time period, and has won 100% of the team’s games. Opponents have completed only 121 of 226 pass attempts for a 53.5% completion rate, and are averaging only 9.8 yards per completion. The Saints have allowed just 1,036 passing yards (this is net of sacks), 5 TDs, and 10 INTs, while producing 22 sacks. Opponents have a 57.4 passer rating and have thrown for just 54 first downs. Finally, opponents are averaging just 2.77 ANY/A, and 4.54 Adj YPA (which includes a bonus for first downs), and have allowed a whopping 1,005 fewer adjusted yards than average, easily the best in the league. [continue reading…]

{ 5 comments }

In 2006, playing for the Detroit Lions, quarterback Jon Kitna was responsible for every pass attempt by the team. He wound up throwing for 4,208 yards, and ran for another 156 yards. The Lions, being a terrible 3-13 team, finished 32nd in rushing attempts (because they were always losing) and 2nd in pass attempts (because they were always losing).

So you won’t be surprised to see that the Lions threw for a lot of yards (7th most in the NFL) and ran for not many yards (last). And since Kitna took every passing attempt, well, Kitna was responsible for most of the Lions total yards. In fact, the 4,364 yards he totaled wound up representing 81.7% of the Lions 5,337 team yards from scrimmage. That is the most in a single season by any player in NFL history… until, maybe, now.

Here’s a good tip: if you see a stat that says Superstar X has the most Y in history, and it doesn’t tell you who currently has the most Y in history, there’s a good chance it’s a player who isn’t very good. (Also, and this is a more rare rule: if a stat says since X date, it usually means another player had a better season before X date. That’s not the case here; the “in the Super Bowl era” modifier was not necessary.)

Wilson has all 2,543 passing yards thrown by the Seahawks this year, and he also leads the team in rushing. Wilson has 290 rushing yards, so he’s accounted for 2,833 yards for Seattle this year, or 82.1% of the team’s 3,443 yards through ten weeks.

Below are the current list of single-season leaders in percentage of team yards: [continue reading…]

{ 12 comments }

Adjusted Completion Percentage, Part 2

Last summer, I discussed that while completion percentage is a bad statistic, there’s one simple way to improve the metric: include sacks in the denominator.

If a quarterback takes a sack, that is *worse* than an incomplete pass, but it is *better* for the quarterback’s completion percentage. That is Just Plain Wrong.

As it turns out, this really impacts Peyton Manning and, to a lesser extent, Drew Brees. In 2003, Manning led the NFL in both completion percentage (67.0%) and adjusted completion percentage (64.9%). Technically, Manning didn’t win any other completion percentage crowns, although PFR gives him a tie in 2012. [1]Technically, he lost it to Matt Ryan that year once you go out to two decimal places, 68.62% to 68.61% (although if you include sacks in the denominator but keep the minimum at 224 passing plays, … Continue reading However, he won the adjusted completion percentage crown a whopping five more times in his career: 2004, 2006, 2008, 2012, and 2013.

Brees has three completion percentage crowns (a fourth may come this season), but two more adjusted completion percentage titles. From 2003 to 2016, Manning won six AC% titles, Brees won give, and the rest of the league (Cousins, Brady, Palmer) won just three. In fact, from the six-year period covering 2008 to 2013, Manning and Brees won all of the adjusted completion percentage crowns.

The full list of leaders in each year since the merger are presented below, along with where that quarterback ranked in raw completion percentage (using a minimum of 224 passing plays per 16 team games for both metrics): [continue reading…]

References

References
1 Technically, he lost it to Matt Ryan that year once you go out to two decimal places, 68.62% to 68.61% (although if you include sacks in the denominator but keep the minimum at 224 passing plays, Alex Smith was the completion percentage champion in 2012).
{ 2 comments }

Week 10 Game Scripts: Saints Stick To the Ground Game

The Broncos, Saints, Packers, and Steelers were your run-happy teams of week 10.

Denver made the quarterback switch to Brock Osweiler, which is a good reason why they decided to be run-happy. Osweiler had 33 pass attempts, while Broncos running backs had 27 carries… in a game Denver trailed 27-9 at halftime. Consider that New England had a +14.5 Game Script… and finished with a higher pass ratio than Denver!

New Orleans called a running play on 24 straight plays, and passed on fewer than 35% of their plays, the first time that’s happened for the Saints since 2001. Even with a +16.6 Game Script, that’s still incredibly run-heavy.

Green Bay was in a tight game throughout with the Bears, but Jamaal Williams had 20 carries and Green Bay rushed 37 times against the Bears, compared to just 28 pass plays for Brett Hundley (who also had only two rushing attempts).

Finally, Pittsburgh trailed most of the day against the Colts, but Le’Veon Bell still had 26 carries. The Steelers had a nearly 50/50 pass/run ratio, remarkable for a team playing with a -4.7 Game Script.

The full week 10 Game Scripts below: [continue reading…]

{ 0 comments }

Let’s get to the week 9 Game scripts! Yes, these are a week late: my apologies, as well, other topics wound up being covered last week.

The biggest stories of week 9 were the blowout wins by Los Angeles, Philadelphia, and New Orleans. The Rams and Saints followed that up with another pair of blowout wins in week 10, while the Eagles were on bye. But before turning to week 10, let’s review some of the biggest outliers from week nine.

In week 9, the Jets and Panthers were very run-heavy. Lest you forget, the Jets beat the Bills on Thursday night in week 9, and while quarterback Josh McCown did have 5 carries, the running backs combined for 36 carries, while McCown had just 21 attempts. The Jets blew out Buffalo, but consider that the Lions had a similar Game Script and passes on 50% of plays.

Carolina beat Atlanta in a close game where the Panthers trailed for most of the first half. Still, behind Cam Newton and his 9 carries, Carolina wound up passing just 25 times while running 38 times! That’s really run-heavy.

The full Game Scripts data below: [continue reading…]

{ 0 comments }

Note: The data in today’s post is current through week 10 but excluding the Monday Night game between Carolina and Miami.

The Jets, behind Josh McCown, rank 3rd in the NFL in completion percentage this season, with a nominally impressive 69.1% rate. However, as noted last month, that was pretty misleading — and it still is.

The Jets are one of just four teams that have picked up first downs on fewer than half of their completed passes, and the other three teams are a who’s who of ugly quarterback play this year (Ravens, Dolphins, and Giants). The Bears and Browns round out the bottom six, while the Texans (RIP Deshaun Watson) lead the NFL in this metric.

But if first downs per completed pass is akin to yards per completion — an interesting statistic but better used to describe style than competency — than first downs per pass play (including sacks) is the more useful metric (this is similar to Net Yards per Attempt). After all, on a dropback, if a quarterback throws for a first down, it’s a good pass play; if a first down is not picked up, it usually wasn’t a good pass play.

So first downs per pass play (again, including sacks) is a good measure of an offense’s success rate. And you probably won’t be too surprised to see that the Patriots and Saints lead the NFL in that metric this year. Apparently, Tom Brady and Drew Brees are pretty good at keeping their offenses on schedule. The Chiefs, Falcons, and Rams rank in the top 5 in this metric as well.

Let’s use the Patriots line to explain how to read the table below. New England has completed 234 of 346 passes, a 67.6% completion rate that ranks 4th in the NFL. The Patriots have taken 22 sacks but picked up 142 first downs. New England has picked up a 1st down on 60.7% of its completed passes, and 38.6% of its pass plays. That ranks 1st in the NFL, and is the metric by which the table below is sorted. [continue reading…]

{ 3 comments }

A week ago, Iowa beat Ohio State 55-24 and recorded the single-best SRS game score (87.5) of the 2017 season. And after the Buckeyes crushed Michigan State on Saturday, that win looks even better: it now measures a whopping 88.5 in the SRS. And yet, it is no longer the top game of the year, not after what Miami just did.

At home against the then-#1 team in the SRS, Notre Dame, the Hurricanes crushed the Irish 41-8. Because Notre Dame still has an impressive 62.2 SRS rating, the 33-point win — which gets knocked down to 27 due to home field and as part of the compression against blowouts — produced an SRS score of 89.2, the best game of the year. And the Buckeyes win over MSU? That was the third best performance of the season, scoring an SRS score of 81.7. And let’s not forget about what Auburn did to Georgia — the Tigers produced the 7th-best game of the year by SRS standards. The table below shows the single-game SRS scores from this week: [continue reading…]

{ 0 comments }

The Jets had an ugly 15-10 loss to the Bucs today, and quarterback Josh McCown was as responsible for it as anyone. Prior to some garbage yard throws, he had passed for just 157 net yards on 41 dropbacks with an interception, and the Jets first 11 drives (before a meaningless touchdown) ended with 7 punts, 2 turnovers, 1 FG attempt, and 1 turnover on downs.

But in the final seconds of the game, McCown managed to throw his 14th touchdown pass of the season. That set a new single-season career high for McCown, which is notable: that’s the oldest age any player set their single-season career high in passing touchdowns.

As I wrote earlier, McCown has turned into one of the great late bloomers in quarterback history. Of McCown’s 70 career starts, half of them have come with him at 34.4 years of age or older, giving him the fifth oldest median age of start in league history. But now he has another record all to his own.

Warren Moon set a career high with 33 touchdown passes at age 34 in 1990; 5 years later, Moon tied that mark at the age of 39. But he didn’t set a new career high at age 39, so the tie goes to McCown.

Similarly, Craig Morton originally set a career high in passing touchdowns in 1969 at the age of 26 with 21 scoring strikes; at age 38, in 1981, he again threw 21 touchdown passes.

Five player — Y.A. Tittle, Roger Staubach, John Elway, Steve Young, and Peyton Manning — set a new career high in touchdown passes at the age of 37. Those are the men McCown pushed aside it he record books today.

There are 301 quarterbacks in NFL history who threw for at least 10 touchdown passes in one season and are at least 35 years old in 2017. The graph below shows for each age, the number of QBs who set their career high at that age (and quarterbacks who tie that number later in their career get a 0.5 for each year; so age 26 and age 38 each get 0.5 for Morton). [continue reading…]

{ 1 comment }

The NFL Is Partying Like It’s 1978

For the majority of the NFL, the 2017 season feels pretty similar to the 1978 season.

In 1978, the Rams won 75% of their games and the Redskins went .500.
In 2017, the Rams have won 75% of their games and the Redskins are .500.

In 1978, the Colts had a superstar quarterback (Bert Jones) in the prime of his career, but he was hurt, and the team finished with the worst points differential in the NFL. In 2017, the Colts have a superstar quarterback in the prime of his career (Andrew Luck), but he is hurt, and the team has the worst points differential in the NFL.

The 1978 49ers had the worst record in the NFL. The 2017 49ers have the worst record in the NFL.

In 1978, the Packers won 8 games with a Hall of Fame QB on the sidelines in head coach Bart Starr; the 2017 Packers are 4-4 with a Hall of Fame QB on the sidelines in Aaron Rodgers.

The 1978 Giants finished in last place in the NFC East. The 2017 Giants are going to finish in last place in the NFC East.

The 1978 Jets went 8-8; with a win over the Bucs this Sunday, the 2017 Jets will be 5-5.

Speaking of Tampa Bay, the ’78 Bucs finished last in their division by two games; the ’17 Bucs are currently last in their division by two games.

But you know who was good in 1978? The Patriots, Steelers, Cowboys, and Eagles.

In 1978, New England started 6-2 and won the AFC East. In 2017, New England is 6-2 and in first place in the AFC East.

In 1978, Pittsburgh had a top-5 defense and a Hall of Fame quarterback in Terry Bradshaw; in 2017, Pottsburgh has a top-5 defense and a Hall of Fame quarterback in Ben Roethlisberger.

In 1978, Philadelphia made the playoffs with Ron Jaworski in his second season as quarterback of the Eagles; in 2017, Philadelphia will make the playoffs with Carson Wentz in his second season as quarterback of the Eagles.

In 1978, Dallas made the playoffs with Pro Bowlers at QB, RB, WR, and TE in Roger Staubach, Tony Dorsett, Tony Hill, and Billy Joe DuPree; in 2017, Dallas is 5-3 and on the road to the postseason thanks to star QB Dak Prescott, star RB Ezekiel Elliott, star WR Dez Bryant, and star TE Jason Witten.

In 1978, the Vikings won their division; in 2017, the Vikings are in first place in their division.

In 1978, the Bengals and their 29-year-old franchise quarterback Ken Anderson had a down year; Anderson went 4-8 as the starter. In 2017, the Bengals and their 30-year-old franchise quarterback Andy Dalton is having a down year; Dalton is 3-5 as a starter.

In 1978, the Bears had a losing record and yet still ranked last in pass attempts; in 2017, the Bears have a losing record and yet still rank last in pass attempts.

In 1978, the Falcons were a year removed from greatness on one side of the ball, and sputtered around .500; in 2017, the Falcons are a year removed from greatness on one side of the ball, and are sputtering around .500.

In 1978, the Lions finished 7-9 with an average offense and an average defense; in 2017, the Lions are 4-4 with an average offense and an average defense.

In 1978, the Cardinals had a losing record and an ugly offense; in 2017, the Cardinals have a losing record and an ugly offense.

In 1978, the Raiders disappointed; after an 11-3 season with a great quarterback in Ken Stabler, the team missed the playoffs. In 2017, the Raiders are disappointing; after a 12-3 season with Derek Carr in 2016, the Raiders are on track to miss the postseason.

In 1978, the Chargers had a Hall of Fame quarterback in Dan Fouts, but a 1-4 start and a tough division kept them out of the playoffs. In 2017, the Chargers have a Hall of Fame caliber quarterback in Philip Rivers, but a 1-4 start and a tough division might is likely to leave them out of the playoffs.

The 2017 Browns have lost 8 games, just like the 1978 Browns.

Not all teams are playing like it’s 1978, of course. The Ravens, Jaguars, Panthers, and Texans didn’t exist. The Saints were 7-9 that year, while this year’s Saints are 6-2 and look to be one of the better and more balanced (!) teams in the league. The Broncos were 10-6 with a great defense and a pretty good offense; this year’s Broncos are 3-5 with a terrible offense and a pretty good (and sometimes great) defense. This year’s Seahawks team is 6-3 and has a good chance of making the playoffs thanks to a good offense and a good defense; the ’78 Seahawks had a very good offense but a terrible defense, finishing 9-7 and out of the playoffs. Kansas City was one of the worst teams in the NFL in 1978, but one of the best in 2017. And the Bills were bad in ’78 but good in ’17, while the Dolphins are the reverse.

{ 8 comments }

Today at Slate:

While we’ve known for a long time that going for it on fourth-and-short is the wise move, NFL coaches have typically eschewed this aggressive approach. Are coaches getting any smarter? I took a shot at answering that question in August, analyzing fourth-and-1 decisions that fell within the following three constraints:

  • The decision must have come in the first three quarters before end-of-game factors encourage or discourage aggressive play.
  • The offense had to be between its own 40-yard line and its opponent’s 40-yard line, so kicking a field goal wasn’t an option, but the team wasn’t so close to its own end zone as to make fourth down conservativism a defensible move.
  • The game needed to be competitive, defined as within 10 points, to ensure the scoreboard wasn’t the primary factor dictating those decisions.

From 1994–2004, teams went for it on these fourth-and-1 situations 28 percent of the time. From 2005–2014, that number ratcheted up, with teams going for it 35 percent of the time. And in 2015 and 2016, offenses stayed on the field for these fourth downs more than 40 percent.

That trend is still holding halfway through the 2017 season.

You can read the full article here.

{ 2 comments }

Carolina is #1… in percentage of rushing yards not by running backs

The Carolina Panthers have rushed for 982 yards this year, an average of 109.1 per game.  That ranks 15th in the NFL, and just a hair above the league average rate of 108.1 rushing yards/game.  But the Panthers don’t have anything resembling a traditional ground game: of those 982 yards, starting running back Jonathan Stewart has just 350 of them, while quarterback Cam Newton has 341 rushing yards, the most of any quarterback in the NFL in 2017.

In addition, wide receivers Curtis Samuel, Damiere Byrd, and Russell Shepard have combined for 87 yards; that’s the third-most rushing yards in the league for any team behind the Rams (Tavon Austin) and Raiders (Cordarrelle Patterson) among non-QB/non-RBs. In fact, Panthers running backs are averaging just 61.6 rushing yards per game, the fewest in the NFL.

This is hardly shocking, of course: Newton has been an incredible rushing threat since he arrived in the NFL in 2011. But it’s still interesting to see the numbers and understand that the Panthers are an above average team in total rushing, but dead last in rushing by running backs. The table below shows each team’s rushing yards in 2017 through nine weeks, both by running backs only and overall. Here’s how to read the table below. The Jacksonville Jaguars rank 1st in running back rushing yards, with 145.1 per game. The Jaguars also rank 1st in total rushing yards per game, at 166.5. For Jacksonville, 87.2% of their rushing yards have come from running backs. The Panthers rank last in both running back rushing yards per game and percentage of rushing yards by their running backs. [continue reading…]

{ 7 comments }

Guest Post: The Patriots’ League-Best Kickoffs

Today’s guest post comes from Miles Wray, a long-time reader of the site. He’s written an interesting post on special teams today, but you may know him as the host of the daily NBA podcast The 82 Review. You can also find him on Twitter @mileswray. What follows are Miles’ words: as always, we thank our guest writers for their contributions.


Bill Belichick Found Another Way to Bleed Yards From Opponents

Gostkowski, probably not kicking a touchback

Anytime the New England Patriots are at the top — or the bottom — of a league-wide leaderboard, no matter how insignificant that leaderboard is, it’s worth taking notice. The odds are that Bill Belichick and Ernie Adams are thinking a few steps ahead of every other team in the league, and are leveraging yet another corner of the game to their advantage.

Since the Patriots offense remains incredibly explosive, it’s pretty reasonable that they would be near the top of the league in the total number of kickoffs returned (i.e., opponent kickoff returns). New England has 47 kickoffs this year, or nearly double the number of a struggling offense like the Cleveland Browns (26). But how about this: the Patriots are dramatically ahead of everybody else in the league in the percentage of their kickoffs that are returned.

Since kickoffs were moved from the 30- to the 35-yard-line in 2011, it’s more common than ever to see a kickoff boomed out the back of the endzone. These plays have become so routine it’s basically part of the commercial break now. But not for the Patriots. The Patriots seem to be inviting their opponent to return their kicks.

I went through the kickoff statistics for each team in the league, and discarded any onside kicks, any short kicks in the last 10 seconds of the first half (which are often intentionally squibbed), and any kicks where the just-scored/kicking-off team had been penalized, moving the kickoff to the 30-, 25-, or 20-yard line. The remaining “clean” kickoffs give the best indication of a team’s intentional special teams strategy over time.

This season, most teams have about a third of their kickoffs returned. Only three teams have had over half of their kickoffs returned; the Patriots are alone at over 60%: [continue reading…]

{ 16 comments }

Kirk Cousins is Spreading It Around

In the summer, I wrote an article describing the increased emphasis on spreading the ball around in team passing games. Through nine weeks of the 2017 season, which teams have the most and least concentrated passing games?

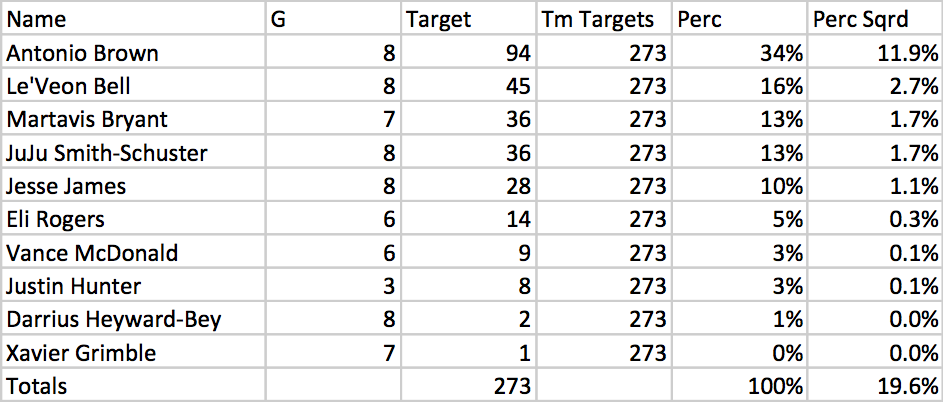
One way to measures this is to calculate the percentage of team targets had by every player on each team, square that result, and sum those squared results to get a team grade. Let’s use the Steelers as an example. Pittsburgh has 273 team targets this year, and star receiver Antonio Brown has seen 94, or 34%, of those targets. The square of 34% is 11.9%; perform those calculations for every Steelers who has a target this year, and the sum of those squares is 19.6%.

[continue reading…]

{ 1 comment }

Jared Goff was the worst quarterback in the NFL last season, and had one of the worst rookie quarterback seasons in modern history. This year, Goff is averaging 8.04 ANY/A, the 2nd-best in the NFL, and is on pace to set the NFL record for the largest year-over-year increase in Adjusted Net Yards per Attempt.

Dak Prescott had one of the best rookie quarterback seasons of all time in 2016, taking Dallas from the basement to the division crown. Prescott averaged 7.86 ANY/A last year, and isn’t far behind this year: he’s at 7.13 ANY/A, 7th-best in the NFL.

Carson Wentz had a very up-and-down rookie season, ultimately finishing with poor numbers and showing a lack of big play ability. This year, he’s having an MVP-caliber season: he ranks 5th in ANY/A at 7.55, and leads the NFL with 23 touchdowns as his Eagles have a 8-1 record. [continue reading…]

{ 7 comments }

Let’s start today’s post in a different direction: with a look at the biggest surprises of the week. And there was no bigger surprise than Iowa’s blowout win over Ohio State.

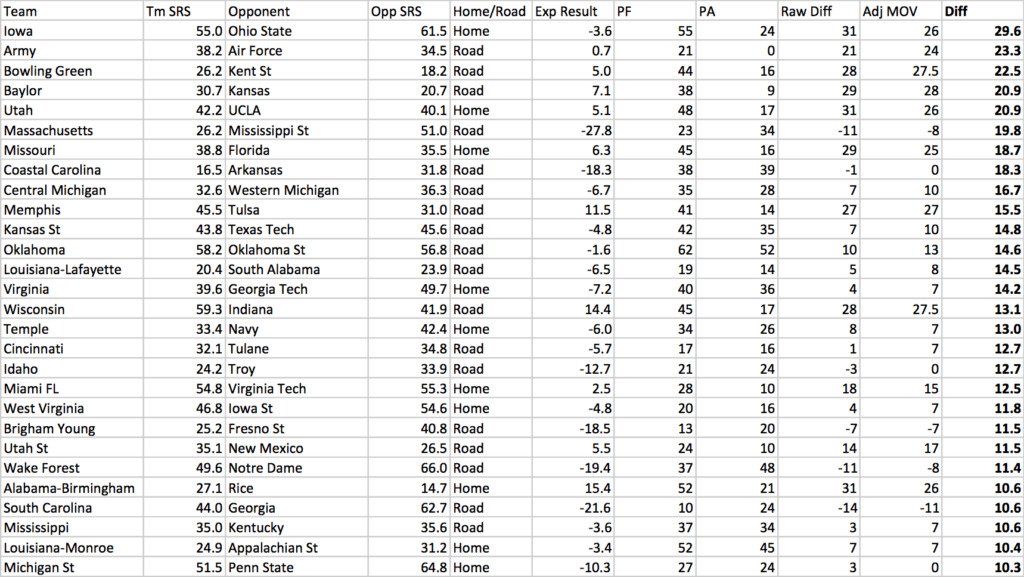
After week 10 (which, of course, compresses the ratings since the year-long ratings include the week 10 results), Iowa has an SRS of 55.0, while Ohio State is at 61.6. Given that the game was in Iowa, we would have expected Iowa to lose by 3.6 points.  But Iowa won 55-24, for a difference of 31 points, and an adjusted MOV of 26 points.  That means Iowa exceeded SRS expectations by 29.6 points, the most of any FBS team this week.

Army, Bowling Green, Baylor, and Utah round out the top 5 in terms of biggest overachievers in week 10:

[continue reading…]

{ 1 comment }

Largest Decreases in Team Scoring

Yesterday, I looked at the largest increases in team scoring from one year to the next. Today, the opposite: which teams have seen the largest decreases in scoring?

In the post-merger era, that “honor” would belong to the 1974 Falcons. In 1973, the Falcons averaged 22.7 points per game, 7th-best in the NFL. The team was led by fullback Dave Hampton and quarterback Bob Lee, and while both returned the next season, the results were disastrous. Atlanta averaged just 7.9 points per game, the lowest in the NFL. Along with the 1977 (not ’76) Bucs, the ’74 Falcons are one of just two teams since 1950 to average fewer than 8 points per game.

In more modern times, the 2015 Cowboys (after losing Tony Romo), 2011 Colts (after losing Peyton Manning), and 2010 Vikings (in year two under Brett Favre) are the biggest decliners. The top 100 biggest declines below: [continue reading…]

{ 2 comments }

Largest Increases in Team Scoring

Last year, the Los Angeles Rams scored 224 points, or just 14.0 points per game. That ranked last in the NFL, 40 points behind the 31st-ranked Cleveland Browns. But as noted earlier this week, the 2017 Rams have scored 212 through seven games, a 30.3 points per game average that ranks 2nd in the NFL.

If that holds, the Rams increase of 16.3 points per game would rank as the third largest ever, and the biggest increase since 1950. [Update: Los Angeles ended the season averaging 29.9 points per game; that 15.9 PPG increase remains the third largest in NFL history, and displaces the 1999 Rams for the biggest year-over-year increase since 1950.] The table below shows the 100 biggest per-game increases in scoring in pro football history: [continue reading…]

{ 3 comments }

Let’s get to the week 8 Game scripts! The Raiders and Redskins stood out as pass-happy this week, as Derek Carr and Kirk Cousins kept passing in losing efforts. They were the two most pass-happy teams without accounting for Game Scripts in week 8, at 78% (Oakland) and 74% (Washington), respectively. But even after accounting for Game Script, both team’s pass-heavy nature stands out.

The Washington-Dallas game was competitive most of the way, but Cousins had 43 dropbacks while the team had just 15 rushing attempts.  Meanwhile, the Raiders called 49 pass plays against just 15 rushing plays, although that may have been due to Marshawn Lynch being suspended and both backup running backs underwhelming. This was just the second time in the last five years the Raiders passed on 77% of more of their plays. 

The full Game Scripts data from week 8, below: [continue reading…]

{ 5 comments }

The JaMarcus Russell Raiders weren’t very good, and that includes the 2009 season, Russell’s last with the team. That year, Oakland scored 197 points in 16 games, one of just five teams from ’02 to ’16 to finish a season with fewer than 200 points.

In 2010, Jason Campbell and Bruce Gradkowski took over, and Darren McFadden returned from injury to have the biggest year of his career. The 2010 Raiders scored 410 points and finished 6th in scoring, but here’s the money stat. Through 8 games, Oakland had scored 212 points, exceeding their 2009 points total in half a season!

Is that unusual, you ask? Well, yes it is.  In fact, the 2010 Raiders are the only team to outscore the franchise’s team the prior season (in the 16-game season era) after just 8 games.  But the Raiders are about to have some company.

In 2016, the Jared Goff and Case Keenum Rams scored just 224 points, fewest in the NFL.  This year, through 7 games, the Goff-led Rams have already scored 212 points, which was the most in the NFL prior to the team’s week 8 bye! That’s a rags-to-riches story of remarkable proportions.  But for today’s purposes, note that Los Angeles is just 13 points away from exceeding last year’s total. The Ramsface the Giants this weekend.  Assuming L.A. can score a couple of touchdowns, they will join the Raiders as the only teams to exceed last year’s points total in just 8 games (again, during the 16-game season era).

In fact, only seven other teams in the 16-game era have outscored their slightly older brothers after 9 team games. Those are the 2013 Chiefs, 2007 Browns, 2006 Bears, 2001 Browns, 1999 Rams, 1994 Colts, and 1993 Seahawks.

{ 7 comments }