≡ Menu

2017 Contest: 38 Questions in Review, Part I

Back in August, I asked you 38 questions that served as prop bets for the 2017 NFL season. Thanks to the tireless work of Jeremy De Shelter, who helped compile all the results, I am going to present the results over the rest of this week.

On average, the favorite for each question picked up 65% of the votes, which is in the ballpark of a good question (I think you want the split to be pretty close to 50/50, but with some exceptions to encourage risk-seeking behavior). Today: the first 13 questions.

Let’s begin.

Number of wins by the Saints
Number of wins by the Broncos

63% of you picked New Orleans to win this one. Football Perspective readers are pretty smart! The two teams each had 8 wins as the line set by Vegas, and the teams did in fact combine for 16 wins. But Denver went 5-11, while the Saints surprisingly went 11-5. Score this one for the majority.

Number of wins by the Ravens
Number of wins by the Lions

Baltimore received only 43% of the vote, despite having an over/under of 8.5 wins from Vegas compared to 7.5 for Detroit. So Football Perspective readers were pretty down on Baltimore or pretty high on the Lions. That insight turned out to be — well, correct, but not necessarily helpful. Both teams finished 9-7, in part because of a 44-20 victory in Baltimore by the Ravens over the Lions. The Ravens famously lost in the final minute of the regular season, but no matter: by contest rules, ties go to the team receiving fewer votes, so the 43% who backed Baltimore had this one clinched after week 16. [continue reading…]

{ 7 comments }

Rushing Yards over 50: 2017 Editon

A few years ago, I looked at the career leaders in rushing yards over 50 yards in a game. I like doing this because it helps remove less material games and places more of an emphasis on dominance. A player with 16 games of 70 rushing yards has 1,120 rushing yards but only 320 rushing yards over 50 yards per game. On the other hand, a player with 8 games of 25 rushing yards and 8 games of 95 rushing yards maybe was a backup for half the season; he would have only 960 rushing yards but 360 rushing yards over 50 yards per game.

One player who excels in this metric is Ezekiel Elliott, who obviously missed six games due to suspension and therefore ranked only 10th in rushing yards. But Elliott hit 80 or more yards in 9 of 10 games — in fact, he’s rushed for at least 80 yards in a remarkable 23 of 25 career games (and also did it in his sole playoff game) — which means he fares very well in this formulation. In fact, he ranks 4th by this metric, and was the only rusher in 2016 to have over half of his rushing yards come after already rushing for 50 yards in a game.

On the other side of things, you have players like Lamar Miller and Frank Gore. Miller ranked 16th in rushing yards with a respectable 888-yard season, but his season high was just 75 yards. He was a consistent player — in 11 of 16 games he rushed for between 50 and 65 yards — but in no way was he a dominant one. Gore had 961 rushing yards, good enough for 12th place, but he ranked only 23rd in rushing yards over 50. Gore had two big games in December to boost his numbers: but in the first 12 games of the season, Gore finished with between 34 and 62 rushing yards in 11 games. A very consistent runner, yes, but a dominant runner? No.

The full results below: [continue reading…]

{ 1 comment }

Analyzing Third Down Passes From 1997 to 2017

How has the NFL evolved when it comes to third down passing? Using the PFR Play Index, I looked at all passes on third downs in each season from 1997 to 2017 that met the following criteria:

  • The play came during the regular season.
  • The pass happened in the first three quarters of the game to minimize the effects of game situation, as 4th quarter passes may be different than passes earlier in the game (although that’s worth investigating, too!).
  • The team on offense was down by no more than 14 points or up by no more than 14 points, to again minimize the effects of game situation.
  • The distance was between 5 and 10 yards to go, to isolate obvious passing situations but not hopeless ones.

What were the results? What do you *think* the results would be? [continue reading…]

{ 12 comments }

The Cleveland Browns own the #1 and #4 selections in the 2017 Draft. Assuming the Browns don’t trade down, it means the franchise would be the first team to own two top-5 picks in the Draft since…. well, do you know?

Trivia hint 1 Show


Trivia hint 2 Show


Trivia hint 3 Show
[continue reading…]

{ 0 comments }

2017 Fantasy Rankings: Team Defense

This week at Football Perspective: an analysis of the 2017 fantasy results. For team defenses, I used the following formula:

  • Fumble recoveries and interceptions are each worth +3.
  • Sacks are worth +1.
  • Safeties are worth +5.
  • Defensive/Special Teams TDs are worth +6.

For points allowed and yards allowed, I used the following:

Points Allowed 0-0 15
Points Allowed 1-7 10
Points Allowed 8-14 5
Points Allowed 15-21 1
Points Allowed 31-99 -5

Yards Allowed 0-199 15
Yards Allowed 200-299 7
Yards Allowed 300-499 0
Yards Allowed 500-999 -5

Below are the fantasy rankings for team defenses in 2017. Note that these results exclude week 17, so the per-game numbers are over 15 games. [continue reading…]

{ 0 comments }

2017 Fantasy Rankings: Tight Ends

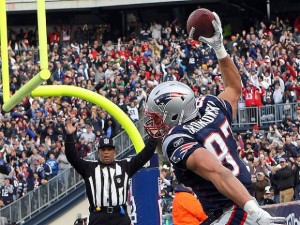
Gronk was the top TE of 2017.

This week at Football Perspective: an analysis of the 2017 fantasy results. I will be using the same methodology throughout this series.

  • To calculate fantasy points, I will be using the following system: 1 point per 20 yards passing, 5 points per passing TD, -2 points per INT, 1 point per 10 yards rushing/receiving, 6 points per rushing/receiving touchdown, and 0.5 points per reception.
  • To measure fantasy production, I will be using VBD, which stands for Value Based Drafting. For players who play a full 16-game schedule, the formula is easy: you begin with each player’s fantasy points, and then subtract from that number the baseline at that position. For QBs and TEs, the baseline is the player with the 12th most fantasy points at the position. For RBs, it’s RB24, and for WRs, the baseline is WR30. For players who missed time, I give them some credit for those missed games under the assumption that a fantasy player would put another player into their lineup if that player was out. So for every game a QB/TE misses, he gets the FP/G of QB18 or TE18, as applicable; for RBs, I used RB30 as replacement, and for WRs, I used WR36. If a player missed more than 10 games, he was excluded entirely, but if he played in at least 6 games, he was included.
  • For players who finish below the baseline (i.e., would have negative VBD), I’m ranking them based on fantasy points per game. I’m not too concerned by this, and if you have another preference, that’s perfectly fine. I thought it would simply be the easiest way to present the data.

Below are the fantasy rankings for tight ends in 2017. [continue reading…]

{ 1 comment }

2017 Fantasy Rankings: Wide Receivers

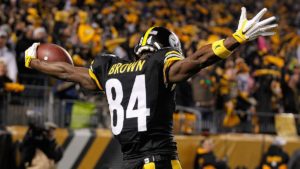
Brown was the top wide receiver of 2017.

This week at Football Perspective: an analysis of the 2017 fantasy results. I will be using the same methodology throughout this series.

  • To calculate fantasy points, I will be using the following system: 1 point per 20 yards passing, 5 points per passing TD, -2 points per INT, 1 point per 10 yards rushing/receiving, 6 points per rushing/receiving touchdown, and 0.5 points per reception.
  • To measure fantasy production, I will be using VBD, which stands for Value Based Drafting. For players who play a full 16-game schedule, the formula is easy: you begin with each player’s fantasy points, and then subtract from that number the baseline at that position. For QBs and TEs, the baseline is the player with the 12th most fantasy points at the position. For RBs, it’s RB24, and for WRs, the baseline is WR30. For players who missed time, I give them some credit for those missed games under the assumption that a fantasy player would put another player into their lineup if that player was out. So for every game a QB/TE misses, he gets the FP/G of QB18 or TE18, as applicable; for RBs, I used RB30 as replacement, and for WRs, I used WR36. If a player missed more than 10 games, he was excluded entirely, but if he played in at least 6 games, he was included.
  • For players who finish below the baseline (i.e., would have negative VBD), I’m ranking them based on fantasy points per game. I’m not too concerned by this, and if you have another preference, that’s perfectly fine. I thought it would simply be the easiest way to present the data.

Below are the fantasy rankings for wide receivers in 2017. [continue reading…]

{ 0 comments }

2017 Fantasy Rankings: Running Backs

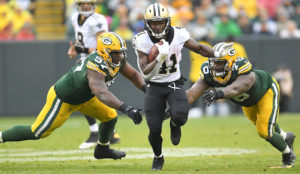
Kamara was the surprise star at running back in 2017.

This week at Football Perspective: an analysis of the 2017 fantasy results. I will be using the same methodology throughout this series.

  • To calculate fantasy points, I will be using the following system: 1 point per 20 yards passing, 5 points per passing TD, -2 points per INT, 1 point per 10 yards rushing/receiving, 6 points per rushing/receiving touchdown, and 0.5 points per reception.
  • To measure fantasy production, I will be using VBD, which stands for Value Based Drafting. For players who play a full 16-game schedule, the formula is easy: you begin with each player’s fantasy points, and then subtract from that number the baseline at that position. For QBs and TEs, the baseline is the player with the 12th most fantasy points at the position. For RBs, it’s RB24, and for WRs, the baseline is WR30. For players who missed time, I give them some credit for those missed games under the assumption that a fantasy player would put another player into their lineup if that player was out. So for every game a QB/TE misses, he gets the FP/G of QB18 or TE18, as applicable; for RBs, I used RB30 as replacement, and for WRs, I used WR36. If a player missed more than 10 games, he was excluded entirely, but if he played in at least 6 games, he was included.
  • For players who finish below the baseline (i.e., would have negative VBD), I’m ranking them based on fantasy points per game. I’m not too concerned by this, and if you have another preference, that’s perfectly fine. I thought it would simply be the easiest way to present the data.

Below are the fantasy rankings for running backs in 2017. [continue reading…]

{ 4 comments }

2017 Fantasy Rankings: Quarterbacks

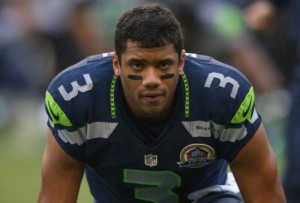
Wilson was #1 in 2017.

This week at Football Perspective: an analysis of the 2017 fantasy results. I will be using the same methodology throughout this series.

  • To calculate fantasy points, I will be using the following system: 1 point per 20 yards passing, 5 points per passing TD, -2 points per INT, 1 point per 10 yards rushing/receiving, 6 points per rushing/receiving touchdown, and 0.5 points per reception.
  • To measure fantasy production, I will be using VBD, which stands for Value Based Drafting. For players who play a full 16-game schedule, the formula is easy: you begin with each player’s fantasy points, and then subtract from that number the baseline at that position. For QBs and TEs, the baseline is the player with the 12th most fantasy points at the position. For RBs, it’s RB24, and for WRs, the baseline is WR30. For players who missed time, I give them some credit for those missed games under the assumption that a fantasy player would put another player into their lineup if that player was out. So for every game a QB/TE misses, he gets the FP/G of QB18 or TE18, as applicable; for RBs, I used RB30 as replacement, and for WRs, I used WR36. If a player missed more than 10 games, he was excluded entirely, but if he played in at least 6 games, he was included.
  • For players who finish below the baseline (i.e., would have negative VBD), I’m ranking them based on fantasy points per game. I’m not too concerned by this, and if you have another preference, that’s perfectly fine. I thought it would simply be the easiest way to present the data.

Below are the fantasy rankings for quarterbacks in 2017. [continue reading…]

{ 3 comments }

Today’s guest post comes from Miles Wray, a long-time reader of the site. He’s written an interesting post on special teams today, but you may know him as the host of the daily NBA podcast The 82 Review. You can also find him on Twitter @mileswray. What follows are Miles’ words: as always, we thank our guest writers for their contributions.


As Chase noted in December, the Seahawks’ Russell Wilson had an opportunity to be just the fifth quarterback to lead his NFL team in rushing yards — an accomplishment that even Michael Vick can’t claim. In the final weeks of the season, Wilson absolutely coasted home with this dubious title belt: he racked up 586 rushing yards, the second-highest total in his career.

That historically rare achievement may mask the historically unprecedented scenario in Seattle’s running backs room. Since the NFL schedule expanded to 16 games in 1978, there had only been six previous times when, at the end of the regular season, a team’s leading running back or fullback finished with less than 350 total yards. [1]Excluding strike-shortened seasons. But in all six of those other cases, that leading rusher still managed to top 300 yards on the season. Well, nobody in Seattle got past 250 this year:

[continue reading…]

References

References
1 Excluding strike-shortened seasons.
{ 5 comments }

13 Points > 14 Points, Part IV

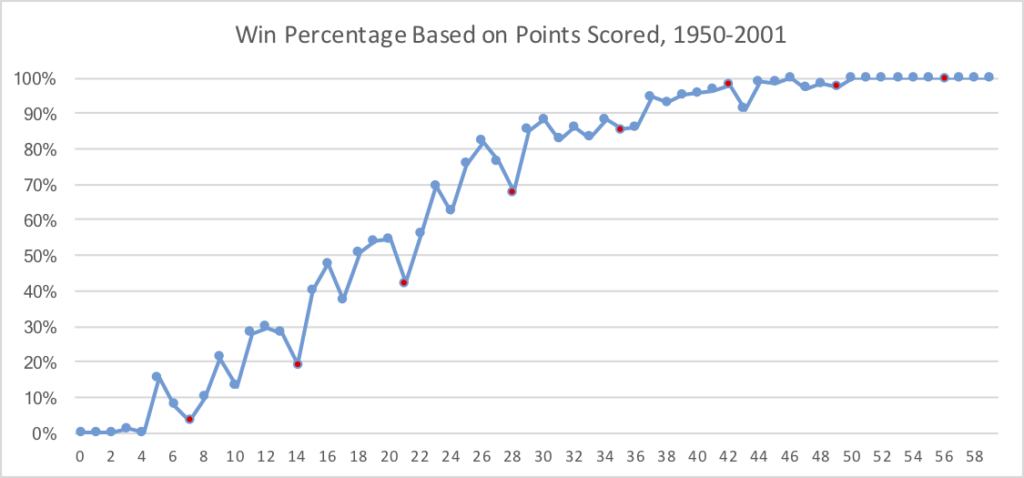
Over the last three days, I have been writing about the fact that points scored isn’t linearly correlated with winning percentage.  In fact, there are a few bumps, and it relates to field goals vs. touchdowns.  As we’ve learned:

  • Not only is scoring 13 points better than scoring 14 points, but scoring 9 points is better than 14 points.
  • This works for increments on 7, too: 16 is better than 21, 23 is better than 28, and 30 is better than 35, too.

What I thought was the next natural question: do yards and yards allowed follow a similar pattern?

The graph below shows, in blue, the average number of yards gained for teams based on their points scored (on the X-Axis).  In addition, in orange, I’ve shown the average number of yards allowed.  As before, I put a red dot (on the blue line) for 7, 14, 21, 28, 35, 42, 48, and 56 points.  And wouldn’t you know: there is, in fact, a small dip in yards gained at these levels: teams that score 13 points gain more yards than teams that score 14 points, and that holds true at 20/21, 27/28, 34/35, and 41/42. [continue reading…]

{ 2 comments }

13 Points > 14 Points, Part III

Over the last two days, I’ve looked at the football oddity that teams that score 13 points had a better winning percentage than teams that scored 14 points.  Today, let’s look at the winning percentage for all points scored.

That’s what the graph below shows: the winning percentage, based on points scored, for all points scored totals from zero to sixty.  To make it a little easier to follow, I’ve colored in red the multiples of 7; as you can see, those numbers (7, 14, 21, and 28) also represent dips in the graph.  What’s interesting is that three field goals is better than two touchdowns across a number of multiples. For example, scoring 9 points is better than scoring 14 points, scoring 16 points is better than 21 points, scoring 23 points is even better than scoring 28 points, and scoring 30 points is better than 35 points.  Take a look:

[continue reading…]

{ 8 comments }

13 Points > 14 Points, Part II

Yesterday, I wrote about the peculiar bit of trivia that teams scoring exactly 13 points win more frequently than teams scoring exactly 14 points. There were some great comments in those posts, and today, I want to get a little more granular with the data.

From 1999 to 2016, there were 462 games where a team scored exactly 13 points by two field goals and one touchdown, and 382 games where a team scored exactly 14 points by two touchdowns and two extra points. Note: the data set in today’s post is limited to 13-point games with 2 FG + 1 TD and 14-point games with 2 TDs (and 2 XPs); all other avenues to 13 or 14 points were discarded. In the 13-point games, teams won 26.2% of the time and allowed 19.7 points; in the 14 point games, teams won 14.1% of the time and allowed 24.8 points.

So the 13-point scoring teams allowed 5 fewer points per game than the 14-point scoring teams, which of course explains why they have a better record.  What about when those scores occurred? On average, the 13-point scoring teams produced their three scores at 15.6 minutes, 31.7 minutes, and 47.4 minutes of game play — in other words, early 2nd quarter, early 3rd quarter, and early 4th quarter. Meanwhile, the 14-point scoring teams scored at the 22-minute mark and the 43-minute mark, or midway through the 2nd quarter and at the end of the 3rd quarter.

Does that mean anything? I’m not so sure.  So instead, let’s break things into 5-minute buckets.  How early into the game did these teams first score?

The 13-point teams produced their first score in the first quarter in 53% of games; conversely, the 14-point teams only scored in the 1st quarter in 36% of games.  In 83% of games, the 13-point scoring teams had scored by the 25-minute mark, compared to just 60% of 14-point scoring teams.  Of course, the 13-point scoring teams are often scoring field goals, while the 14-point scoring teams are only scoring touchdowns.

What about their second scores?  For 13-point scoring teams, a whopping one-third of teams scored for the second time in the final 5 minutes of the first half.   For the 14-point scoring teams, 41% of those teams were at 7 points until the final 10 minutes of the game, with 25% stuck at 7 until the final 5 minutes.

Teams that scored 14 points but had their second touchdown come in the final 10 minutes went 20-136, for a 12.8% winning percentage. That dropped to 10.5% — a 10-85 record — when the second score came in the final 5 minutes.

Finally, what about the field goal kicking teams? When did their third score occur?

There were also 9 games where the 13-point scoring team scored in overtime, which were all wins.  But teams also won 35.8% of games where the third field goal came in the final five minutes of regulation, for a 49-88 record.

There’s some evidence that time of possession plays a factor in the 13 vs. 14 phenomenon, and it’s possible (although I am not particularly persuaded) that scoring on three drives may have some marginal benefit above scoring on two drives. But for the most part, I think this phenomenon is the result of survivorship bias.  Teams that score a field goal late are often going to win games, even (especially!) if they don’t score a lot of points overall.

{ 4 comments }

Back in November 2006 (I have been writing on the internet for too long!), I wrote that teams that scored 13 points had a better winning percentage than teams that had scored 14 points. That post was in response to an insightful eye from regular commenter Bill M., who first noticed the discrepancy. A few days later, Doug expounded on the topic, and came up with a couple of possible explanations.

As it turns out, this phenomenon still hold. From 1970 to 2017 (postseason included), teams that scored exactly 13 points in a game have a 308-871-10 record, for a winning percentage of .263. Over that same period, teams that scored 14 points went just 221-991-4, which translates to a .183 winning percentage.

Are you wondering if this is a relic of an older era? Well, over the last 10 seasons, teams that scored exactly 13 points went 44-206-2 (.179), while teams that scored 14 points went 26-181-0 (.126). In addition, since 2008, teams that scored 20 points (13 + a touchdown) have a 147-221 record (.399), which is a lot better than teams that scored exactly 21 points (14 + a touchdown), who have an ugly 50-117 mark (.299). The same rule holds even more strongly for 27 points (228-80-2, for a .739 winning percentage) vs. 28 points (88-58, or .603).

So, what gives? Let’s stick to the 13 and 14 point situations and begin with an experiment. There have been 138 games from 1970 to 2017 that ended in a score of 13-10. Knowing that, how many games do you think had a final score of 14-10?

I’ll give you the answer in moment, but let’s start with the obvious note: despite the small number of games that end in a 14-13 score, we know that teams that score exactly 13 points win more games than teams that score exactly 14 points. This means, of course, that teams that score 13 points must hold opponents to under 13 points at a higher rate than teams that score 14 points hold opponents to under 14 points, because #math. It’s true that, on average, teams that score 13 points allow fewer points – for whatever reason – than teams that score 14 points. Does that help inform your guess?

As it turns out, just 52 games have ended in a 14-10 final score. Such a result is so rare that in the last 5 years, it’s happened just once: in a Dolphins/Rams game that was 10-0 with 5 minutes left and 10-7 with one minute remaining. So while it’s a tautology, what’s driving this weird result is that teams score 13 points allow fewer points than teams that score 14 points.

Is there something special about 13 points relative to 14 points that’s driving that result? If so, presumably it’s related to 13 points being most often resulting from a touchdown and two field goals, while 14 points typically coming from two touchdowns. Therefore, I looked at all games where teams scored exactly 13 or 14 points by only one way for each score: two field goals, one touchdown, and an extra point, or two touchdowns with two extra points.

In those cases, from 1970-2016 (I don’t have 2017 data incorporated yet), teams that have kicked two field goals and scored one touchdown (with one extra point) are 291-722-10 in 1,023 games, for a 0.289 winning percentage. Meanwhile, teams that scored two touchdowns and two extra points and nothing else went 213-942-4 in 1,159 games, for a 0.186 winning percentage.

The graph below shows the points allowed by teams in these situations on a percentage basis. For example, when teams score 13 points by one touchdown and two field goals, they have allowed just 10 points about 13% of the time; conversely, teams that score 14 points from 7+7 allow only 10 points about 4% of the time.

Teams that score 13 points are much more likely to allow just 3, 7, or 10 points.

So what’s going on here? Part of it, I think, is that teams down 31-7, they aren’t going to kick a field goal late in the game, but if the score is 10-10, they will attempt a field goal.

What do you think? What other studies would you want to run?

{ 27 comments }

A pair of Valentine’s Day babies

There have been 45 quarterbacks in NFL history to throw for at least 30,000 yards. I write about this nearly every year, as not much changes. Three of them — Drew Bledsoe (born February 14, 1972), Jim Kelly (2/14/1960), and Steve McNair (2/14/1973) — were all born on February 14th.

If we drop the cut-off to 16,000 yards, we jump to 139 quarterbacks but get to include David Garrard, another Valentine’s Day baby (1978). But wait, there’s more: If we drop the threshold to 3,500 passing yards, we get to include Patrick Ramsey and Anthony Wright. Those guys may not impress you, but consider that only 337 players have thrown for 3,500 yards. That means dozens of days have zero quarterbacks with 3,500 yards — including New Year’s Day, another February holiday (Groundhog Day), Cinco De Mayo, Halloween, and Christmas Eve — so slotting in Ramsey and Wright as QB5 and QB6 on your birthday dream team is pretty damn good. [continue reading…]

{ 5 comments }

Yesterday, I looked at coordinators who immediately left Super Bowl champions to become head coaches. Today, I expand on that study by looking at the 50 offensive/defensive coordinators on the 25 Super Bowl champions from 1992 to 2016 and tracking the remainder of their tenures.  Let’s leave Josh McDaniels (2014/2016 Patriots offensive coordinator) out of the mix, since it appears as though he’s doing to be in New England for the foreseeable future.  What about the other 48? When did they finally leave?

Left Immediately (7)

Charlie Weis (2004 NWE OC)
Romeo Crennel (2004 NWE DC)
Mike Martz (1999 STL OC)
Mike Shanahan (1994 SFO OC)
Ray Rhodes (1994 SFO DC)
Norv Turner (1993 DAL OC)
Dave Wannstedt (1992 DAL DC)

In this group, 5 left to become head coaches of other NFL teams, Martz was promoted to Rams HC, and Weis left to become the Notre Dame head coach.

Left After One Additional Year (14)

Matt Patricia (2016 NWE DC)
Rick Dennison (2015 DEN OC)
Wade Phillips (2015 DEN DC)
Dan Quinn (2013 SEA DC)
Jim Caldwell (2012 BAL OC)
Joe Philbin (2010 GNB OC)
Steve Spagnuolo (2007 NYG DC)
Ken Whisenhunt (2005 PIT OC)
Charlie Weis (2003 NWE OC)
Romeo Crennel (2003 NWE DC)
Marvin Lewis (2000 BAL DC)
Peter Giunta (1999 STL DC)
Butch Davis (1993 DAL DC)
Norv Turner (1992 DAL OC)

Eight of these coordinators left to become head coaches after one more season as a coordinator (Patricia, Quinn, Caldwell, Philbin, Spagnuolo, Whisenhunt, Crennel, and Turner). What about the other 6?

  • Dennison and Phillips were both let go as part of the coaching change from Gary Kubiak (retired) to Vance Joseph a year after winning the Super Bowl. Both resurfaced on playoff teams in 2017 (Bills and Rams).
  • Weis, as mentioned above, left to join the Fighting Irish.
  • Lewis had his contract expire with the Ravens after 2001, as everyone assumed he would leave to get a head coaching job; that didn’t happen, so he had a one-year pit stop as the Redskins defensive coordinator before becoming the Bengals coach indefinitely.
  • Giunta was fired after the Rams defense collapsed in 2000.
  • Davis left to become the Miami Hurricanes head coach, and later, the Cleveland Browns head coach.

Left After Two Years (6)

Going all the way to the Super Bowl can sometimes work against a coach, as it may have with Lewis, or McDaniels or Patricia in the past. Returning to the same team is the norm, but if you are still on the same team two years later, you may not be head coaching material. None of these six left to become head coaches in the NFL:

Kevin Gilbride (2011 NYG OC)
Gregg Williams (2009 NOR DC)
Ron Meeks (2006 IND DC)
Greg Robinson (1998 DEN DC)
Fritz Shurmur (1996 GNB DC)
Ernie Zampese (1995 DAL OC)

  • Gilbride was retired/fired after the Giants offense declined after the Super Bowl run.
  • Williams had his contract “expire” after the Saints defense collapsed, amid other issues; he resurfaced as the Rams DC for about a month before being suspended for his role in BountyGate (i.e., the other issues).
  • Meeks “resigned” — noticing a trend here? — with the Colts after the ’08 season, but was hired as the Panthers defensive coordinator one week later.
  • Robinson was fired after the Broncos defense bottomed out in 2000. He went to the Chiefs in 2001, who would not become known for their defense.
  • Shurmur, who had a reputation as a defensive genius, left the Packers after the ’98 season to join Mike Holmgren in Seattle. Tragically, Shurmur never coached a game with the Seahawks, passing away of liver cancer that August.
  • Zampese was fired along with Barry Switzer after the 1997 season to make room for offensive-minded head coach Chan Gailey.

Three More Years (8)

Matt Patricia (2014 NWE DC)
Perry Fewell (2011 NYG DC)
Bruce Arians (2008 PIT OC)
Tom Moore (2006 IND OC)
Charlie Weis (2001 NWE OC)
Romeo Crennel (2001 NWE DC)
Greg Robinson (1997 DEN DC)
Sherman Lewis (1996 GNB OC)

Patricia, Crennel, and Weis stayed with the Patriots after winning the Super Bowl, winning another Super Bowl two years later, and making a third Super Bowl the next season, before ultimately all leaving for head coaching jobs. The other five?

  • Fewell lasted just one more year than Gilbride, as the Giants defense continued to disappoint year after year under Fewell.
  • Arians was retired/fired by the Steelers after 2011, and that’s when his career took off.  He joined the Colts as offensive coordinator but became head coach after Chuck Pagano stepped aside to battle a cancer diagnosis.  Arians would go on to win two AP Coach of the Year awards, in both 2012 and 2014.
  • Moore slowly transitioned from OC to senior offensive consultant with the Colts.  After the 2009 season, the 71-year-old Moore gave up those duties to Clyde Christensen, and Moore left the Colts after 2010 (he worked with the Jets in 2011, the Titans in 2012, and the Cardinals from 2014 to 2017, so he wasn’t question ready to retire).
  • Robinson, as mentioned above was fired three years after the ’97 Broncos won the title (and two years after the ’98 Broncos).
  • After Holmgren left the Packers in ’98, Ray Rhodes was brought in to replace him.  Lewis, the offensive coordinator, stuck around under the defensive-minded Rhodes, but both were gone when Green Bay brought in Mike Sherman (who was Holmgren’s OC in Seattle in ’99) as head coach in 2000. Lewis went on to the Vikings, but lasted just two years in Minnesota.

Four More Years (3)

Darrell Bevell (2013 SEA OC)
Matt Cavanaugh (2000 BAL OC)
Dave Campo (1995 DAL DC)

Bevell made it back to another Super Bowl with the Seahawks in 2014, but a questionable playcall at the end of that game — do you remember it? — has haunted his tenure ever since.  He was finally relieved of his offensive coordinator duties at the end of the 2017 season, and remains a free agent.

Cavanaugh was the offensive coordinator for one of the worst offenses to ever win a Super Bowl. Baltimore’s offense didn’t do any better from ’01 to ’04, and eventually, Cavanaugh was fired by the Ravens.  After the season, he got a job as offensive coordinator from the Pittsburgh Panthers under Wannstedt, giving the ’05 to ’08 Pitt Panthers two men who won Super Bowl rings as coordinators.  In their first year, Wannstedt and Cavanaugh announced that sophomore Tyler Palko had won the starting quarterback job, causing the backup quarterback to transfer.  The Ravens couldn’t have picked a better time to fire Cavanugh, as that backup quarterback was Joe Flacco.

Campo is the big outlier here.  He won the Super Bowl as the Cowboys defensive coordinator in ’95, stayed on post-Switzer under the offensive-minded Gailey, and then was named the Dallas head coach for the ’00 season as a way to try to return to the glory days in Texas. The Cowboys went 5-11 in each of his three seasons as head coach.

Five More Years (1)

Dean Pees (2012 BAL DC)

Pees lasted for five more seasons with the Ravens, but was retired/fired.  He came out of a month long retirement a couple of weeks ago to become the 2018 Titans defensive coordinator.

Six More Years (4)

Dick LeBeau (2008 PIT DC)
Kevin Gilbride (2007 NYG OC)
Bill Muir (2002 TAM OC)
Monte Kiffin (2002 TAM DC)

LeBeau lasted forever in Pittsburgh, but after winning his second Super Bowl with the Steelers in 2008, the defense gradually began to decline.  By 2014, Pittsburgh ranked 18th in both points and yards allowed, and LeBeau resigned after the season (and joined the Titans one month later).

Gilbride got a reprieve by winning another Super Bowl with the Giants in 2011, but as noted above, the offensive decline by 2013 eventually did him in.

Muir and Kiffin lasted as long as Jon Gruden did in Tampa Bay, lasting through the collapse at the end of the 2008 season.  But if their post-Gruden career was the same, their pre-Gruden career couldn’t have been any different.  Kiffin was the famed defensive coordinator who was 62 when Gruden arrived: he was extraordinarily well-respected but never given a serious look at a head coaching job because of his age (he would later join the Cowboys as defensive coordinator at 73 years old in 2013). Muir? Well, he had an even more unusual history.

Seven More Years (2)

Dom Capers (2010 GNB DC)
Gary Kubiak (1998 DEN OC)

Capers and the Packers won the Super Bowl in 2010 with a defense that ranked in the top 5 in both points allowed and yards allowed. The Packers never again ranked in the top 10 under Capers, and after the pass defense ranked in the bottom five in NY/A in both 2016 and 2017, Capers was finally fired on New Years day, 2018.

Kubiak left to become a head coach, which only happened after the Broncos finally won a playoff game again in 2005. Under Kubiak, Denver won the Super Bowl in ’97 and ’98, ranking in the top 3 in both points and yards both years. The Broncos did that in 2000, too, but Kubiak wasn’t able to land a head coaching job.  In fact, after the ’00 season, he interviewed with the expansion Houston Texans, but didn’t get the offer. The Broncos offense regresesd in ’01, but he had four more strong years under Shanahan from ’02 to ’05. But after not winning a postseason game from ’99 to ’04, Denver and Kubiak rebounded in ’05, going 13-3 and earning the 2 seed in the AFC.  After the season, he interviewed for the Texans job — and this time, he got it.

Eight (2)

Gary Kubiak (1997 DEN OC)
Pete Carmichael (2009 NOR OC)

Kubiak, of course, is on here because he won titles in both ’97 and ’98.

Carmichael? Well, he’s soon about to join the next list: all indications are that he will be back in 2018, which would make for 9 straight years as the Saints offensive coordinator after winning the Super Bowl.  Perhaps, like Kubiak, working for a head coach with a reputation as an offensive guru has hurt Carmichael, along with the whole Hall of Fame quarterback thing, too.  One could argue that Weis and Bill O’Brien with Brady, Joe Philbin with Rodgers, and Adam Gase with Manning haven’t helped his cause in that regard, as none have had magic touches at quarterback after getting jobs with new teams. But Carmichael is about to enter his 10th season with the Saints, and in his first nine, the Saints rank 1st in yards, 1st in yards per play, and 2nd in points. He’s always been talked about, but never given a serious look, perhaps because he’s viewed as the #3 man on the Saints offense.

It’s unprecedented for a coordinator to win a Super Bowl, and oversee a unit that’s this good for this long without getting a head coaching job.

Nine (1)

Dick LeBeau (2005 PIT DC)

And finally we have LeBeau ’05, who will soon be joined my Carmichael ’09. The difference here is that LeBeau already a job as a head coach with the Bengals and was in his seventies starting in 2007; Carmichael is just 46 years old.

{ 5 comments }

The ultimate backup

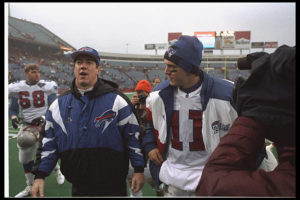
Frank Reich is the ultimate backup.  In 1984, Reich helped lead the largest comeback in college football history.  With Maryland trailing Miami 31-0, Reich came off the bench to replace Stan Gelbaugh and led the Terrapins to a 42-40 victory.  It remained the biggest comeback in college football for over thirty years.

Eight years later, with an injured Jim Kelly on the sidelines, Reich led the greatest comeback in NFL history, leading the Bills to a 41-38 playoff win over Houston after trailing 35-3 early in the third quarter.

And in 2017, Reich was the Eagles offensive coordinator when MVP favorite Carson Wentz tore his ACL, ending his season.  Reich helped design an offense that turned Philadelphia backup and Rams castoff Nick Foles into the Super Bowl MVP. After leading two miraculous comebacks as a backup quarterback, Reich was the man pulling the strings as the Eagles backup quarterback did something even Reich couldn’t do: win the Super Bowl.

And now? Reich is once again coming in off the bench. For most of January, Patriots offensive coordinator Josh McDaniels was expected to become the next Colts head coach.  But McDaniels ultimately changed his mind and decided to return to New England, leaving the Colts at the altar at the last minute.  In an embarrassing bind, Indianapolis has turned to the ultimate backup, tapping Reich as the team’s newest head coach.

Reich, after winning the Super Bowl as an offensive coordinator, is immediately becoming an NFL head coach. In addition to the two coordinators who were promoted by their franchises after winning the Super Bowl after their head coaches retired, Reich will become the 10th coordinator to win a Super Bowl and then become head coach with another team. [continue reading…]

{ 16 comments }

Comparing Frank Gore And Emmitt Smith

Is Emmitt Smith’s career rushing mark unbreakable? Before the start of the 2013 season, I wrote about whether Adrian Peterson — at the peak of his career following his AP MVP season — had a realistic chance to break Emmitt Smith’s career rushing record. My conclusion:

As incredible as Smith was through age 27, his production after turning 28 is arguably more impressive. Considering that Peterson is already over 1,000 yards behind Smith, his odds of capturing the record are really, really low. That’s not a knock on Peterson, who is clearly the game’s best running back today. Instead, this post should serve as a reminder of how impressive Smith’s totals truly are.

Peterson is now behind Frank Gore, after briefly holding a career edge over the older player.  Gore is now one of the all-time great “back half of career” running backs in NFL history.  In fact, Gore ranks 2nd all-time in career rushing yards after turning 27 years old. Gore isn’t yet retired, and he’s just under 1,000 yards away from finishing 1st in that category. The leader, of course, is Smith, who remains underrated by many NFL analysts because of his great production later in his career.

How great was it? Well, Gore has pretty much been good from the word go, but he’s always been behind Smith in career rushing yards and he never quite narrowed the gap. If you think Gore’s consistency has been amazing, well, it still pales in comparison to Smith. The graph below shows how many career rushing yards both players had through age X. Smith entered the NFL one year earlier than Gore (side note: both players were born in mid-May), but has almost always increased his lead: [continue reading…]

{ 17 comments }

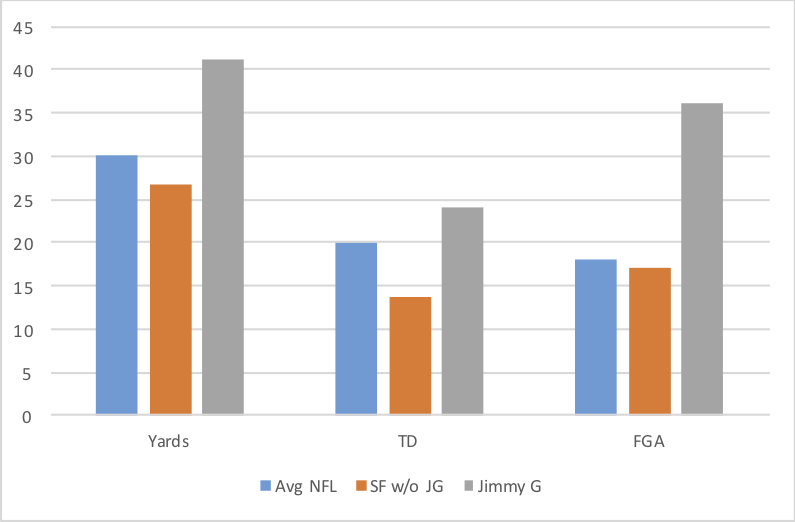
The San Francisco 49ers ranked just 27th in red zone offense in 2017, converting only 47% of opportunities into touchdowns. Given the hype around Jimmy Garoppolo, you might think San Francisco was much better during his time, but that’s not true. In fact, the 49ers converted 13 of 27 red zone opportunities into touchdowns during the first twelve weeks (the non-Jimmy G weeks), a 48% rate; that dropped to 11 of 24, or 46%, during Garoppolo’s time as a starter.

That…. was about the only bad thing that happened during the short but brilliant Garoppolo era. San Francisco went 5-0 with Jimmy G and 1-10 without him, making him +4.54 wins over the other quarterbacks; That’s one of the top four marks ever, alongside Marc Bulger on the 2002 Rams (6-1 with, 1-8 without), Vince Young on the 2009 Titans (8-2 with, 0-6 without), and Mike Phipps on the 1979 Bears (9-1 with, 1-5 without).

With Garoppolo, San Francisco’s offense averaged 41.2 yards per drive. The NFL average last year was 30.1 yards, and the Patriots led the NFL at 39.2 yards per drive over the course of the full season. San Francisco scored touchdowns at a rate well above average with Garoppolo under center (24% of all drives, compared to a league average rate of 20%; the Patriots led at 29.7%), but where the 49ers really shined was in kicking field goals. Remarkably, over the final five weeks of the season, San Francisco and Robbie Gould kicked (and made) 18 field goals; over the first 11 games, Gould attempted just 23 field goals! A whopping 36% of all 49ers drives under Garoppolo ended in a field goal attempt (all of which were successful):

[continue reading…]

{ 4 comments }

Jimmy Garoppolo just signed a 5 year, $137.5M contract with the 49ers, and $74M of that contract is guaranteed (with a total average annual salary of $27.5M).  Next month, Kirk Cousins is going to sign an even more massive contract. In addition to the 49ers and the team that signs Cousins, there are 12 teams that have quarterbacks with 2018 salary cap values in excess of $20M: [continue reading…]

{ 6 comments }

Super Bowl LII  was notable for a bunch of reasons, including as one of the best offensive games ever. One reason the game was so exciting: there were not only a ton of scores — 14 in total — but no real scoring streaks.

In most games, three consecutive scores all come from the same team. But not so in Super Bowl LII, neither the Eagles nor the Patriots scored three straight times. I’m defining a score, of course, as a touchdown, field goal, or safety, and not counting extra points or two point conversions as separate scoring plays.

At least one team was responsible for three consecutive scores in 36 of the first 51 Super Bowls. Only in the 2007 Patriots/Giants Super Bowl did both teams fail to score twice in a row — that is, the teams alternated scores throughout the game — so the 2017 Patriots/Eagles game was the 15th Super Bowl where the longest scoring streak was stopped at two scores. What makes that remarkable is how there were 14 scores altogether, the most in Super Bowl history (the Pats/Giants Super Bowl had 5, by way of reference). Take a look at the chart below, which shows the longest scoring streak and the number of scoring plays in each Super Bowl: [continue reading…]

{ 42 comments }

The Eagles defense had two dominant games this postseason. Against the high-powered Falcons offense, Philadelphia held Matt Ryan, Julio Jones and company to just 10 points, with the lone touchdown drive coming on a short field following a muffed punt at the Eagles own 18-yard line. With the game in the balance, Philadelphia’s defense held on a goal-line stand to preserve the 15-10 win. In the NFC Championship Game, the defense allowed an opening drive touchdown, and then responded with a pick six on the second drive. That was it: the Eagles defense allowed zero net points to Minnesota, and recorded two more turnovers and two turnovers on downs the rest of the way.

Philadelphia’s offense also had two dominant games this postseason. Against Minnesota, the offense scored 31 points on the team’s first 7 drives of the game, and Nick Foles finished with a 141.4 passer rating on 33 attempts. In the Super Bowl, Philadelphia gained 538 yards of offense and scored 41 points. The Eagles scored on 80% of their drives against the Patriots, with half of those 10 drives ending in touchdowns. [continue reading…]

{ 18 comments }

Super Bowl LII set an NFL record for total yards in a game with 1,151. That’s not total yards in a Super Bowl, or total yards in a playoff game, but total yards in any game in NFL history. That’s pretty wild.

Also remarkable, and highly correlated with the incredible offensive output is the fact that the Eagles and Patriots combined for just one punt and two turnovers. There have been four games since 1950 (which is as far back as reliable punting data goes) where there were zero punts: two involved the 2014 Saints, one was the Peyton Manning/Trent Green playoff game between the Colts and Chiefs, and one was the Super Bowl that never happened — the ’90s Bills and ’90s 49ers facing off in week 2 of the 1992 regular season. That Buffalo/San Francisco game was a classic battle of passing attacks that I’ve written about before, where both passers topped 400 yards in a year where no other quarterback did in a single game.

From 1950 to 2016, there were just 24 games that featured fewer than 4 combined turnovers and punts. The Patriots had four unsuccessful drives that aren’t quite captured here — the clock ran out on New England in both the first and second halves, the Patriots lost the ball on downs, and missed a field goal (although I wouldn’t necessarily categorize that as a bad drive) — but otherwise, just four bad drives for both teams combined is pretty rare. The Eagles had just two bad drives out of 10! Remarkably, the Eagles and Patriots combined for 9 offensive touchdowns and 6 more drives that ended in field goal attempts.

That’s 15 drives that ended in offensive scores (or possible scores), and just three bad drives (punts or turnovers).  That +12 differential is tied for the most ever with this classic Peyton Manning/Tony Romo game from 2013 (17 good drives, 5 bad) and a random Rams/Chargers game from 2000 where St. Louis scored on every single drive of the game before kneeling (17 good, 5 bad).

By just about any measure, Super Bowl LII was one of the greatest offensive games in league history, but let’s throw this out to the crowd: what stats best show this in your opinion?

{ 27 comments }

Brady flexed his passing muscles in Super Bowl LII

Tom Brady had a Super Bowl performance for the ages. He completed 28 of 48 passes for 505 yards, with 3 TDs and 0 INTs, while taking only one sack (which, of course, was a strip-sack that ultimately decided the game). That translates to 560 Adjusted Net Yards (giving 20 yards for a touchdown and removing sack yards), which over 49 dropbacks, is 11.43 Adjusted Net Yards per Attempt.

In the regular season, the Eagles defense allowed just 5.10 Adjusted Net Yards per Attempt to opposing quarterbacks. Therefore, Brady was a whopping 6.32 ANY/A above expectation; over the course of 49 dropbacks, it means Brady produced 310 Adjusted Net Yards above expectation.

The beauty of this formula is that it inherently adjusts for both schedule and era. Below are the best passing performances in Super Bowl history. Nobody can match the efficiency over such a high number of passing plays as what Brady did last night: [continue reading…]

{ 137 comments }

2018 Hall of Fame Class and 2017 AP Awards Announced

The 2018 Hall of Fame class was announced last night: Ray Lewis, Randy Moss, Brian Urlacher, Terrell Owens, and Brian Dawkins were the five modern-era selections. They were joined by Jerry Kramer and Robert Brazile from the senior’s committee and Bobby Beathard as the Contributor selection.

Lewis was an obvious pick as it gets. Here’s what I wrote yesterday:

You won’t be on an island if you suggest that Lewis is the best inside linebacker in NFL history. Lewis scores well in pretty much every metric possible. When it comes to Approximate Value, what Ray Lewis did was unbelievable. He made 13 Pro Bowls, which is also absurd. The Ravens went on a magical run to win the Super Bowl in his final year, and at the time he retired, he was arguably the best player to retire after winning the Super Bowl.

Moss is just the sixth WR to make the Hall of Fame on his first ballot. He had a whopping 56 games where he picked up 100 yards and a touchdown, which is a pretty good way to identify the best wide receivers since 1950.  This stat also makes Owens (43 games) look like a pretty clear choice, too.

Urlacher is another strong choice.  He was the AP DPOY in 2005, the best defensive player in the NFC in 2006, and the AP runner-up (and selection of others) as the DPOY in 2001. There are 15 linebackers in the Hall of Fame who have 50+ points of AV and were a four-time first-team AP All-Pro; Urlacher is one of those, but he’s barely on the Bears Mount Rushmore of linebackers.

Dawkins is another great choice, and he made it to Canton just in the nick of time. In the last 20 years, Dawkins is one of the top 10 defensive backs of the last 20 years, but Ed Reed and Champ Bailey are both newly eligible next year, and Troy Polamalu is up in two years.  Getting Dawkins in now makes sense, as he checks all the boxes: longevity (193 starts), sustained success (9 Pro Bowls), and elite talent (4 first-team AP All-Pros, and a fifth from the Sporting News in 2009).

Kramer has been an overdue selection for a long time. But from a trivia perspective, here are the noteworthy bits: he gives the 1961 Packers a remarkable 12 Hall of Famers, including 11 starters (36-year-old safety Emlen Tunnell being the sole exception).  Kramer is also the final member of the NFL’s 50th anniversary team to make it to Canton.  Brazile played on some mediocre (or worse) defenses, but was well-regarded as one of the top defenders of his generation and the first great 3-4 linebacker.

In addition to the Hall of Fame announcement, we had the AP awards announcements last night. [continue reading…]

{ 8 comments }

Bill Belichick is no stranger to the playoffs.  He’s been on the sidelines for 38 postseason games as a head coach with 28 victories, and entering the 2017 playoffs, he was tied with Don Shula and Tom Landry for most playoff games coached (36).  Of his three opposing head coaches in the 2017 playoffs — Mike Mularkey, Doug Marrone, and Doug Pederson — none had made the playoffs before this year.

Prior to their games with the Patriots, Marrone and Pederson had been 2-0, while Mularky had been 1-0, giving Belichick a 35-game/25-win advantage over Mularkey and Marrone, and a 36-game/26-win advantage over Pederson (who, like Belichick, had a bye this postseason). It should go without saying, but let’s state the obvious truth: a 36-game coaching edge, and a 26-win coaching edge, are both playoff records.

Before this year, the largest coaching differential in playoff game experience was 34, held by Tom Landry in this game against John Robinson and the Rams.

The table below shows the largest coaching disadvantages in playoff history prior to 2017 (since now the top three rows would all be Belichick). Note that all of the data presented below is the coaching experience prior to the start of that postseason, so Belichick would show up as +36 against each of Mularkey, Marrone, and Pederson. [continue reading…]

{ 2 comments }

2018 Hall of Fame Candidates

Below are the 15 modern-era finalists for the class of 2018:

Rk Ballot Player Pos From To AP1 PB St CarAV
G
1 final Ray Lewis LB 1996 2012 7 13 14 158 228
2 final Randy Moss WR 1998 2012 4 6 12 123 218
3 final Terrell Owens WR 1996 2010 5 6 13 119 219
4 final Brian Urlacher LB 2000 2012 4 8 12 118 182
5 final Edgerrin James RB 1999 2009 1 4 8 114 148
6 final Alan Faneca G 1998 2010 6 9 13 113 206
7 final Kevin Mawae C 1994 2009 3 8 15 107 241
8 final Isaac Bruce WR 1994 2009 0 4 13 102 223
9 final Brian Dawkins DB 1996 2011 4 9 14 100 224
10 final Steve Hutchinson G 2001 2012 5 7 11 96 169
11 final John Lynch DB 1993 2007 2 9 12 87 224
12 final Ty Law DB 1995 2009 2 5 11 85 203
13 final Joe Jacoby T 1981 1993 2 4 11 82 170
14 final Everson Walls DB 1981 1993 1 4 11 81 186
15 final Tony Boselli T 1995 2001 3 5 6 66 91

Lewis, Moss, Urlacher, and Hutchinson are first-time finalists, and three of them are no-brainers.

You won’t be on an island if you suggest that Lewis is the best inside linebacker in NFL history. Lewis scores well in pretty much every metric possible. When it comes to Approximate Value, what Ray Lewis did was unbelievable. He made 13 Pro Bowls, which is also absurd. The Ravens went on a magical run to win the Super Bowl in his final year, and at the time he retired, he was arguably the best player to retire after winning the Super Bowl.

Moss? He’s another no-brainer.  I haven’t produced a career ranking of wide receivers in awhile, but when you look at Moss’s production in terms of gray ink, he’s a pretty obvious choice. Only five modern-era wide receivers have been selected enshrinement on their first ballot: Jerry Rice, Paul Warfield, Steve Largent, Raymond Berry, and Lance Alworth. There’s a good chance Moss joins that list, and he’s a top-5 choice for greatest wide receiver of all time on just about every list.

For a 7-year stretch, Hutchinson was a first-team All-Pro 6 times, including 5 by the Associated Press. In 2007 and 2008, Adrian Peterson led the NFL in rushing yards per game, and in 2005, Shaun Alexander was the AP MVP. Both players had success running behind Hutchinson, who was an obvious choice for the 2000s All-Deade team. And while the All-Decade team has two starters, I suspect the majority would view Hutchinson as the best guard of the 2000s. He’s an obvious first ballot Hall of Fame candidate.

Urlacher, of course, has a very strong Hall of Fame case as well, although his candidacy may be overshadowed by the overwhelming presence of Lewis. After Lewis and perhaps Junior Seau (who spent about half of his career as an outside linebacker), Urlacher is probably the best middle linebacker of the last three decades (aka the post-
Mike Singletary era, although fans who place less emphasis on longevity may prefer Luke Kuechly or Patrick Willis.  Given the presence of Lewis and that Zach Thomas has a similar resume on paper, I’m not sure that Urlacher has distinguished himself enough to become a first ballot Hall of Famer.  But he will no doubt wind up in Canton soon. [continue reading…]

{ 51 comments }

Today’s guest post comes from Miles Wray, a long-time reader of the site. You may know him as the host of the daily NBA podcast The 82 Review. You can also find him on Twitter @mileswray. What follows are Miles’ words: as always, we thank our guest writers for their contributions.


It’s not a career goal that anybody would — or even could — shoot for, but it’s a goal that any player would still be proud of: to win the Super Bowl with two separate teams. There are 38 players in the league’s history who have accomplished the feat — it’s an achievement more rare, at the very least, than a Hall of Fame career.

It feels reasonable to assume that most of those 38 dual-winners played in the 21st century, during the sport’s highest-ever era of roster churn. But no: there are only two active players who are dual winners — perhaps because there are more NFL teams than ever today, meaning that any individual team of yesteryear had a greater percentage chance of getting to the Super Bowl. [1]The 36 retired players with this distinction are, in alphabetical order: Herb Adderley, Matt Bahr, Robert Bailey, Jim Burt, Bill Curry, Billy Davis, Dave Duerson, Marv Fleming, Andy Frederick, … Continue reading One of those two active players has a credible Hall of Fame case: Adam Vinatieri, victor in 2001, 2002, and 2004 with the Patriots, and also in 2006, his very first year with the Colts. The other is an undrafted linebacker who just went through a 3-13 season: Jonathan Casillas won the 2009 Super Bowl with the Saints — where he helped recover the infamous surprise onside kick at the start of the second half — and also was acquired as a special-teamer in a fortuitous midseason trade by the Patriots in 2014.

One way or another, Vinatieri and Casillas will have company after this Super Bowl Sunday. On the Patriots roster, there is hired mercenary James Harrison, winner in both 2005 and 2008 with the Steelers. The Eagles, on the other hand, have apparently made it an intentional strategy to sign past winners. The Philadelphia roster is flush with eight ring-wearers. Since the Eagles have never won a Super Bowl, all eight of these players acquired their hardware with other squads: [continue reading…]

{ 11 comments }