≡ Menu

Yesterday, I wrote about how Michael Irvin was dominant in Receiving Yards per adjusted Team Pass Attempts.  From 1991 to 1996, he ranked 1st in that category three times, and 2nd in the other three seasons.  From a Gray Ink perspective, that would mean he would get 10 points each for his three first place finishes and 9 points each for his three second place finishes, for a total of 57 points.  He also ranked 10th in 1998, which would give him one more point.

The fact that I wrote about Irvin yesterday wasn’t a coincidence.  I calculated the Gray Ink for each receiver in NFL history in RY/aTPA, and Irvin’s 58 points (which turns out to be 55 points after you adjust for the number of teams in the league) was the third best in NFL history. Here are the top 75 receivers by this metric. You can read the table below as follows. Jerry Rice played from 1985 to 2004, and accumulated 92 points of Gray Ink, where a 1st-place finish in Receiving Yards/adjusted Team Pass Attempt is worth 10 points, a 2nd-place finish 9 points, a 3rd-place finish 8 points, and so on. The final column is a pro-rated value number, which lowers the value gives in seasons where there were fewer than 32 teams. This most clearly impacts older players like Don Hutson, who drops from 102 points to 66.9 points. [continue reading…]

{ 0 comments }

Michael Irvin Was Better Than You Think

Michael Irvin ranks 27th on the list of career receiving yards. At the time he retired, Irvin ranked 9th in that metric, so some of his “poor” ranking is due to the passing inflation of the last two decades.

Another reason is because he had a relatively short career. Irvin also ranks tied for 11th in receiving yards per game, and was tied for 5th when he retired. How short? His prime was from ages 25 to 32, an 8-year stretch that encompassed 86.5% of his career receiving yards.

During those years, covering the 1991 to 1998 seasons, Irvin led all players in receiving yards.  Yes, that’s all players, even Jerry Rice, although Rice missed 9 more games than Irvin due to a torn ACL.  Even still, Rice averaged 85.5 yards per game, Irvin 83.7, and the two receivers were far ahead of the rest of the NFL.  But it’s worth noting that the Cowboys were a run-heavy team during this era: Dallas ranked 24th in pass attempts during this time, while the 49ers ranked 12th.

Irvin was a dominant player on a team that wasn’t pass-happy; he was particularly dominant in games his team won, when he averaged 85 receiving yards per game.  Those Cowboys won a lot of games, and didn’t pass often, but when they did, they passed to Irvin.  And it usually worked.

Over the weekend, I wrote about the year-by-year leaders in receiving yards per team pass attempt (RY/TPA) and Receiving Yards per Adjusted Team Pass Attempt (RY/aTPA), which are two simple but effective ways to measure receiver play. RY/TPA simply takes a player’s number of receiving yards and divides it by his team’s number of pass attempts; RY/aTPA adjusts for missed games. [continue reading…]

{ 1 comment }

Yesterday, we looked at the leaders in receiving yards per team pass attempt. Today, I want to look at the leaders in receiving yards per adjusted team pass attempt.

What do I mean by adjusted team pass attempts?  Let’s look at three players from last year: Julio Jones, DeAndre Hopkins, and Antonio Brown.  Those three had 1444, 1378, and 1533 yards, respectively, in 2017. And the Falcons, Texans, and Steelers had 530, 525, and 590 pass attempts, respectively, last year. This means Jones averaged 2.72 receiving yards per team pass attempt, Hopkins 2.62, and Brown 2.60. Pretty straightforward.

Except Jones played in 16 games, Hopkins 15, and Brown 14. If we assume Hopkins therefore only saw (15/16) * 525 pass attempts — or 492 pass attempts — then Hopkins averaged 2.80 receiving yards per adjusted team pass attempt. And if we assume Brown only saw (14/16) * 590 pass attempts — or 516 pass attempts — then Brown averaged 2.97 RY/aTPA. [continue reading…]

{ 0 comments }

In 2017, Julio Jones had 1,444 receiving yards playing for the Falcons.  Last year, Atlanta had only 530 pass attempts (excluding sacks); this means Jones recorded 2.72 receiving yards per Atlanta team pass attempt.  That was the most in the NFL last year, followed by DeAndre Hopkins (2.62) and Antonio Brown (2.60), although it’s worth noting that both Hopkins and Brown missed games.

This was the second season in a row that Jones led the NFL in receiving yards per team pass attempt. In 2016, he had 1,409 yards while Atlanta had 537 pass attempts; that’s a 2.62 RY/TPA average that is even more impressive when you consider that Jones missed two games that season. Jones is already in select company, and one more year would put him in exclusive territory: only four players have led the league in RY/TPA in more than two seasons. Don Hutson did it 7 times, Jerry Rice 4 times, and Steve Smith and Michael Irvin each did it three times. [continue reading…]

{ 1 comment }

You’re going to want to sit down for this one: Antonio Brown and Julio Jones were the two best receivers in the NFL last year.

Houston star DeAndre Hopkins was responsible for 37.8% of all Texans receiving yards last season, the highest rate in the league in 2017 (Hopkins also did this as a rookie in 2014).  But Brown and Jones weren’t too far behind him: Brown had 34.8% of all Steelers receiving yards despite missing nearly three full games.  And Jones had 33.8% of all Falcons receiving yards, the third highest ratio in the NFL.  But Hopkins played on a mediocre Texans passing attack that ranked 20th in ANY/A (more precisely, he spent 40% of his time on a great passing attack led by Deshaun Watson, and 60% of his time on a terrible pass offense with Tom Savage and T.J. Yates under center).  Jones and Brown played on passing offenses that averaged 7.0 ANY/A, ranking 7th and 8th in the NFL in 2017.

One of my favorite things to do at Football Perspective is to look at receiving production in the context of two stats: percentage of team yards and team passing efficiency (highlighted here when looking at Gary Clark’s production on the ’91 Skins). Why do I like looking at this? In some ways, these are counter forces.  Put a great wide receiver on a good passing attack and he might not have a huge share of the offense, but the passing attack should be outstanding.  Put him on a bad passing attack, and the pass efficiency may not be great, but he should have a huge share of the pie.  It is hardly perfect, but it’s fun to look at.

So how do we quantify this? Let’s use Keenan Allen as an example for the table below. He had 30.6% of all Chargers receiving yards last season and Los Angeles averaged an impressive 7.48 ANY/A. He ranked 6th in percentage of Team Receiving Yards, and the Chargers ranked 3rd in ANY/A. Allen was 1.03 standard deviations above average in percentage of team receiving yards – the % of TRY Z-Score — and the Chargers were 1.47 standard deviations above average in ANY/A (the ANY/A Z-Score). If you add those two numbers together, Allen was 2.50 standard deviations above average, the metric by which the table below is sorted. [continue reading…]

{ 0 comments }

Among players with at least 8,000 career receiving yards, there are just seven players who averaged fewer than one receiving touchdown per 200 receiving yards: Jeff Graham was by far the biggest outlier, with just one touchdown catch per 272 receiving yards. Henry Ellard is the second biggest outlier because (1) he’s Ellard, a borderline Hall of Famer and (2) he had just one touchdown per 212 receiving yards. Next up is Julio Jones at one score for every 211 receiving yards, followed by Eric Moulds, Johnnie Morton, another HOF candidate in Andre Johnson, and finally Terry Glenn.

So why does Jones have so few touchdowns as a percentage of his astronomical receiving yardage? To dig in a little deeper, I wanted to compare the length of his touchdowns to that of the other best receivers in today’s game. Who are the top 10 wide receivers of this current era? That’s subjective, of course, but in addition to Jones, a pretty good list would include Antonio Brown, Odell Beckham, DeAndre Hopkins, Mike Evans, A.J. Green, Larry Fitzgerald, Demaryius Thomas, Dez Bryant, and T.Y. Hilton. [continue reading…]

{ 2 comments }

A random thought experiment for you guys today. Suppose you are the owner of an expansion team, with a below-average offense line, a below-average set of skill position players, and a below-average defense. Your only goal is to get to at least .500 in your first season.

By luck, you do have one wish. You get to have as your quarterback either Cam Newton or Joe Montana; in either case, you would get your quarterback in his prime, so you’re getting the best Newton or Montana possible.

Which would you choose? The obvious answer, of course, is Montana: a man always in discussion for the title of best quarterback of all time, and an AP All-Pro three times in four years during (one stretch of) his prime.  But in this example, there’s no Jerry Rice, Dwight Clark, Freddie Solomon, Roger Craig, John Taylor.  And, perhaps most importantly, no Bill Walsh.

With Newton, you get arguably the best running quarterback in football history, but a player whose passing efficiency stats have been average at best in four of the last five seasons.  But Newton has a lot more experience carrying below-average teams to success than Montana.

So who would you pick, and why?

{ 0 comments }

Last week, I looked at how many players were active for at least one game by class year, both before and after the current CBA was adopted in 2011. I also analyzed the production of players (by class year) from 2005 to 2010 and from 2012 to 2017 using Approximate Value and looking at just defensive players.

I’m short on time today, but wanted to do a quick search. I looked at all players who were in years 5-9 of their career and played in a given season. Then, I looked to see how many of those played in a single game the next year. The results are consistent with the other studies I’ve done: players in years 5-9 are losing jobs the following year. About 25% of players who were in their 5th, 6th, 7th, 8th, or 9th years in 2016 were not on an active roster in 2017. That rate used to be about 20%.

More time to come, but let me know if you have other thoughts on how to measure this.

{ 0 comments }

AFC East Coaches Other Than Belichick Since 2001

Since Bill Belichick began his reign of terror on the AFC East in 2001, it’s been a rough time to be a Jets, Dolphins, or Bills head coach.  It’s been a rough two decades for Buffalo — Marv Levy was the last Bills coach to win the division back in 1995 — but it hasn’t been much better for New York or Miami. Belichick has won 15 of the 17 division titles since 2001, with Herm Edwards leading the Jets to the division title way back in 2002.

The other man to do it was Tony Sparano, who passed away unexpectedly yesterday. In one of the great turnarounds in NFL history, taking the 1-15 Dolphins from the worst record in football to AFC East champions in one season.

But even Sparano left Miami with a losing record. In fact, since 2001, Dave Wannstedt (31-26) and Todd Bowles (2-1 as interim head coach) are the only Dolphins coaches with winning records. Adam Gase (16-16) is the next most successful Miami head coach since 2001, followed by Nick Saban (15-17), Tony Sparano (29-32), Joe Philbin (24-28), and Cam Cameron (1-15). Along with Bowles, Dan Campbell (5-7) and Jim Bates (3-4) spent time as interim coaches in Miami.

The Bills have had 9 head coaches since 2001: Sean McDermott (9-7) has the only winning record, followed by Rex Ryan (15-16), Doug Marrone (15-17), Mike Mularkey (14-18), Dick Jauron (24-33), Gregg Williams (17-31), and Chan Gailey (16-32); Perry Fewell (3-4) and Anthony Lynn (0-1) also spent time as interim head coaches. [continue reading…]

{ 0 comments }

On Tuesday, I looked at the best passing seasons in NFL history. On Thursday, I looked at the worst passing seasons in NFL history, but by measuring quarterbacks against average.  There are “problems” with that to the extent there are ever problems with anything presented as trivia, and Adam suggested a fix in the comments: use 75% of league average as replacement level, and compare the worst passers to replacement level rather than average.

Let’s look at Bobby Hoying in 1998. He was horrible that year: he averaged a league-worst 1.43 ANY/A, even worse than the dread 1.93 ANY/A by a rookie Ryan Leaf. In fact, since 1979, Hoying/Leaf ’98 (not to be confused with Sosa/McGwire ’98) are the only two players to average less than 2.0 ANY/A on 200+ pass attempts in a season. That is not likely to be seriously challenged anytime soon: JaMarcus Russell, who averaged 2.31 ANY/A in 2009, is the closest since.

How bad was Hoying that year? He threw a record 224 pass attempts without a touchdown, also unlikely to be seriously challenged ever again.  The league average ANY/A that year was 5.31, and Hoying had 259 dropbacks.  As a result of being  3.88 ANY/A below average, he produced -1,004 yards of value over average, as noted last week.  That was the 10th-worst season of all time.

If we use replacement level, then Hoying gets compared to 75% of 5.31 ANY/A, or 3.98 ANY/A, which gives him -660 yards below replacement.  That’s actually the lowest of any season in NFL history, although if you pro-rated older seasons, it drops down to 15th. The worst season by this method comes from Cardinals quarterback Ronnie Cahill in 1943. Cahill was a star running back at Holy Cross, and he played exactly how you would expect a running back at Holy Cross would play quarterback in the NFL. He threw 3 TDs against 21 INTs, had a passer rating of 33.5, and averaged -2.5 AY/A. He had the second-worst season against league average, and jumps to the lowest season once we pro-rated for the fact that 1943 was a 10-game season. This means the war-ravaged ’43 season produced the best and worst passing seasons in NFL history. [continue reading…]

{ 0 comments }

Yesterday, I looked at how many players were active for at least one game by class year, both before and after the current CBA was adopted in 2011. Today, I want to do the same thing — analyze the production of players (by class year) from 2005 to 2010 and from 2012 to 2017. But instead of using games, I’ll use Approximate Value, and instead of using all players, I will use just defensive players.

On the X-Axis is all defensive players by class year, with the 2012-2017 players in blue and the 2005-2010 players in blue.  On the Y-Axis is percentage of AV by all players.  In general, second, third, and fourth year players produce the most AV, and that was true prior to the current CBA.  But the new CBA imposes an artificially low cap on the amount that can be paid to players in their first four seasons (with few exceptions).  As a result, teams seem to be giving more playing time and roster spots to players in their first four years, with 7th-8th-9th year players losing playing time: [continue reading…]

{ 0 comments }

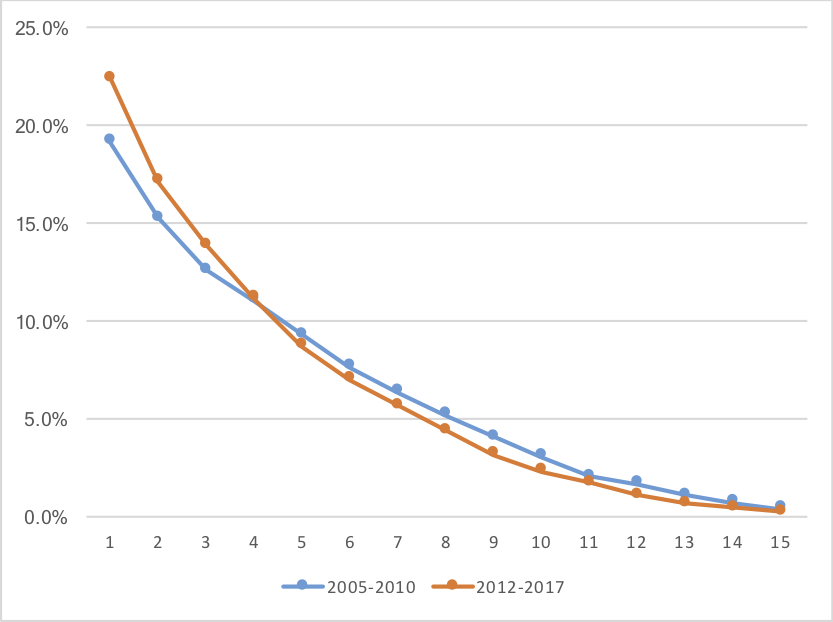
From 2005 to 2010, 42% of all players (minimum one game) in the NFL were in their 5th year or later. Meanwhile, playing in their first three years made up just 47% of all players in the NFL during that time. In other words, there were only a few more of the youngest players than the oldest players (5th plus years) in the NFL.

In 2011, there was a lockout and then the new CBA was instituted. The collective bargaining agreement instituted a very low wage scale for rookies and a higher floor for veterans; as a result, all other things equal, players on rookie contract were much more valuable than veterans due to significantly lower salaries. The 2011 year is a complicated year to analyze because teams scrambled to put together rosters and they didn’t have a chance to fully comprehend the new CBA. But let’s look at 2012 to 2017: during the last six years, less than 36% of all players to play one game in a season was in their 5th year or later, and over 53% of all players were in their first three years.

The graph below shows what percentage of players were in their 1st, 2nd, 3rd, 4th, etc., years of playing status over two sets of eras: 2005 to 2010, and 2012 to 2017.

[continue reading…]

{ 1 comment }

On Tuesday, I looked at the best passing seasons in NFL history. What about the reverse? Blake Bortles had one of the worst seasons in 2014 in NFL history, in terms of quality combined with quantity.  There are a lot of bad seasons, but what makes that Bortles year stand out was that he played nearly the full season.  This was his rookie year, and Bortles started 13 games; he averaged 3.81 ANY/A when the league average was 6.14 ANY/A.  Bortles therefore produced -1,234 Adjusted Net Yards of Value above average, since he had 530 dropbacks.  That’s actually the worst in NFL history, which isn’t too surprising; most of the bad years with a large number of dropbacks came in recent history.

The table below shows the 500 “worst” seasons in passing history in terms of Adjusted Net Yards of Value below average. Note that the 500th-worst passing season (pro-rated, as on Tuesday) is -365. This means that a season that is 0.70 ANY/A below average on 550 attempts will make this list. That’s not a really bad season, of course. So just a reminder when you view these lists that quantity is a key component here: [continue reading…]

{ 0 comments }

This is the final article in a seven-part series. Below is an update to my 2015 ranking of the greatest quarterbacks of all time. I won’t be offering detailed player stories or explanations of the rankings, because [1] not much has changed in the last three years, and [2] I’ve spent the last month and a half writing about the top 100 QBs of the Modern Era, as ranked by by QB-TSP. If you haven’t read that series already, I’d really encourage you to do so before continuing here. At least read the posts on the quarterbacks ranked 1-40.

Best Statistical QBs: 81-100
Best Statistical QBs: 41-60
Best Statistical QBs: 21-40
Best Statistical QBs: 1-20
Best Statistical QBs: HOF Data [continue reading…]

{ 0 comments }

In 1984, Dan Marino averaged 8.94 Adjusted Net Yards per Attempt (ANY/A, defined as passing yards + 20*Pass TDs – 45*INTs – sack yards, all divided by pass attempts plus sacks) while the league average was 5.00 ANY/A.   Marino had 577 dropbacks (pass attempts plus sacks), so he had 3.94 ANY/A over average over 577 dropbacks; that means he provided 2,271 Adjusted Net Yards of Value over average.

In 2004, Peyton Manning averaged 9.78 ANY/A while the league average was 5.63 ANY/A. Manning had 510 dropbacks, so he is credited with 2,113 yards of Value that season.  This was Manning’s best year: even better than what he did in 2013, when averaged 8.87 ANY/A, the league average was 5.87, and Manning had a whopping 677 dropbacks. So he had 2,031 yards of Value that season.

The table below shows the top 500 passing seasons by this metric. For non-16 game seasons, the final column (ProRt value) prorates the value as if it was a 16-game season.For AFL seasons 1960 to 1964, in the pro-rated column, I assigned only 50% credit in 1960, 60% in ’61, 70% in ’62, 80% in ’63, 90% in ’64, and then full credit in the remaining seasons. I also assigned full credit for all AAFC seasons. [continue reading…]

{ 1 comment }

Yards From Scrimmage Gray Ink and Walter Payton

On Saturday, I wrote about Gray Ink for rushing yards, and showed the career leaders using the methodology described in that post. Today, we do the same but for Yards from Scrimmage.

One interesting player is LeSean McCoy, who continues to look like a Hall of Famer. He ranked 15th in Rushing Yardage Gray Ink, which puts him comfortably in the group of Hall of Fame rushers. This is due to a number of strong seasons: he led the NFL in rushing in 2013, ranked 3rd in 2014, 4th in 2011 and 2017, and 6th in 2016. He also has a good chance (he needs 1700 more rushing yards with the Bills) of becoming just the third player with 5,000 rushing yards with two different teams.

Well, McCoy also ranks 15th in Yards from Scrimmage Gray Ink. He led the NFL in YFS in 2013, and ranked 4th in 2010 and 2017 and 5th in 2011 and 2016. He leads the NFL in yards from scrimmage since entering the league, too.

The table below shows the top 100 players in Gray Ink in terms of Yards From Scrimmage: [continue reading…]

{ 0 comments }

Barry Sanders and Rushing Yards Gray Ink, Part 2

Yesterday, I looked at Gray Ink for running backs. You can read the details there, but today I wanted to delve into the specifics behind each player’s grade.

The table below shows the results for each running back in each season where he finished in the top 10 in rushing. It’s fully sortable and searchable. Let’s use Edgerrin James as an example.  If you type his name into the search box, you’ll see the following: In 2000 and 1999, he led the league in rushing, and received 9.8 points for each year. In 2004, he ranked 4th in rushing, and gets 7 points for that finish. In ’05, he ranked 5th and in ’07 he ranked 7th; he gets 6 and 4 points for those performances.  In total, James receives 36.7 points of Gray Ink, the most of any non-HOFer among eligible running backs. [continue reading…]

{ 0 comments }

Barry Sanders and Rushing Yards Gray Ink

On Thursday, I looked at a measure of passing efficiency and gray ink: where a first place finish rewards a player with 10 points, a second-place finish 9 points, a third-place finish 8 points, and so on. Today, I’m going to do the same thing but with rushing yards, so a rushing crown is worth 10 points, a runner-up title is worth 9 points, and so on. You can read a few twists in this footnote. [1]I want to give more credit to seasons where there were more teams. So when Kareem Hunt led the 32-team NFL last season, that was worth 10 points. What about when Pug Manders led the 9-team NFL in … Continue reading

Let’s use Barry Sanders as an example. In four seasons, he led the NFL in rushing (+40 points), and in three other seasons, he was the runner up (+27 points). He also had two seasons where he ranked 4th in rushing yards (+14) and one season where he ranked 5th (+6), for a total of 87 points. Using the pro-rated method explained in the footnote, since there were fewer than 32 teams during his career, Sanders actually gets credit for 82.7 points. That is still the most of any player in history: [continue reading…]

References

References
1 I want to give more credit to seasons where there were more teams. So when Kareem Hunt led the 32-team NFL last season, that was worth 10 points. What about when Pug Manders led the 9-team NFL in 1941? That feels less meaningful, and that is especially true when comparing a 9th-place finish in 2017 to a 9th-place finish in 1941. One option is to take the number of points — say, 10 — and divided it (32/X), with X being the number of teams in the league. So if there are 9 teams, you would take 10 and divide it by 3.55, and get 2.8 points. That feels too extreme to me: it would make a first-place finish in a 9-team league less valuable than an 8th-place finish in a 32-team league. So do I use 10 points or 2.8 points… or do I split the baby? Well, that’s what I did: I averaged those two numbers to get 6.4 points, equal to a 4th- or 5th-place finish today. I was comfortable with that result, but your mileage may vary.

Other thoughts: I combined all AFL and AAFC seasons. Probably not ideal, but it was the quickest/simplest thing to do.

{ 0 comments }

ANY/A and the HOF Gray Ink Test, Part 2

Yesterday’s post about ANY/A and the HOF Gray Ink Test turned out to be very popular, with over 65 comments in 24 hours. So to facilitate further debate and discussion, I’m going to post the year-by-year ranks for each passer in the table below.

The table is fully sortable and searchable, but here is how to read it, using Manning’s line. He had a Pro-rated score of 110.8, the column the table is sorted by. The next 10 columns show his top 10 seasons. He had four seasons where he finished 1st in ANY/A — 2005, 2004, 2012, and 2006. In the parentheses in each cell I have included the number of pro-rated points. The only reason ’05 was Manning’s best year was because there were more qualified passers that year.

If you type ‘Aikman’ into the search box, you’ll see that his best season was a 2nd-place rank where he received 8.7 points; this was in 1995. His next best year was another 2nd-place finished where he received 8.6 points in 1993. He ranked 3rd in 1992 (7.1 points), 4th in 1994 (6.7 points), 6th in 1998 (4.8 points), and 10th in 1999 (1.0 point). If you type in Manning, you’ll see that both Archie and Eli topped out with a 5th-place ranking, although Eli’s was worth slightly more points because there were more qualifying passers that season. Archie had a 7th and 9th place finish, while Eli only has three other 10th-place finishes. [continue reading…]

{ 0 comments }

ANY/A and the HOF Gray Ink Test

A few years ago, I looked at Eli Manning and the HOF in the context of an ANY/A Gray Ink test. What do I mean by that? Here’s what I did:

  • Step 1) Calculate each quarterback’s ANY/A for each season of his career where he had enough pass attempts to qualify for the passing title (14 attempts per team game). ANY/A, of course, is calculated as follows: (Passing Yards + PassTDs * 20 – INTs * 45 – Sack Yards Lost) / (Pass Attempts + Sacks).
  • Step 2) For each quarterback, award him 10 points if he led the league in ANY/A, 9 points if he finished 2nd, 8 points if he finished 3rd, … and 1 point if he finished 10th. A quarterback receives 0 points if he does not finish in the top 10 in ANY/A or does not have enough pass attempts to qualify.
  • Step 3) For each quarterback, add his “points” from each season to produce a career grade.

I decided to update that post (written in 2014) and make a few changes.

1) I have included the results from the last four seasons.

2) I included sack data from 1960 to 1968, using estimated individual sack data based on team sack data.

3) I have lumped together the AAFC/AFL with the NFL in each season as if it was all one big league.

4) I have pro-rated the values based on the number of qualifying passers in each season. So let’s say a player ranks 4th in ANY/A in 2017, where there were 32 qualifying passers. He gets the average of 7 points and 7 points * 32 divided by 32, which is of course just 7 points. Now, let’s say a player ranks 4th in ANY/A in a 10-team league. He gets the average of 7 points and 7 points * 10/32 (2.18), which is 4.6 points. This is not a special formula, but a “good enough” metric that helps discredit players in smaller leagues, but not overly so (hence the average idea).

Okay, enough words. Here are the results. I have also included the raw totals, so you can see what happens if I didn’t pro-rate the values. Finally, I subjectively included some HOF labels at the end: actually in the HOF (not very subjective), Future HOFer, Borderline, and then either Not Eligible or a No for the HOF.

RkPlayerFirst YrLast YrRaw ScorePro ScoreHOF
1Peyton Manning19982015109110.8Fut HOF
2Dan Marino198319999690.9HOF
3Joe Montana197919948277.5HOF
4Tom Brady200020177777.3Fut HOF
5Drew Brees200120177676.7Fut HOF
6Brett Favre199120106867.2HOF
7Johnny Unitas195619738766.2HOF
8Dan Fouts197319876863.9HOF
9Y.A. Tittle194819648963.6HOF
10Steve Young198519996461.6HOF
11Fran Tarkenton196119787160.2HOF
12Norm Van Brocklin194919608155.8HOF
13Aaron Rodgers200520175353.6Fut HOF
14Otto Graham194619557853.4HOF
15Sammy Baugh193719528751.6HOF
16Roger Staubach196919795548.3HOF
17Philip Rivers200420174747.4Border
18Ben Roethlisberger200420174545.5Fut HOF
19Bobby Layne194819626242.6HOF
20Bart Starr195619715242.1HOF
21Ken Anderson197119864640.5Border
22Kurt Warner199820093939.5HOF
23Tony Romo200620163939.5Border
24Terry Bradshaw197019834238.7HOF
25Sonny Jurgensen195719744538.4HOF
26Charlie Conerly194819615738.2No
27Trent Green199720083737.5No
28Troy Aikman198920003937.0HOF
29Boomer Esiason198419973936.5No
30Len Dawson195719754033.5HOF
31John Hadl196219773932.5No
32John Elway198319983230.8HOF
33Tommy Thompson194019504629.7No
34Warren Moon198420003128.9HOF
35Milt Plum195719693728.2No
36John Brodie195719733328.1No
37Carson Palmer200420172727.6Not El.
38Billy Kilmer196119783327.5No
39Daryle Lamonica196319743227.4No
40Sid Luckman193919504326.2HOF
41Jim Hart196619843025.9No
42Matt Ryan200820172625.7Border
43.5Bob Griese196719802924.8HOF
43.5Joe Namath196519772924.8HOF
45Jim Kelly198619962624.5HOF
46Ken Stabler197019842723.5HOF
47Vinny Testaverde198720072423.4No
48Roman Gabriel196219772823.3No
49Bob Waterfield194519523623.2HOF
50Craig Morton196519822622.6No
51Daunte Culpepper200020092222.3No
52Rich Gannon198720042222.1No
53Jeff Garcia199920082222.0No
54Dave Krieg198019982321.4No
55Frankie Albert194619523121.2No
56Bert Jones197319822421.1No
57Brad Johnson199420082020.3No
58Tobin Rote195019662920.3No
59Earl Morrall195619762520.2No
60Mark Brunell199420112020.1No
61Mark Rypien198820012120.0No
62Billy Wade195419662820.0No
63Don Meredith196019682419.9No
64Jim Everett198619972119.6No
65Matt Hasselbeck199920151818.3Not El.
66Matt Schaub200420161818.0Not El.
67Chad Pennington200020101818.0No
68Steve McNair199520071817.9Border
69Brian Sipe197419831917.8No
70Bernie Kosar198519961917.7No
71Russell Wilson201220171717.6Border
72Donovan McNabb199920111717.1Border
73Joe Theismann197419851816.9No
74Chris Chandler198820041716.7No
75George Blanda194919752116.4HOF
76Bobby Thomason194919572416.3No
77Norm Snead196119761916.2No
78Joe Ferguson197319901816.1No
79Bill Kenney198019881715.9No
80Jeff George199020011515.3No
81Bill Nelsen196319721815.3No
82George Ratterman194719562215.2No
83Jake Plummer199720061515.1No
84Phil Simms197919931615.0No
85Parker Hall193919462614.3No
86Neil Lomax198119881514.0No
87.5Tom Flores196019691713.9No
87.5Ed Brown195419652113.9No
89Babe Parilli195219691713.6No
90Bobby Hebert198519961513.5No
91Scott Mitchell199220011413.4No
92Vince Ferragamo197719861413.3No
93Charley Johnson196119751512.8No
94Danny White197619881312.3No
95Lynn Dickey197119851312.2No
96Greg Landry196819841411.9No
97Ron Jaworski197419891211.6No
98Frank Ryan195819701411.5No
99Johnny Lujack194819511711.4No
100Cecil Isbell193819422011.3No
101Archie Manning197119841211.2No
102Steve Grogan197519901211.2No
103Nick Foles201220171010.8Not El.
104Randall Cunningham198520011110.6Border
105Steve Bartkowski197519861110.5No
106Steve DeBerg197819981110.3No
107Chris Miller198719991110.3No
108Tony Eason198319901110.2No
109Jared Goff201620171010.0Not El.
110Kirk Cousins20122017109.9Not El.
111Erik Kramer19871999109.7No
112James Harris19691979119.4No
113Doug Williams19781989109.4No
114Jim Zorn19761987109.4No
115Davey O'Brien19391940179.3No
116.5Andy Dalton2011201799.3Not El.
116.5Brian Griese1998200899.3No
118Tommy Kramer19771990109.2No
119David Garrard2002201099.1No
120Eli Manning2004201799.1Border
121Eddie LeBaron19521963138.9No
122Michael Vick2001201598.9Not El.
123Jim Finks19491955138.8No
124Josh McCown2002201788.6Not El.
125Paul Christman19451950148.6No
126Rudy Bukich19531968108.4No
127Jay Schroeder1985199498.4No
128Greg Cook19691973108.3No
129Matthew Stafford2009201788.1Not El.
130Pat Haden1976198198.0No
132.5Alex Smith2005201788.0Not El.
132.5Robert Griffin2012201688.0Not El.
132.5Kerry Collins1995201188.0No
132.5Doug Flutie1986200588.0No
135Paul Governali19461948127.9No
136Frank Filchock19381950137.9No
137Dak Prescott2016201787.8Not El.
139Craig Erickson1992199787.6No
139Ken O'Brien1984199387.6No
139Frankie Sinkwich19431947137.6No
141Neil O'Donnell1991200387.5No
142Steve Beuerlein1988200377.2No
143Cam Newton2011201777.2Border
144Andrew Luck2012201677.1Not El.
145Gus Frerotte1994200877.0No
146Damon Huard1998200877.0No
147Jeff Hostetler1988199776.8No
148Jim Harbaugh1987200076.8No
149Jim McMahon1982199676.6No
150Wade Wilson1981199876.6No

The future HOFers rank 1-4-5-13-18 by this litmus test: there’s not much to debate there.

Among the actual HOFers, only George Blanda — who is probably the least qualified quarterback of the “modern” era to make the HOF — ranks outside of the top 50. Bob Waterfield and Ken Stabler are the next lowest quarterbacks, and that’s consistent with how I’d view them. As a litmus test, this does a decent job for being a (somewhat) quick and dirty way to measure HOF play.

Among the Not Eligible guys, only Carson Palmer is in the top 60. He ranks 37th, on the back of a #1 season in 2015 with the Cardinals (+10.3 points, since there were 34 qualifying passers that year), a #3 season with the Bengals in 2005 (+8.25, also 34), and a 6th and 7th rankings in ’06 and ’14 (+5, +4.06). That’s not really a HOF career by any stretch, but it’s a memorable career.

Among the pure no guys — those who have been passed over and didn’t receive my subjective borderline label — you have Charlie Conerly at 26, Trent Green at 27, Boomer Esiason at 29, John Hadl at 31, Tommy Thompson at 33, and Milt Plum at 35. All good quarterbacks, occasionally great ones, who are HOVG (at worst) type players.

And then we get to the borderline guys. I gave 10 players that label, including three guys who entered the league in the last ten years and who are probably too young to really evaluate. Among the other 7…

Philip RiversKen Anderson, and Tony Romo all are in the top 25, and make sense to be discussed together. None of the three won a Super Bowl, all three had fantastic efficiency numbers, and all three are more favored by the analytics crowd than the non-analytics crowd. Statistically, based on regular season efficiency, all three are clear HOF players. But, of course, that’s not the HOF test.

Steve McNair, Donovan McNabb, and Randall Cunningham are all borderline guys, too, and are underrated by an analysis like this that ignores rushing. They rank 68th, 72nd, and 104th. McNair (2003) and Cunningham (1998) each have a first place finish in ANY/A, while McNabb has a 2nd (2006) and 3rd (2004) place spot. McNair also has a 5th (2001) and a 9th (1999), while Cunningham has a 10th (1990), but that’s it, and that’s the problem. McNabb and McNair each have three finishes at 11 or 12 (worth zero) and McNabb has three more at 13/14; this analysis ignores solid seasons and rushing, which is going to hurt these guys a lot.

And then, of course, we get to Eli Manning. He was the inspiration for this post three years ago, and not much has changed since.  Manning has a a 5th-place finish from 2011 (+6.1), and three 10th place finishes (2009, 2012, and 2015, each worth 1 point).  He also has a 12th (2014) and a 13th (2010) place finish, but those are his only other top-15 seasons.  Manning performs horribly in the ANY/A Gray Ink test for HOFers.  He’s far behind Blanda, let alone the Stabler/Waterfield floor of quarterbacks.

The graph below shows the data data but with color-coded labels: black for HOF or future HOFer,red for not in, orange for not eligible, and large green dots for the borderline guys.  The running quarterbacks (McNair, McNabb, Cunningham, and Newton) are at the back of the pack with Manning (the second farthest dot to the right); the three “stats stars” are to the left, and then you have Ryan who currently ranks just outside of the top 40 (the X-Axis is rank; the Y-Axis is prorated value).

What do you guys think?

{ 1 comment }

Brad Oremland is a longtime commenter and a fellow football historian. Brad is also a senior NFL writer at Sports Central. There are few who have given as much thought to the history of quarterbacks and quarterback ranking systems as Brad has over the years. What follows is Brad’s latest work on quarterback statistical production.


This is the penultimate article in a seven-part series. It is a supplement to my series on the greatest quarterbacks of all time, last year’s article on the top-ranked QBs in Total Statistical Production, and last month’s post about QB-TSP in the 2017 season and another way of using TSP. Over the last five weeks, I’ve written about the top 100 quarterbacks of the Modern Era, as ranked by TSP:

81-100
61-80
41-60
21-40
1-20

This article presents a different way of evaluating quarterbacks. It is data-heavy, so if you’re just here for my prose, I’m sorry to disappoint. The chart below shows those same 100 QBs, along with each player’s: Adjusted TSP, Career Value, Seasons among the top 10 in QB-TSP, Top-10-Points, Year-Points, 500-TSP seasons, 1,000-TSP seasons, 1,500-TSP seasons, 2,000-TSP seasons, 2,250-TSP seasons, 2,500-TSP seasons, Pro Bowls, All-Pro honors ((From 1970-present, I used the Associated Press All-Pro Team. I counted First-Team selections as 3 points and Second-Team selections as 1 point. A First-Team selection by one or more other major organizations, for a player not named First-Team by AP, counts as +1, and an MVP selection by any major organization was worth +1.

For instance, in 2016, Tom Brady was named Second-Team All-Pro by AP (1 pt), but First-Team by the Sporting News, so he scored 2 pts that season. The score of AP First-Team All-Pro Matt Ryan was unaffected, remaining 4 points (including his MVP selection). In 1993, the AP All-Pros were Steve Young and John Elway, but the Sporting News chose Troy Aikman. Young scored 3, and Aikman and Elway 1 each. In 1990, Joe Montana scored 4 points, with Randall Cunningham and Warren Moon earning 2 each. [continue reading…]

{ 1 comment }

A couple of months ago, I asked this question on Twitter:

Do you know the answer? I’ll give you a couple of moments to think about it. First, a graph showing the 200 players with the most pass attempts in NFL history (all have at least 1,325 attempts). On the X-Axis is completion percentage; on the Y-Axis is Yards per Completion. There are no era adjustments here, which can also make it kind of fun: over time, completion percentages have skyrocketed, while the average yardage gained per completion has decreased. As a result, a player with a very high yards per completion percentage almost certainly played long ago, and therefore has a low completion percentage (and vice versa). Take a look: [continue reading…]

{ 1 comment }

Championship Leverage, By Bryan Frye

Today’s post is a re-post from friend of the program Bryan Frye’s site, which is being republished with his permission and encouragement. As regular readers know, Bryan operates his own fantastic site, http://www.thegridfe.com. You can view all of Bryan’s guest posts here, and follow him on twitter @LaverneusDingle. What follows are Bryan’s words, with minor editing from Chase.


Over the years, I’ve given much thought to the value (Championship Leverage) of postseason games relative to regular season games. Sabermetrics guru Tom Tango invented the Leverage Index in 2008 to apply a value to the gravity of a given base-out-inning situation in baseball. Later, Neil Paine used the concept for basketball and, subsequently, football. I found his application of the concept to NFL quarterbacks to be particularly interesting, and I decided to go into more detail on Neil’s methodology and expand the findings back to 1936 (the first NFL season with a standardized schedule). [continue reading…]

{ 0 comments }

Yesterday, we looked at quarterback records against the spread.  In that post, I noted that Tom Brady and the Patriots have been favorites in a remarkable 52 consecutive games, which would nearly be an NFL record if Brady hadn’t missed any games. For his career, the Patriots have been favored in 232 games that Brady has started, been an underdog 52 times, and the line has been a Pick’em in 4 games.

The table below shows the number of games that each quarterback’s team has been a favorite, underdog, or pick’em since 1978. For quarterbacks who started games before 1978, like Terry Bradshaw, I have played ** next to their name to indicate that this data does not cover their whole career.  Post-1978 Bradshaw, however, has the highest percentage of games as a favorite, followed by Steve Young and then Brady. [continue reading…]

{ 0 comments }

Joe Montana and Records Against The Spread

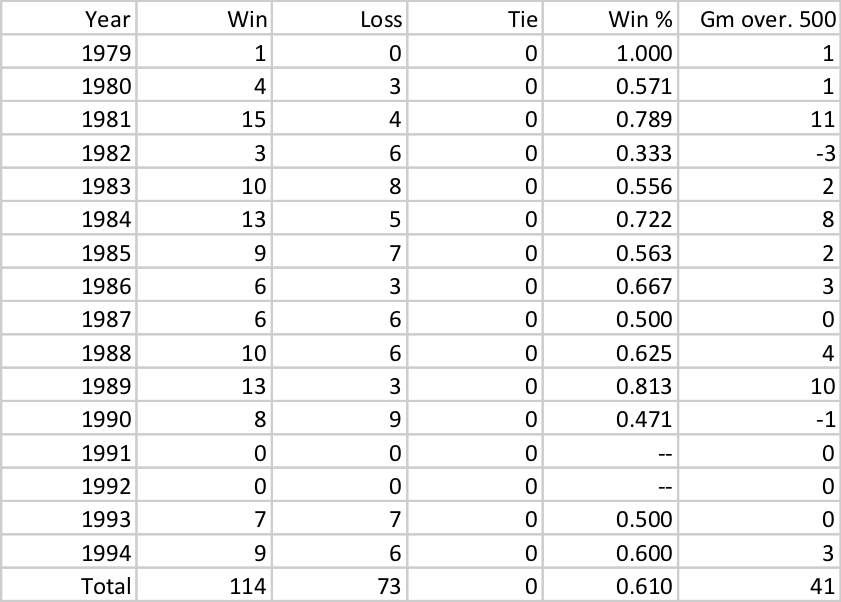
Joe Montana’s teams were really good at winning football games, going 117-47 and 16-7 in games started by the Hall of Fame quarterback. Montana’s teams had a 0.711 overall winning percentage, which is great; but what’s even more remarkable is how well his teams did against the points spread.

On average, Montana’s teams were favored by 4.5 points. And given the nature of how points spreads work, you would expect most teams to win about half of their games against the spread. But Montana’s teams went 114-73 against the spread, a remarkable winning percentage of 0.610. Much of the success was due to the 49ers of 1981 (15-4 ATS), 1984 (13-5), and 1989 (13-3). The ’81 team was one of the most surprising Super Bowl champions of all time; San Francisco was favored in just 9 of 19 games that year, with three of those spreads being just 1-point lines. And the ’84 and ’89 teams were two of the greatest teams of all time, so it’s not surprising that they had great ATS records, too. The table below show’s the record against the spread for each of Montana’s teams in each season of his career:

Also really good against the spread, of course, is Tom Brady and the Patriots. The ’01, ’03, and ’04 Patriots were all Super Bowl champions that were remarkable against the spread, combining to go 41-11-3 relative to the Vegas odds. The Patriots remained solid but unspectacular against the spread since then, although the ’16 team went 13-2 with Brady under center.

What makes the Brady stuff all the more remarkable: the last 52 times the Patriots have taken the field with Brady under center, the Patriots have been favored. And you have to go back 60 games, November 2014 game against the Packers, where New England has been underdogs with Brady under center. More on that tomorrow. [continue reading…]

{ 0 comments }

Brad Oremland is a longtime commenter and a fellow football historian. Brad is also a senior NFL writer at Sports Central. There are few who have given as much thought to the history of quarterbacks and quarterback ranking systems as Brad has over the years. What follows is Brad’s latest work on quarterback statistical production.


Brees threw a lot in garbage time

What I thought was an off-hand musing about Drew Brees’ production in low-leverage situations (for my ongoing series about the greatest statistical QBs in history) sparked a surprisingly contentious debate about whether Brees had padded his stats in garbage time.

I tried to align this with a very conservative definition of “garbage time” … all data are from 2004-17 — 2004 was Brees’ first good season — and none of the game/score situations below produced any wins by any team during those years. “P/B/R” indicates the combined total of Peyton Manning, Tom Brady, and Aaron Rodgers.

Please pardon the informal prose and formatting; this was originally composed as a comment, not an article. [continue reading…]

{ 1 comment }

Brady vs. Manning, Yearly ANY/A

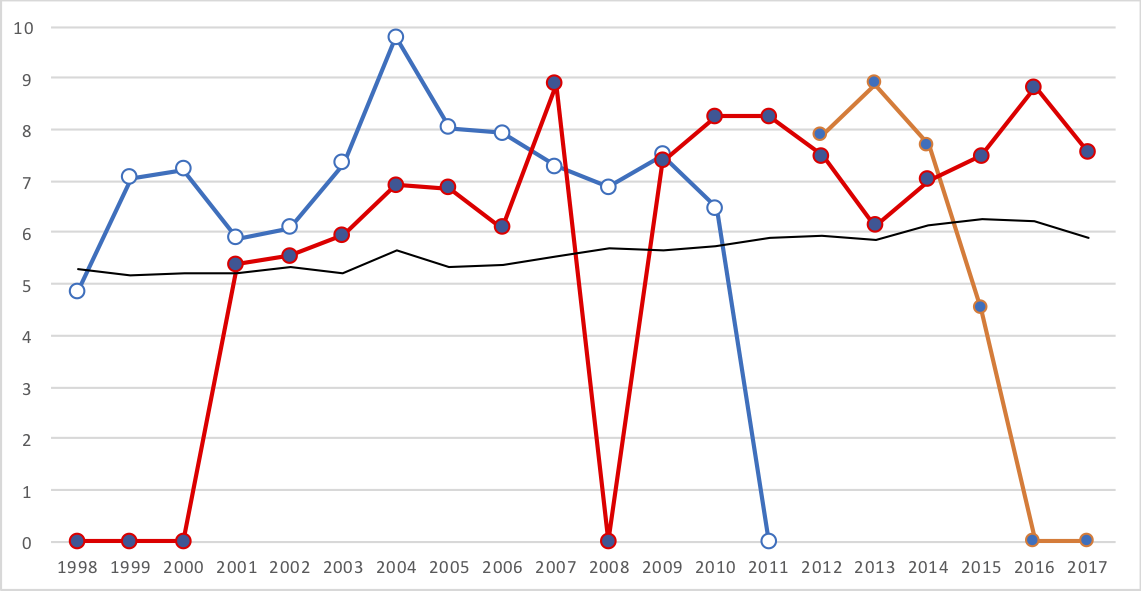
Yesterday, Brad Oremland’s great series on his top-ranked QBs in Total Statistical Production concluded. You should give that a read today, especially if you missed it because of the holiday.One thing that Brad wrote about in the Manning section was how Manning was nearly always better than Brady during the ’00s. It’s easy to forget about that now — Brady has been the much better QB for each of the last three years, and for most years in the ’10s. But during the ’00s, the only year that Brady was clearly better was ’07.I decided to make a graph of the Adjusted Net Yards per Attempt for Tom Brady (in red with blue dots) and Peyton Manning (in blue with white dots for his Colts years, and orange with blue dots for his Broncos years) for each of the last 20 seasons. Brady missed all or nearly all of the ’98 (college), ’99 (college), ’00 (backup), and ’07 (injury) seasons, while Manning missed all of the ’11 (injury), ’16 (retired), and ’17 (retired) seasons. They each get a zero for those seasons, even tho Brady threw 14 passes combined in those years. The thin black line represents league average ANY/A each season.You can break this down into a few categories. [continue reading…]

{ 0 comments }

Top 100 QBs: 20-1, By Brad Oremland

Brad Oremland is a longtime commenter and a fellow football historian. Brad is also a senior NFL writer at Sports Central. There are few who have given as much thought to the history of quarterbacks and quarterback ranking systems as Brad has over the years. What follows is Brad’s latest work on quarterback statistical production.


This is part five of a seven-part series. It is a supplement to my 2015 series on the greatest quarterbacks of all time, last year’s article on the top-ranked QBs in Total Statistical Production, and a recent post about QB-TSP in the 2017 season and another way of using TSP. I strongly encourage you to read those pieces if you haven’t done so already. You may also be interested in the previous entries of this series.

Best Statistical QBs: 81-100
Best Statistical QBs: 61-80
Best Statistical QBs: 41-60
Best Statistical QBs: 21-40

In this series, I present the top 100 pro football quarterbacks as ranked by QB-TSP. This is a purely statistical ranking, with all the drawbacks that entails, and in many places it is not reflective of my subjective evaluations. This week, we examine the top 20 quarterbacks of the Modern Era.

Questions and comments are encouraged, but please understand that this series is a product of extensive research and analysis, not whim or guess or hot take, and it was produced with no agenda except to inform and explain. Thanks for reading. [continue reading…]

{ 0 comments }

Checkdowns: Trivia On 100 Yard Rushing Games

Let’s start with some trivia.

Which running back has the most 100-yard rushing games in his career?

Click 'Show' For the Answer Show

There have been 11 running backs who have rushed for 100+ yards in a winning effort in 40 or more regular season games. Ten of them are in the Hall of Fame, but the man who has done it 51 times — the third most ever — is not (and is eligible). Name him.

Click 'Show' For the Answer Show

Which running back has the best winning percentage in games when he rushed for 100+ yards, minimum 15 games?

Click 'Show' For the Answer Show

Which running back has the best winning percentage in games when he rushed for 100+ yards, minimum 30 games?

Click 'Show' For the Answer Show

Here’s a record that I am confident will not be broken in the next 20 years, and might not ever be broken at all. One running back rushed for 100+ yards in a game that his team lost 32 times in his career. No other player has done it more than 23 times. To get a sense of comparison, Adrian Peterson and Steven Jackson have done it 31 times, combined.  Name him.

Click 'Show' For the Answer Show
[continue reading…]

{ 0 comments }

Frank Gore’s Career Has Been Almost All Prime

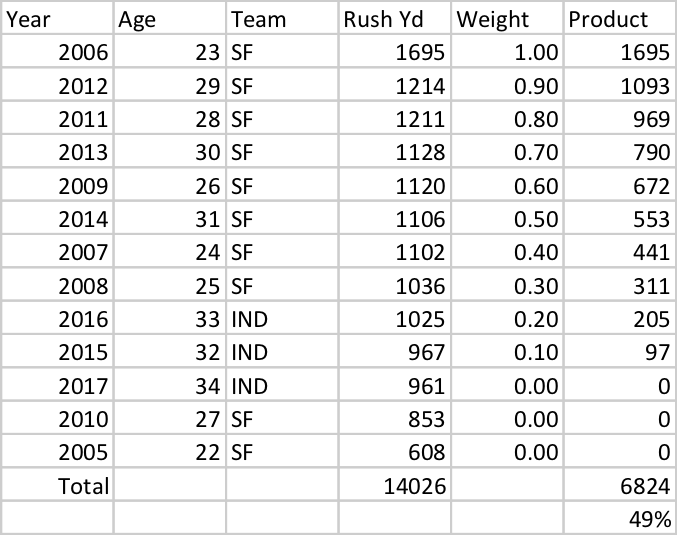
Frank Gore has had a remarkable career. He’s averaged at least 60 rushing yards per game in 12 different seasons, second only to Emmitt Smith. But it’s also been somewhat remarkable in how unremarkable each season has been: Gore averaged a nondescript 43.4 rushing yards per game as a rookie and then an eye-popping 105.9 rushing yards per game in his second season; since then, for 11 straight years, Gore has averaged between 60 and 80 rushing yards per game. No other player has more than 7 such seasons in their career, let alone consecutive, with Warrick Dunn, Franco Harris, and Ricky Watters tied for second place on the list.

So far, Gore has rushed for 14,026 rushing yards in his career.  But I wanted to try to identify similar — and dissimilar — rushers to Gore.  So here’s what I did: for each running back, I identified his rushing yards in each season of his career.  For seasons where the league had fewer than 16 team games per season, I pro-rated that player’s production as if the league had 16 games.  So players in a 14-game season get their rushing yards bumped by 14.3%, regardless of how many games they played.  Then, I gave a player 100% credit for their best rushing season, 90% credit for their second best rushing season, 80% credit for their third best rushing season, and so on.  Doing this gives Gore just 6,824 rushing yards, just under half of his actual total.

[continue reading…]

{ 0 comments }
Previous Posts