In this series, I will be looking at the history of coaches, quarterbacks, rushers, and receivers for all 32 franchises. For coaches and quarterbacks, I will be looking at how much their franchise’s career records (regular season only) would change if we removed the games with that person. For rushers and receivers, I will note how many times that player was the team’s leading rusher/receiver over the course of their time with that franchise (regular plus postseason).
Previous Teams:
AFC East: Dolphins, Bills, Jets, and Patriots
NFC East: Cowboys, Eagles, Giants, and Redskins
AFC North: Steelers, Browns, Ravens, and Bengals
NFC North: Packers, Vikings, Bears, and Lions
AFC South: Jaguars, Colts, Texans, and Titans
NFC South: Panthers, Falcons, Saints, and Buccaneers
AFC West: Raiders, Chiefs, Chargers
NFC West: Seahawks, Rams
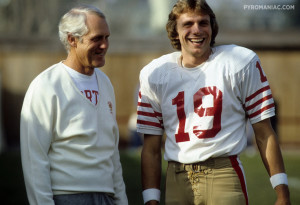
As for Walsh, he was the architect of the team’s dynasty; he inherited the worse team in football, and after a couple of seasons rebuilding the roster, the franchise took off: his 49ers won 70.4% of their regular season games from ’81 to ’88, along with three Super Bowls. Buck Shaw and Jim Harbaugh had great tenures in San Francisco, too, with each peaking in a season where they lost in the championship game to the Browns/Ravens.
Ovr Rk | Coach | G | W | L | T | HC Win % | FrG | FrW | FL | FrT | Fr W% | Win% w/o HC | Diff |
---|---|---|---|---|---|---|---|---|---|---|---|---|---|
13 | George Seifert | 128 | 98 | 30 | 0 | 0.766 | 1072 | 570 | 486 | 16 | 0.539 | 0.508 | 3.1% |
54 | Buck Shaw | 114 | 71 | 39 | 4 | 0.64 | 1072 | 570 | 486 | 16 | 0.539 | 0.527 | 1.2% |
55 | Bill Walsh | 152 | 92 | 59 | 1 | 0.609 | 1072 | 570 | 486 | 16 | 0.539 | 0.528 | 1.1% |
60 | Jim Harbaugh | 64 | 44 | 19 | 1 | 0.695 | 1072 | 570 | 486 | 16 | 0.539 | 0.529 | 1% |
92 | Steve Mariucci | 96 | 57 | 39 | 0 | 0.594 | 1072 | 570 | 486 | 16 | 0.539 | 0.534 | 0.5% |
173 | Monte Clark | 14 | 8 | 6 | 0 | 0.571 | 1072 | 570 | 486 | 16 | 0.539 | 0.539 | 0% |
187 | Frankie Albert | 36 | 19 | 16 | 1 | 0.542 | 1072 | 570 | 486 | 16 | 0.539 | 0.539 | 0% |
282 | Red Hickey | 55 | 27 | 27 | 1 | 0.5 | 1072 | 570 | 486 | 16 | 0.539 | 0.541 | -0.2% |
292 | Red Strader | 12 | 4 | 8 | 0 | 0.333 | 1072 | 570 | 486 | 16 | 0.539 | 0.542 | -0.2% |
295 | Ken Meyer | 14 | 5 | 9 | 0 | 0.357 | 1072 | 570 | 486 | 16 | 0.539 | 0.542 | -0.2% |
303 | Fred O'Connor | 7 | 1 | 6 | 0 | 0.143 | 1072 | 570 | 486 | 16 | 0.539 | 0.542 | -0.3% |
322 | Jim Tomsula | 17 | 6 | 11 | 0 | 0.353 | 1072 | 570 | 486 | 16 | 0.539 | 0.542 | -0.3% |
339 | Mike Singletary | 40 | 18 | 22 | 0 | 0.45 | 1072 | 570 | 486 | 16 | 0.539 | 0.543 | -0.3% |
349 | Pete McCulley | 9 | 1 | 8 | 0 | 0.111 | 1072 | 570 | 486 | 16 | 0.539 | 0.543 | -0.4% |
358 | Dick Nolan | 112 | 54 | 53 | 5 | 0.504 | 1072 | 570 | 486 | 16 | 0.539 | 0.543 | -0.4% |
407 | Chip Kelly | 16 | 2 | 14 | 0 | 0.125 | 1072 | 570 | 486 | 16 | 0.539 | 0.545 | -0.6% |
426 | Kyle Shanahan | 32 | 10 | 22 | 0 | 0.313 | 1072 | 570 | 486 | 16 | 0.539 | 0.546 | -0.7% |
443 | Dennis Erickson | 32 | 9 | 23 | 0 | 0.281 | 1072 | 570 | 486 | 16 | 0.539 | 0.547 | -0.8% |
450 | Jack Christiansen | 67 | 26 | 38 | 3 | 0.41 | 1072 | 570 | 486 | 16 | 0.539 | 0.548 | -0.9% |
486 | Mike Nolan | 55 | 18 | 37 | 0 | 0.327 | 1072 | 570 | 486 | 16 | 0.539 | 0.551 | -1.1% |
The best two-man race at quarterback in the NFC is with the 49ers. Joe Montana went 100-39 with the team (0.719), while Steve Young was 91-33 (0.734). Like the Colts, this is a tight two man race where the franchise is basically .500 once you remove games from either quarterback.
Steve DeBerg was 7-28, and no quarterback has hurt the franchise’s mark as much as his tenure. Of course, it was hardly all DeBerg’s fault: he started as a rookie for a terrible team, and gave way to Montana right as the team started to get good (that part might not be a coincidence). Walsh would go on to have significantly more success later in his career with the Chiefs.
Also interesting: John Brodie, Alex Smith, Jeff Garcia, and Colin Kaepernick are four of the seven quarterbacks to start at least 50 games for the team, and all four finished within two games of .500.
Ovr Rk | QB | G | W | L | T | QB Win % | FrG | FrW | FL | FrT | Fr W% | Win% w/o QB | Diff |
---|---|---|---|---|---|---|---|---|---|---|---|---|---|
13 | Joe Montana | 139 | 100 | 39 | 0 | 0.719 | 1017 | 532 | 471 | 14 | 0.530 | 0.500 | 3% |
16 | Steve Young | 124 | 91 | 33 | 0 | 0.734 | 1017 | 532 | 471 | 14 | 0.530 | 0.502 | 2.8% |
106 | Y.A. Tittle | 78 | 45 | 31 | 2 | 0.590 | 1017 | 532 | 471 | 14 | 0.530 | 0.525 | 0.5% |
203 | Steve Bono | 6 | 5 | 1 | 0 | 0.833 | 1017 | 532 | 471 | 14 | 0.530 | 0.528 | 0.2% |
207 | Jimmy Garoppolo | 8 | 6 | 2 | 0 | 0.750 | 1017 | 532 | 471 | 14 | 0.530 | 0.528 | 0.2% |
219 | Shaun Hill | 16 | 10 | 6 | 0 | 0.625 | 1017 | 532 | 471 | 14 | 0.530 | 0.528 | 0.2% |
239 | Elvis Grbac | 9 | 6 | 3 | 0 | 0.667 | 1017 | 532 | 471 | 14 | 0.530 | 0.529 | 0.1% |
271 | Matt Cavanaugh | 2 | 2 | 0 | 0 | 1.000 | 1017 | 532 | 471 | 14 | 0.530 | 0.529 | 0.1% |
281 | George Mira | 6 | 4 | 2 | 0 | 0.667 | 1017 | 532 | 471 | 14 | 0.530 | 0.529 | 0.1% |
350 | Jim Cason | 1 | 1 | 0 | 0 | 1.000 | 1017 | 532 | 471 | 14 | 0.530 | 0.530 | 0% |
351 | Bob Gagliano | 1 | 1 | 0 | 0 | 1.000 | 1017 | 532 | 471 | 14 | 0.530 | 0.530 | 0% |
352 | Jim Druckenmiller | 1 | 1 | 0 | 0 | 1.000 | 1017 | 532 | 471 | 14 | 0.530 | 0.530 | 0% |
353 | Ty Detmer | 1 | 1 | 0 | 0 | 1.000 | 1017 | 532 | 471 | 14 | 0.530 | 0.530 | 0% |
354 | Demarcus Dobbs | 1 | 1 | 0 | 0 | 1.000 | 1017 | 532 | 471 | 14 | 0.530 | 0.530 | 0% |
377 | Jeff Kemp | 6 | 3 | 2 | 1 | 0.583 | 1017 | 532 | 471 | 14 | 0.530 | 0.530 | 0% |
442 | Mike Moroski | 2 | 1 | 1 | 0 | 0.500 | 1017 | 532 | 471 | 14 | 0.530 | 0.530 | 0% |
467 | Troy Smith | 6 | 3 | 3 | 0 | 0.500 | 1017 | 532 | 471 | 14 | 0.530 | 0.530 | 0% |
474 | Tom Owen | 8 | 4 | 4 | 0 | 0.500 | 1017 | 532 | 471 | 14 | 0.530 | 0.530 | 0% |
485 | Steve Spurrier | 26 | 13 | 12 | 1 | 0.519 | 1017 | 532 | 471 | 14 | 0.530 | 0.530 | 0% |
583 | Billy Kilmer | 1 | 0 | 1 | 0 | 0.000 | 1017 | 532 | 471 | 14 | 0.530 | 0.531 | -0.1% |
584 | Chris Weinke | 1 | 0 | 1 | 0 | 0.000 | 1017 | 532 | 471 | 14 | 0.530 | 0.531 | -0.1% |
671 | Joe Reed | 7 | 3 | 4 | 0 | 0.429 | 1017 | 532 | 471 | 14 | 0.530 | 0.531 | -0.1% |
672 | Scott Bull | 7 | 3 | 4 | 0 | 0.429 | 1017 | 532 | 471 | 14 | 0.530 | 0.531 | -0.1% |
750 | Bob Waters | 2 | 0 | 2 | 0 | 0.000 | 1017 | 532 | 471 | 14 | 0.530 | 0.531 | -0.1% |
751 | Dennis Morrison | 2 | 0 | 2 | 0 | 0.000 | 1017 | 532 | 471 | 14 | 0.530 | 0.531 | -0.1% |
752 | Cody Pickett | 2 | 0 | 2 | 0 | 0.000 | 1017 | 532 | 471 | 14 | 0.530 | 0.531 | -0.1% |
767 | Earl Morrall | 4 | 1 | 3 | 0 | 0.250 | 1017 | 532 | 471 | 14 | 0.530 | 0.531 | -0.1% |
791 | Nick Mullens | 8 | 3 | 5 | 0 | 0.375 | 1017 | 532 | 471 | 14 | 0.530 | 0.531 | -0.1% |
813 | Alex Smith | 75 | 38 | 36 | 1 | 0.513 | 1017 | 532 | 471 | 14 | 0.530 | 0.531 | -0.1% |
868 | Steve Stenstrom | 3 | 0 | 3 | 0 | 0.000 | 1017 | 532 | 471 | 14 | 0.530 | 0.532 | -0.2% |
950 | Trent Dilfer | 6 | 1 | 5 | 0 | 0.167 | 1017 | 532 | 471 | 14 | 0.530 | 0.532 | -0.2% |
957 | Norm Snead | 8 | 2 | 6 | 0 | 0.250 | 1017 | 532 | 471 | 14 | 0.530 | 0.532 | -0.2% |
958 | J.T. O'Sullivan | 8 | 2 | 6 | 0 | 0.250 | 1017 | 532 | 471 | 14 | 0.530 | 0.532 | -0.2% |
981 | Frankie Albert | 30 | 13 | 16 | 1 | 0.450 | 1017 | 532 | 471 | 14 | 0.530 | 0.532 | -0.2% |
1012 | Lamar McHan | 9 | 2 | 7 | 0 | 0.222 | 1017 | 532 | 471 | 14 | 0.530 | 0.533 | -0.3% |
1014 | Jeff Garcia | 71 | 35 | 36 | 0 | 0.493 | 1017 | 532 | 471 | 14 | 0.530 | 0.533 | -0.3% |
1015 | Jim Plunkett | 26 | 11 | 15 | 0 | 0.423 | 1017 | 532 | 471 | 14 | 0.530 | 0.533 | -0.3% |
1019 | Colin Kaepernick | 58 | 28 | 30 | 0 | 0.483 | 1017 | 532 | 471 | 14 | 0.530 | 0.533 | -0.3% |
1021 | Blaine Gabbert | 13 | 4 | 9 | 0 | 0.308 | 1017 | 532 | 471 | 14 | 0.530 | 0.533 | -0.3% |
1047 | Brian Hoyer | 6 | 0 | 6 | 0 | 0.000 | 1017 | 532 | 471 | 14 | 0.530 | 0.533 | -0.3% |
1053 | Ken Dorsey | 10 | 2 | 8 | 0 | 0.200 | 1017 | 532 | 471 | 14 | 0.530 | 0.533 | -0.3% |
1097 | C.J. Beathard | 10 | 1 | 9 | 0 | 0.100 | 1017 | 532 | 471 | 14 | 0.530 | 0.534 | -0.4% |
1105 | Tim Rattay | 16 | 4 | 12 | 0 | 0.250 | 1017 | 532 | 471 | 14 | 0.530 | 0.534 | -0.4% |
1159 | John Brodie | 158 | 74 | 76 | 8 | 0.494 | 1017 | 532 | 471 | 14 | 0.530 | 0.537 | -0.7% |
1207 | Steve DeBerg | 35 | 7 | 28 | 0 | 0.200 | 1017 | 532 | 471 | 14 | 0.530 | 0.542 | -1.2% |
Frank Gore was an easy answer here. Garrison Hearst, Ricky Watters, and Charlie Garner were excellent in their primes with the team, but couldn’t come close to matching Gore in the longevity department. Roger Craig was a great player, but he only led the team in rushing yards in 60% of his games. Joe Perry was the franchise’s first great running back, and his ’48 and ’49 seasons are not included in this metric. He also shared the backfield with some fine players, as Perry was one some of the greatest rushing teams in history.
But let’s not gloss over Gore, who led his team in rushing yards more often than Tomlinson led the Chargers in rushing yards! Emmitt Smith in Dallas, Walter Payton in Chicago, Barry Sanders in Detroit, Tony Dorsett in Dallas, Franco Harris in Pittsburgh, Thurman Thomas in Buffalo, and Frank Gore in San Francisco are the only players since 1950 to lead their team in rushing yards in 130+ games.
Rusher | First Yr | Last Yr | Leading Rusher | Total Games | % |
---|---|---|---|---|---|
Frank Gore | 2005 | 2014 | 130 | 156 | 83% |
Roger Craig | 1983 | 1990 | 82 | 137 | 60% |
Ken Willard | 1965 | 1973 | 61 | 129 | 47% |
Garrison Hearst | 1997 | 2003 | 58 | 79 | 73% |
Joe Perry | 1948 | 1963 | 53 | 161 | 33% |
Ricky Watters | 1992 | 1994 | 43 | 50 | 86% |
J.D. Smith | 1956 | 1964 | 42 | 98 | 43% |
Kevan Barlow | 2001 | 2005 | 36 | 75 | 48% |
Wendell Tyler | 1983 | 1986 | 36 | 54 | 67% |
Hugh McElhenny | 1952 | 1960 | 35 | 98 | 36% |
Carlos Hyde | 2014 | 2017 | 29 | 50 | 58% |
Charlie Garner | 1999 | 2000 | 26 | 32 | 81% |
Delvin Williams | 1974 | 1977 | 25 | 54 | 46% |
Vic Washington | 1971 | 1973 | 22 | 43 | 51% |
Wilbur Jackson | 1974 | 1979 | 19 | 72 | 26% |
Larry Schreiber | 1971 | 1975 | 18 | 63 | 29% |
Derek Loville | 1994 | 1996 | 18 | 48 | 38% |
Paul Hofer | 1976 | 1981 | 17 | 77 | 22% |
Terry Kirby | 1996 | 1998 | 16 | 45 | 36% |
Colin Kaepernick | 2011 | 2016 | 15 | 75 | 20% |
Earl Cooper | 1980 | 1985 | 14 | 96 | 15% |
Doug Cunningham | 1967 | 1973 | 12 | 86 | 14% |
Dexter Carter | 1990 | 1996 | 11 | 99 | 11% |
Gary Lewis | 1964 | 1969 | 11 | 72 | 15% |
Matt Breida | 2017 | 2018 | 10 | 30 | 33% |
O.J. Simpson | 1978 | 1979 | 10 | 23 | 43% |
John David Crow | 1965 | 1968 | 10 | 56 | 18% |
Finally, let’s close with a snoozer. Jerry Rice led the 49ers in receiving yards in 151 games! The rest of the top 10: Steve Largent in Seattle in 106 games, Tim Brown, Oakland, 105; Andre Johnson, Houston, 103; Larry Fitzgerald, Arizona, 103; Steve Smith, Carolina, 102; Michael Irvin, Dallas, 102; Jimmy Smith, Jacksonville, 97, Andre Reed, Buffalo, 96; and Marvin Harrison, Indianapolis, 92.
His peak was the best ever. His longevity was the best ever. He’s the best ever.
Receiver | First Yr | Last Yr | Leading Receiver | Total Games | % |
---|---|---|---|---|---|
Jerry Rice | 1985 | 2000 | 151 | 261 | 58% |
Terrell Owens | 1996 | 2003 | 63 | 130 | 48% |
Gene Washington | 1969 | 1977 | 58 | 129 | 45% |
Billy Wilson | 1951 | 1960 | 44 | 104 | 42% |
Dwight Clark | 1979 | 1987 | 43 | 143 | 30% |
Freddie Solomon | 1978 | 1985 | 33 | 123 | 27% |
Michael Crabtree | 2009 | 2014 | 32 | 87 | 37% |
Vernon Davis | 2006 | 2015 | 32 | 147 | 22% |
Bernie Casey | 1961 | 1966 | 26 | 79 | 33% |
Anquan Boldin | 2013 | 2015 | 25 | 49 | 51% |
Dave Parks | 1964 | 1967 | 22 | 50 | 44% |
R.C. Owens | 1957 | 1961 | 21 | 63 | 33% |
Gordie Soltau | 1950 | 1958 | 20 | 108 | 19% |
Ted Kwalick | 1969 | 1974 | 18 | 88 | 20% |
John Taylor | 1987 | 1995 | 17 | 138 | 12% |
Roger Craig | 1983 | 1990 | 16 | 137 | 12% |
Brent Jones | 1987 | 1997 | 15 | 164 | 9% |
Brandon Lloyd | 2003 | 2014 | 14 | 59 | 24% |
Frank Gore | 2005 | 2014 | 14 | 156 | 9% |
Arnaz Battle | 2003 | 2009 | 12 | 88 | 14% |
J.J. Stokes | 1995 | 2002 | 12 | 119 | 10% |
Clyde Conner | 1956 | 1963 | 11 | 81 | 14% |
George Kittle | 2017 | 2018 | 11 | 31 | 35% |
Hugh McElhenny | 1952 | 1960 | 11 | 98 | 11% |
Monty Stickles | 1960 | 1967 | 10 | 102 | 10% |
Dick Witcher | 1966 | 1973 | 10 | 114 | 9% |
Paul Hofer | 1976 | 1981 | 10 | 77 | 13% |
That’s it for the 49ers version of this series. Please leave your thoughts in the comments.