In this series, I will be looking at the history of coaches, quarterbacks, rushers, and receivers for all 32 franchises. For coaches and quarterbacks, I will be looking at how much their franchise’s career records (regular season only) would change if we removed the games with that person. For rushers and receivers, I will note how many times that player was the team’s leading rusher/receiver over the course of their time with that franchise (regular plus postseason).
Previous Teams:
AFC East: Dolphins, Bills, Jets, and Patriots
NFC East: Cowboys, Eagles, Giants, and Redskins
AFC North: Steelers, Browns, Ravens, and Bengals
NFC North: Packers, Vikings, Bears, and Lions
AFC South: Jaguars, Colts, Texans, and Titans
NFC South: Panthers, Falcons, Saints, and Buccaneers
AFC West: Raiders
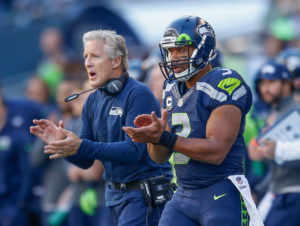
As hard as it might be to believe, the 2019 season will be the 10th season for the team under Pete Carroll, who goes down as the best coach in franchise history. Carroll already has the most wins of any Seahawks coach, but there are three other head coaches who lost more games with Seattle! Carroll owns the best winning percentage, at 0.622, and has guided over the most successful era in franchise history, culminating in the team’s lone Super Bowl trophy. The former USC coaching legend has improved Seattle’s all-time record by 3.0%, but even more than that, he’s left an indelible mark on the franchise. In fact, he may well go down as the second-most impactful person in Seahawks history.
Ovr Rk | Coach | G | W | L | T | HC Win % | FrG | FrW | FL | FrT | Fr W% | Win% w/o HC | Diff |
---|---|---|---|---|---|---|---|---|---|---|---|---|---|
16 | Pete Carroll | 144 | 89 | 54 | 1 | 0.622 | 676 | 344 | 331 | 1 | 0.51 | 0.479 | 3% |
51 | Chuck Knox | 143 | 80 | 63 | 0 | 0.559 | 676 | 344 | 331 | 1 | 0.51 | 0.496 | 1.3% |
69 | Mike Holmgren | 160 | 86 | 74 | 0 | 0.538 | 676 | 344 | 331 | 1 | 0.51 | 0.501 | 0.9% |
166 | Mike McCormack | 7 | 4 | 3 | 0 | 0.571 | 676 | 344 | 331 | 1 | 0.51 | 0.509 | 0.1% |
304 | Dennis Erickson | 64 | 31 | 33 | 0 | 0.484 | 676 | 344 | 331 | 1 | 0.51 | 0.512 | -0.3% |
374 | Jim Mora | 16 | 5 | 11 | 0 | 0.313 | 676 | 344 | 331 | 1 | 0.51 | 0.514 | -0.5% |
501 | Tom Flores | 48 | 14 | 34 | 0 | 0.292 | 676 | 344 | 331 | 1 | 0.51 | 0.526 | -1.7% |
507 | Jack Patera | 94 | 35 | 59 | 0 | 0.372 | 676 | 344 | 331 | 1 | 0.51 | 0.532 | -2.2% |
Dave Krieg went 70-49 with the Seahawks in the ’80s and early ’90s, and ranks second on this list. You might have expected failed #2 overall pick Rick Mirer to be the bottom quarterback on here — he went 20-31 as the Seahawks starter — but he didn’t play in enough games to do that. Jim Zorn quarterbacked the expansion Seahawks, and while he was a solid starter, a 40-60 record dooms him to the bottom of this list. Without those games, the Seahawks would have a 0.529 all-time winning percentage.
Ovr Rk | QB | G | W | L | T | QB Win % | FrG | FrW | FL | FrT | Fr W% | Win% w/o QB | Diff |
---|---|---|---|---|---|---|---|---|---|---|---|---|---|
10 | Russell Wilson | 112 | 75 | 36 | 1 | 0.674 | 676 | 344 | 331 | 1 | 0.510 | 0.477 | 3.3% |
38 | Dave Krieg | 119 | 70 | 49 | 0 | 0.588 | 676 | 344 | 331 | 1 | 0.510 | 0.493 | 1.7% |
117 | Matt Hasselbeck | 131 | 69 | 62 | 0 | 0.527 | 676 | 344 | 331 | 1 | 0.510 | 0.506 | 0.4% |
155 | Trent Dilfer | 12 | 8 | 4 | 0 | 0.667 | 676 | 344 | 331 | 1 | 0.510 | 0.507 | 0.3% |
200 | Jon Kitna | 33 | 18 | 15 | 0 | 0.545 | 676 | 344 | 331 | 1 | 0.510 | 0.508 | 0.2% |
289 | Glenn Foley | 1 | 1 | 0 | 0 | 1.000 | 676 | 344 | 331 | 1 | 0.510 | 0.509 | 0.1% |
310 | John Friesz | 11 | 6 | 5 | 0 | 0.545 | 676 | 344 | 331 | 1 | 0.510 | 0.509 | 0.1% |
435 | Bruce Mathison | 2 | 1 | 1 | 0 | 0.500 | 676 | 344 | 331 | 1 | 0.510 | 0.510 | 0% |
471 | Tarvaris Jackson | 14 | 7 | 7 | 0 | 0.500 | 676 | 344 | 331 | 1 | 0.510 | 0.510 | 0% |
680 | Charlie Frye | 1 | 0 | 1 | 0 | 0.000 | 676 | 344 | 331 | 1 | 0.510 | 0.510 | -0.1% |
687 | Dan McGwire | 5 | 2 | 3 | 0 | 0.400 | 676 | 344 | 331 | 1 | 0.510 | 0.510 | -0.1% |
697 | Jeff Kemp | 7 | 3 | 4 | 0 | 0.429 | 676 | 344 | 331 | 1 | 0.510 | 0.510 | -0.1% |
849 | Gale Gilbert | 2 | 0 | 2 | 0 | 0.000 | 676 | 344 | 331 | 1 | 0.510 | 0.511 | -0.2% |
861 | Steve Myer | 4 | 1 | 3 | 0 | 0.250 | 676 | 344 | 331 | 1 | 0.510 | 0.511 | -0.2% |
862 | Charlie Whitehurst | 4 | 1 | 3 | 0 | 0.250 | 676 | 344 | 331 | 1 | 0.510 | 0.511 | -0.2% |
919 | Warren Moon | 24 | 11 | 13 | 0 | 0.458 | 676 | 344 | 331 | 1 | 0.510 | 0.512 | -0.2% |
1040 | Brock Huard | 4 | 0 | 4 | 0 | 0.000 | 676 | 344 | 331 | 1 | 0.510 | 0.513 | -0.3% |
1050 | Seneca Wallace | 14 | 5 | 9 | 0 | 0.357 | 676 | 344 | 331 | 1 | 0.510 | 0.513 | -0.3% |
1117 | Kelly Stouffer | 16 | 5 | 11 | 0 | 0.313 | 676 | 344 | 331 | 1 | 0.510 | 0.514 | -0.5% |
1131 | Stan Gelbaugh | 9 | 1 | 8 | 0 | 0.111 | 676 | 344 | 331 | 1 | 0.510 | 0.515 | -0.5% |
1196 | Rick Mirer | 51 | 20 | 31 | 0 | 0.392 | 676 | 344 | 331 | 1 | 0.510 | 0.519 | -1% |
1214 | Jim Zorn | 100 | 40 | 60 | 0 | 0.400 | 676 | 344 | 331 | 1 | 0.510 | 0.529 | -1.9% |
Running back has been a very good position for the Seahawks. Shaun Alexander, Marshawn Lynch, and Ricky Watters are all borderline Hall of Famers, Chris Warren was a fantasy stud in ’94 and ’95, and Curt Warner made three Pro Bowls and averaged over 100 yards from scrimmage per game during one stretch in the ’80s. Oh, and don’t forget about Wilson, who once led Seattle in rushing yards over an entire season; he has led the team in rushing yards in 20 games. Still, when it comes to this list, Alexander leads the way by a good bit thanks in part to his longevity with the team. Playing behind a pair of Hall of Fame talents on the left side of the line, Alexander owns four of the top 10 rushing seasons in franchise history, along with the top three seasons (and five of the top eight) in rushing touchdowns.
Rusher | First Yr | Last Yr | Leading Rusher | Total Games | % |
---|---|---|---|---|---|
Shaun Alexander | 2000 | 2007 | 103 | 128 | 80% |
Curt Warner | 1983 | 1989 | 78 | 97 | 80% |
Chris Warren | 1990 | 1997 | 74 | 123 | 60% |
Marshawn Lynch | 2010 | 2015 | 73 | 93 | 78% |
Ricky Watters | 1998 | 2001 | 51 | 54 | 94% |
John Williams | 1986 | 1993 | 40 | 125 | 32% |
Sherman Smith | 1976 | 1982 | 39 | 82 | 48% |
Maurice Morris | 2002 | 2008 | 21 | 110 | 19% |
Russell Wilson | 2012 | 2018 | 20 | 125 | 16% |
Julius Jones | 2008 | 2010 | 17 | 31 | 55% |
Dan Doornink | 1979 | 1985 | 15 | 97 | 15% |
Thomas Rawls | 2015 | 2017 | 14 | 36 | 39% |
Chris Carson | 2017 | 2018 | 14 | 19 | 74% |
Lamar Smith | 1994 | 1997 | 12 | 42 | 29% |
Justin Forsett | 2008 | 2011 | 12 | 61 | 20% |
Jim Jodat | 1980 | 1981 | 10 | 28 | 36% |
Christine Michael | 2013 | 2016 | 10 | 28 | 36% |
Theotis Brown | 1981 | 1983 | 10 | 22 | 45% |
Until Wilson — and if you squint, maybe even including him — Steve Largent had a stranglehold on the title of best player in franchise history (Walter Jones enthusiasts, aside). The Hall of Fame wide receiver was the rare first ballot entry, and is (and will be for the foreseeable future) one of the last three men to ever rank #1 in career receiving yards. Largent led Seattle in receiving yards in a whopping 106 games, the most of any player not named Rice. There are 10 men who have caught 100 touchdown passes in their career, and of that group it’s Largent — not Moss, Owens, or Rice — who has the highest career yards per reception (16.0) average. He ranks 6th in career fantasy value by wide receivers, and he did it without great quarterback play.
Receiver | First Yr | Last Yr | Leading Receiver | Total Games | % |
---|---|---|---|---|---|
Steve Largent | 1976 | 1989 | 106 | 207 | 51% |
Brian Blades | 1988 | 1998 | 51 | 157 | 32% |
Darrell Jackson | 2000 | 2006 | 48 | 103 | 47% |
Doug Baldwin | 2011 | 2018 | 48 | 136 | 35% |
Joey Galloway | 1995 | 1999 | 34 | 72 | 47% |
Bobby Engram | 2001 | 2008 | 29 | 118 | 25% |
John Williams | 1986 | 1993 | 24 | 125 | 19% |
Koren Robinson | 2001 | 2008 | 22 | 71 | 31% |
Tyler Lockett | 2015 | 2018 | 18 | 66 | 27% |
Sam McCullum | 1976 | 1981 | 17 | 91 | 19% |
Sean Dawkins | 1999 | 2000 | 14 | 33 | 42% |
Tommy Kane | 1988 | 1992 | 14 | 57 | 25% |
Mike Pritchard | 1996 | 1999 | 14 | 63 | 22% |
Deion Branch | 2006 | 2010 | 12 | 54 | 22% |
Jermaine Kearse | 2012 | 2016 | 12 | 81 | 15% |
Golden Tate | 2010 | 2013 | 11 | 65 | 17% |
Sidney Rice | 2011 | 2013 | 10 | 35 | 29% |
That’s it for the Seahawks version of this series. Please leave your thoughts in the comments.