≡ Menu

Rob Gronkowski, Tom Brady, and WOWY Stats

Tis better to be with Gronk than without.

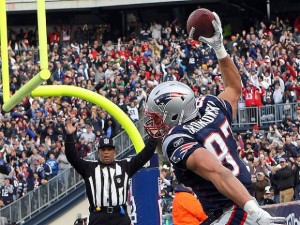
Rob Gronkowski played for the New England Patriots from 2010 to 2018. It was one of the wildest and most celebrated rides in NFL history. But today I want to build on the great work done by Adam Harstad and analyze Gronk’s career through the lens of how Tom Brady fared — with and without Gronk. [1]As always, thanks to Adam for the inspiration and much of the methodology behind this post. For defining what is included in my data set, please jump to the end of this post to see how Gronk games and non-Gronk games are defined.

I am going to not going to spend much time discussing Gronk’s first and last seasons, for two reasons. In 2010, rookie Gronk was not yet Gronk(TM); he also didn’t miss any games. And 2018 Gronk was BrokenGronk; outside of 2010 and 2018, he was pretty much always a dominant force when healthy.

So let’s focus on the prime 7 years of Gronk’s career. In 2011, 2014, and 2015, Gronkowski was almost always healthy. There was only one missed game of note there, and it was one where Brady and the entire Patriots team struggled. [2]Technically there was a second missed game, but it was a week 17 game where Gronkowski sat out to rest and Brady only played a half. In those three seasons, Gronkowski was a unanimous first-team All-Pro selection each season among major voting publications.

So, for WOWY purposes — that is, With Or Without You — the seasons we have to analyze for Gronkowski and Brady are 2012, 2013, 2016, and 2017. And the results are staggering in each year.

2012

The Patriots had 10 Gronk games and 8 non-Gronk games this season, which ended in a loss without Gronk to the Ravens in the AFC Championship Game. The stats:

  • In the Gronk games, New England had a 0.700 winning percentage, averaged 35.8 (!) points per game, picked up 28.4 first downs and 16.4 passing first downs per game, and the passing offense averaged 7.73 Adjusted Net Yards per Attempt (ANY/A).
  • In the non-Gronk games, New England had a 0.750 winning percentage, averaged 31.6 points per game, picked up 26.5 first downs and 15.8 passing first downs per game, and averaged 6.84 ANY/A.

Notably, that’s a difference of 4.2 points per game and 0.89 ANY/A per game without Gronk. And while the record was slightly worse, it’s worth noting that the three losses came by a combined four points.

2013

The Patriots had 7 Gronk games and 11 non-Gronk games this season, which ended in a loss without Gronk in the AFCCG to the Broncos.  The stats:

  • In the Gronk games, New England had a 0.714 winning percentage, averaged 32.0 points per game (and allowed 27.1 PPG), picked up 26.6 first downs and 16.3 passing first downs per game, and averaged 6.98 ANY/A.
  • In the non-Gronk games, New England had a 0.727 winning percentage, averaged 25.4 points per game (and allowed 17.8 PPG), picked up 21.3 first downs and 12.3 passing first downs per game, and averaged 5.64 ANY/A.

The offense nearly fell apart without Gronk, dropping 6.6 points per game and gaining 5.3 fewer first downs.  The passing offense declined by 1.34 ANY/A. And while I presume this is mostly (all?) due to randomess, this begins a trend of New England allowing significantly fewer points in non-Gronk games. Which is just weird.

2016

The Patriots had 5 Gronk games and 10 non-Gronk games this season — which was perhaps Brady’s best season outside of ’07.  New England won the Super Bowl without Gronkowski.  The stats:

  • In the Gronk games, the Patriots posted a 4-1 record [3]With Gronk unable to haul in the game-tying touchdown catch, or the victim of pass interference, depending on your perspective., averaged 32.0 points per game (and allowed 20.4 PPG), picked up 23.6 first downs and 13.8 passing first downs, and had a ridiculous 9.93 ANY/A average.
  • In the non-Gronk games, the Patriots went 1o-0, averaged 30.4 points per game (and allowed 14.8 PPG), picked up 24.0 first downs and 14.9 passing first downs, and averaged 7.67 ANY/A.

It’s hard to argue with 10-0, and the team gained more first downs without Gronk… but the record was driven in large part by that defense, too.  The Patriots averaged 1.6 more points per game with Gronk and 2.26 ANY/A per game with Gronk.  In the 5 Gronk games, Brady’s stat line was just ridiculous, and the offense scored 20 touchdowns and had just 18 punts and one interception. That was, of course, an unsustainable pace, but it just highlights how dominant Brady and Gronk were in ’16; in the 10 non-Gronk games, the offense had 34 touchdowns and 47 punts. In these 5 games, Gronkowski caught 24 passes for 19 first downs, 529 yards and 3 touchdowns.

2017

The Patriots had 16 Gronk games and 3 non-Gronk games this season, which ended with a loss in the Super Bowl to the Eagles (but don’t blame the Patriots passing attack or Gronkowski, who had 116 yards and 2 touchdowns). The stats:

  • In the Gronk games, the Patriots had a 0.813 winning percentage, averaged 30.4 points per game, picked up 25.8 first downs and 15.7 passing first downs, and averaged 8.22 ANY/A.
  • In the non-Gronk games, the Patriots went 2-1, averaged 21.0 points per game, picked up 19.7 first downs and 13.3 passing first downs, and averaged 5.81 ANY/A.

That sounds like a huge drop — 9.4 points per game and 2.42 ANY/A — but the sample size is small.  Brady played poorly in the two regular season non-Gronk games, an upset loss to Miami and a narrow win over Tampa Bay.   Those were two of his worst games of the season, which probably wasn’t just a coincidence. I don’t want to make much out of a 3-game sample size, but putting aside the magnitude, the direction is consistent with other years.

Gronk WOWY Stats

Here are the full stats for Brady and the Patriots offense in each season, in both Gronk games (top rows) and non-Gronk games (bottom rows).

What Is A Gronk Game and What is Not A Gronk Game?

Finally, let me explain how I identified what is a Gronk game and what is not a Gronk game. Let’s work in reverse order:

  • 2018: Gronk missed the games in weeks 8, 10, and 11 due to ankle and back injuries.  While he was not necessarily his former self, he played in at least 67% of the snaps in every other game this season.
  • 2017: Gronk missed 3 games here.  He missed a game on a short week against the Bucs due to a thigh injury, was suspended for the second Dolphins game, and suffered a concussion in the first half against the Jaguars in the AFC Championship Game.  He finished that game with just 1 target and 26 snaps, representing 41% of the team’s snaps.  I am counting this as NOT a Gronk game (which the Patriots won).  Note that in the regular season finale against the Jets, Gronk played most of the game (68% snaps) but functioned solely as a blocker: he did not record a single target. That still counts as a Gronk game, as it was more importantly for the Patriots offense, a Bryce Petty game.
  • 2016: Gronk missed the first two games of the season with a hamstring injury, and played just 11 snaps (blocking on 10 of them) in the week 3 game against Houston.  However, I am going to exclude all of the first four games of the 2016 season for New England, since Brady was suspended; those games are eliminated from this study and don’t count as a Gronk game or a non-Gronk game, since we are analyzing Brady’s WOWY stats. Then in week 12 against the Jets, Gronk suffered a season-ending back injury and played just 7 snaps. New England won, 22-17; this game is counting as NOT a Gronk game. So games 5 through 9 are the only Gronk games this year.
  • 2015: Gronkowski missed one game (against the Eagles) due to a knee injury.
  • 2014: Gronkowski began the year missing the preseason as he recovered from a torn ACL/MCL (more on this below); he wound up playing between 40 and 45% of the Patriots offensive snaps the first two weeks, where New England went 2-0.  I am counting these games as Gronk games (he had 17 combined targets), but just wanted to note the injury.  Gronkowski sat out the week 17 game, which would normally mean that’s a non-Gronk game.  But because the Patriots had clinched the #1 seed before the week 17 game and Brady only played for the first half, so I am excluding that game as a non-Gronk game, too.  That is the fifth and final game in this study I am eliminating entirely (along with the four suspension games for Brady).
  • 2013: Gronkowski suffered a season-ending knee injury on a hit by T.J. Ward early in the 3rd quarter of a week 14 game against the Browns.  Since Gronk played 49% of the snaps and made it into the third quarter, I will still count this as a Gronk game (as opposed to the Jaguars AFCCG).
  • 2012: Gronk broke his forearm late in a win over the Colts in week 11; that game counts as a Gronk game.  However, he barely played (31% of snaps) in his return, a tune-up, week 17 game to get ready for the playoffs, and then re-injured his arm seven snaps into the team’s first playoff game.  He would miss the rest of the season.  Both of those final two games are being counted as non-Gronk games. Therefore, the first 10 games of ’12 were Gronk games, and the last 8 games were non-Gronk games.
  • 2011: No missed games.
  • 2010: No missed games.

As always, please leave your thoughts in the comments.

References

References
1 As always, thanks to Adam for the inspiration and much of the methodology behind this post.
2 Technically there was a second missed game, but it was a week 17 game where Gronkowski sat out to rest and Brady only played a half.
3 With Gronk unable to haul in the game-tying touchdown catch, or the victim of pass interference, depending on your perspective.
{ 0 comments }

The Grand List, part 11

Hello, friends and enemies, and welcome to the eleventh installment of the Grand List, or: the top 1000 robust gentlemen ever to participate in gridiron activities. It’s been a while. With everything going on in the country over the past month, I haven’t found any joy thinking about something as trivial as football. Many use sports as an escape from the slings and arrows of the world, but I’ve never been able to do that. For me, football has always been more of a mirror than a door. When I began this project, my goal was to finish this series by the beginning of the 2020 regular season, and I still plan to make it – even if my heart isn’t really in it. I hope you enjoy reading it more than I enjoy writing it. [1]I was kind of banking on a long season postponement to help me out. Aside from jobs affected by it, in a pure abstract sense, I think it would be neat to have a one year break in action after the … Continue reading

Question for those reading along: what is the ideal number of entries in a single article? I’ve done as few as ten and as many as fifty. A small number would theoretically result in more frequent posting, while larger articles take more time but give you more to chew on. I don’t plan to write more than a paragraph for any single player, because a thousand is a big number, and I’m a lazy guy (and how many different ways can you say a tackle blocked well or a corner covered well?).

Previous articles in the series

The Grand List, part 1: Includes honorable/special mentions and players 1000-990.
The Grand List, part 2: Includes players 989-965.
The Grand List, part 3: Includes players 964-940.
The Grand List, part 4: Includes players 939-901.
The Grand List, part 5: Includes players 900-876.
The Grand List, part 6: Includes players 875-851.
The Grand List, part 7: Includes players 850-810.
The Grand List, part 8: Includes players 809-780.
The Grand List, part 9: Includes players 779-750.
The Grand List, part 10: Includes players 749-700.

Without further ado, let’s endeavor to find meaning in the meaningless. [continue reading…]

References

References
1 I was kind of banking on a long season postponement to help me out. Aside from jobs affected by it, in a pure abstract sense, I think it would be neat to have a one year break in action after the first hundred years of the league.
{ 0 comments }

Trading 2 First Round Picks For A Player

The Seahawks gave up how much for Adams?

There have been 8 trades in the 21st century where an NFL veteran was traded for two first round picks. [1]I understand that this is an arbitrary way to look at trading players. The Vikings received the 7th pick in the 2005 Draft for Randy Moss; that’s a more valuable draft haul than getting first … Continue reading Today I am going to analyze those trades.

In half of those cases — the older ones — the player was traded before the NFL Draft, which allowed the trading team to get some immediate draft picks. In the other half (which have all occurred in the last three years), the team trading away two first round picks wouldn’t lose any picks until the next season; presumably, that helped incentivize them to make the deal, as there is always a discount rate applied to trading future picks.

Let’s look at these 8 trades, from who gave up the least to who gave up the most. Note that I am only looking at draft value (or players, when included in the trade) sent over for the player; I am ignoring the contract part of the analysis, along with how good the player actually was. On to the list… [continue reading…]

References

References
1 I understand that this is an arbitrary way to look at trading players. The Vikings received the 7th pick in the 2005 Draft for Randy Moss; that’s a more valuable draft haul than getting first round picks in 2006 and 2007 from a team that’s expected to be very good. For purposes of this post, I will note players traded after the NFL Draft, and applying a discount (10% in the next season, 20% for two seasons away) when appropriate.
{ 0 comments }

Super Bowl Champions and Elite Safeties

In light of the Jets trading Jamal Adams to Seattle — more on this later — I wanted to take a look at the correlation between top level safety play and Super Bowl champions.

Hall of Fame Safeties and Super Bowl Champions (15)

There have been 15 Super Bowls won by safeties who would make the Hall of Fame. Six HOF safeties won two Super Bowls: Willie Wood with the Packers, Troy Polamalu with the Steelers, Steve Atwater with the Broncos, Ronnie Lott with the 49ers, Cliff Harris with the Cowboys, and Donnie Shell with the Steelers. In addition, Johnny Robinson won with the ’69 Chiefs, Rod Woodson won with the ’00 Ravens, and Ed Reed won with the ’12 Ravens.

Defensive Player of the Year and Super Bowl Champions (3)

In addition to Polamalu, Rod Woodson, and Ed Reed, Bob Sanders won a Super Bowl with the ’06 Colts and was the AP DPOY in ’07. Dick Anderson was the AP DPOY in ’73, and won Super Bowls with Miami in ’72 and ’73. Both players were huge parts of their team’s titles.

First-Team All-Pro and Super Bowl Champions (23 plus 7)

There have been even more safeties who, at one time in their career were first-team All-Pros and were starters on a Super Bowl champion. This includes all six Patriots teams — Lawyer Milloy in ’01, Rodney Harrison in ’03 and ’04, and Devin McCourty in ’14, ’16, and ’18. Dwight Hicks was an All-Pro with the 49ers during his prime and was a Pro Bowler on both the ’81 and ’84 teams. Darren Woodson is a near Hall of Famer who won two rings with the Cowboys. Mike Wagner was a very good safety who started for the ’74 and ’75 Steelers. And eleven other guys have won once.

That list is headed by likely HOFers in LeRoy Butler with the ’96 Packers, John Lynch with the ’02 Bucs, and Earl Thomas with the ’13 Seahawks… along with Darren Sharper (’09 Saints) who well, was a HOF-level player and a reprehensible person and rapist. Tyrann Mathieu (’19 Chiefs) may also one day have a Hall of Fame case, although it’s obviously early.

The rest of the list: Merton Hanks with the ’94 49ers, Malcolm Jenkins with the ’17 Eagles, Jim Hudson with the ’68 Jets, Gary Fencik with the ’85 Bears, Mark Murphy with the ’82 Washington Football Team, and Rick Volk with the ’70 Colts.

In addition, there are 7 Super Bowl champions who, in addition a blue chip safety, had another All-Pro safety. Jake Scott won two Super Bowls with Miami in ’72 and ’73 playing alongside Anderson, Mike Wagner started next to a HOFer in Shell on the ’78 Steelers, Charlie Waters and Cornell Green were All-Pro safeties who played next to Harris on the ’77 and ’71 Cowboys, respectively, Eugene Robinson started next to Butler on the ’96 Packers, and Tim McDonald was the other safety on the ’94 49ers.

The graph below shows the starting safeties for all 54 Super Bowl champions, and is color-coded to represent HOF/DPOY players, All-Pros, and 2nd-team All-Pros/Pro Bowlers.
[continue reading…]

{ 0 comments }

For the sake of argument, let’s just assume that there is no 2020 NFL season, or that a 2020 NFL season is cut extremely short after just a couple of games. How would the NFL go about preparing a 2021 Draft Order?

I have seen 3 main ideas floated around:

  • Just re-do last year’s draft order, which seems to me to be a bit unfair. It assumes that the teams that were bad in 2019 will also be bad in 2020.
  • A completely random draft order.  This has the advantage of being ex ante fair — there is no advantage to being the Jets or the Raiders or the Cowboys — but would be extremely unfair ex post: the team that gets the 32nd pick would be at a severe disadvantage to the team that gets the 1st pick.
    • Let’s say you and 31 friends came upon a bag containing $32,000.  It would be very simple and fair to split it $1K for each of you.  Now, you certainly could  engage in a winner-takes-all coin flip battle until there is one person who gets the full $32,000.  And that would be ex ante fair, as all of you would have the same chance of getting it.  But it wouldn’t feel fair after the fact.
    • This feels particularly important for the NFL, when you have a blue chip quarterback prospect.
  • Base the draft order on an average of each team’s record over the last 3 or 4 or 5 years.  This might feel fairer, but what does that have to say about how good these teams are now?  The Patriots would pick last under this scenario, and New England could turn into a below-average team in 2020.  The 49ers would have a top-8 pick.

What I would propose is a draft system that is ex post fair, or at least as fair as we can make it. In a world with no 2020 NFL or college football season, nobody can say with any confidence which teams will be the best in 2021. And you risk creating a lot of backlash among fans if a team lucks into the first overall pick. So the goal of a draft in this hypothetical should be to create an outcome that is relatively fair among all teams.

That sounds hard to do, but it is not impossible. Here is what I am thinking.

How 27 of the 32 teams would draft
Let’s ignore the top 5 picks in the Draft for now; five teams will get the first five picks, and we will deal with them later. Let’s look at the other 27 teams. What the NFL should do is give Team 1 the 6th pick in the first round, Team 2 the 7th pick, Team 3 the 8th pick, and so on, through the end of the first round…. and then go in reverse order for the second round, and keep that reverse order for the rest of the draft (which will be 8 rounds). So Team 1 would receive picks 6, 59 (the last pick in the second round), 86 (the last pick in the third round), 113, 140, 167, 194, and 221, while team 28 would have picks 32, 33, 60, 87, 114, 141, 168, and 195.

Now, is that fair? According to the traditional Jimmy Johnson chart, the teams with early picks would still do better, but not by much; and, in fact, teams at the end would tend to fare slightly better than teams in the middle. [continue reading…]

{ 0 comments }

Guest Post: QB Game Scores

Today’s guest post comes from one of the longest followers of this blog (and its predecessor), Richie Wohlers. Richie is an accountant from Southern California who is a Dolphins fan despite never being to Florida. As always, we thank our guest posters for contributing.


Inspired by Bill James’s Game Score for pitchers, I’ve been tracking something similar for quarterbacks.

This is just a simple way to look at box score stats for a quarterback to see who had the most statistically impressive games.  This is not taking things into account such as win probabilities, air yards, EPA, opponent quality, etc.  More importantly, there are no era adjustments, so this is biased in favor of modern players. That said, the goal was just to create a single number to back up the “awe” factor we may have seen while watching the game.

Methodology:

There are five components to my game score.  They are each weighted equally, though (as with passer rating) completion percentage ends up getting “double-counted” with yards per attempt.  The categories are: Total Yards, Touchdown Passes, Completion Percentage, Yards per Attempt and Interception Percentage.  Each category is worth 20 points, so a perfect game would be worth 100 points.

The threshold for each category is based on the best performance of all time.  Those thresholds are:

Yards: 554 (Norm Van Brocklin, 1951)

Touchdowns: 7 (6 times, most recently Drew Brees in 2015)

Completion Percentage (min 15 attempts): 96.7% (Drew Brees, 2019)

Yards/Attempt (min 15 attempts): 20.5 (Craig Morton, 1970)

Interception Percentage: Each percentage point deducts two points from a player’s score.  (Drew Brees is the highest-rated QB to throw an interception, when he threw for 511 yards, 7 TD and 2 Int in 2015.  It ranks as the 19th-best game.)

A player’s portion of those records is multiplied by 20.  So when Patrick Mahomes threw for 443 yards last season, that was worth ( 443 / 554 = 0.8 * 20 )  16 points.

The top 10 performances: [continue reading…]

{ 1 comment }

Let’s get it out of the way: playing with Tom Brady and Peyton Manning sure helps. From 2007 to 2013, Wes Welker had the best seven year stretch of his career, and most of that time came with Brady as his quarterback (there was one season with Matt Cassel and the 2013 record-breaking season with Manning). During those seven seasons, Welker’s teams averaged a remarkable 32.3 points per game. In 2014, Welker’s team — still the Broncos — also topped 30 points per game, but the other seasons of Welker’s career were spent on significantly less productive offenses.

Of course, in most of those other seasons, Welker himself wasn’t a significant part of the offense: he was a young backup or a past-his-prime player. I wanted to calculate how many points per game each wide receiver’s offense scored over his career. This is trickier than you’d think: what do you do for years where a player was a backup, or missed time due to injury? For Welker, he played 14 games with the 2004 Dolphins but as a returner and did not catch a pass. Would that team count in his career average?

To solve for these problems, I weighted each season by the percentage of career receiving yards he gained in that season.  Welker gained 9,924 receiving yards in his career.  In 2015 with the Rams, he gained 102 yards, or 1.0% of his career total.  That isn’t much, so the Rams production that year — 17.5 points per game, or 5.31 PPG below average — counts for 1.0% of Welker’s career score.  The 2013 Broncos averaged 37.88 PPG, 14.47 better per game than league average; since Welker gained 7.8% of his career yards that season, the 2013 Broncos stats count for 7.8% of his career total.  Welker’s best year was 2011, when he gained 1,569 yards.  That represented 15.8% of his career total, so the 2011 Patriots — 32.06 points per game, 9.88 points per game above league average — counts for 15.8% of Welker’s career grade.

If you perform this analysis for every season of Welker’s career, his team’s averaged 30.13 points per game once you weight for Welker’s production, which was 8.11 points per game above average. Here’s the math: the final two columns represent the product of multiplying his percentage of career receiving yards in that season by his team’s scoring (both raw and relative to league average): [continue reading…]

{ 0 comments }

The GWTD King.

Last week, I looked at which running backs and wide receivers have scored the most game-winning touchdowns. Today, I am reproducing the same analysis but for quarterbacks: who has thrown the most game-winning touchdowns?

As before, a touchdown qualifies as a game-winning touchdown if all of the following four criteria are met:

  • It occurs in the 4th quarter or in overtime;
  • The scoring team was not winning prior to the touchdown
  • The scoring team was winning after the touchdown, including the extra point [1]However, if a team was down by 7, scored a touchdown, went for two and converted, that touchdown does not count as a game-winning touchdown. So in this Cowboys/Giants game from 2018, Dallas was down … Continue reading; and
  • If the touchdown (plus point after) gave the winning team more points than the losing team scored all game. So if a team is down 21-17 and scores a touchdown to go ahead 24-21, and that team ultimately wins 31-27, that does not count as a game-winning touchdown. But if they win 31-21, it does.

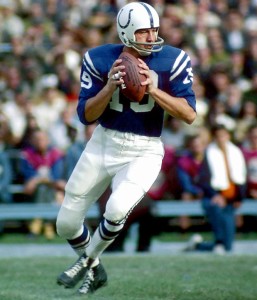
Got it? Great. I looked at all games, regular and postseason, in the NFL, AFL, and AAFC and counted all game-winning touchdowns by this metric. As it was back in 2013, Baltimore Colts legend Johnny Unitas remains the king. He had 23 game-winning touchdown passes and also ran for one more, giving him a record 24 game-winning touchdowns on his resume: [continue reading…]

References

References
1 However, if a team was down by 7, scored a touchdown, went for two and converted, that touchdown does not count as a game-winning touchdown. So in this Cowboys/Giants game from 2018, Dallas was down 35-28 with just over a minute to play when Dak Prescott threw a touchdown pass. After the play, the Cowboys went for 2 and converted, and won 36-35. But I am not crediting Prescott with a game-winning touchdown pass. Had Dallas been down 34-28 when Prescott threw his touchdown, he would receive credit for a game-winning touchdown pass assuming the Cowboys hit the ensuing extra point. Prescott in fact threw the game-winning 2-point conversion, but that is a separate category.
{ 0 comments }