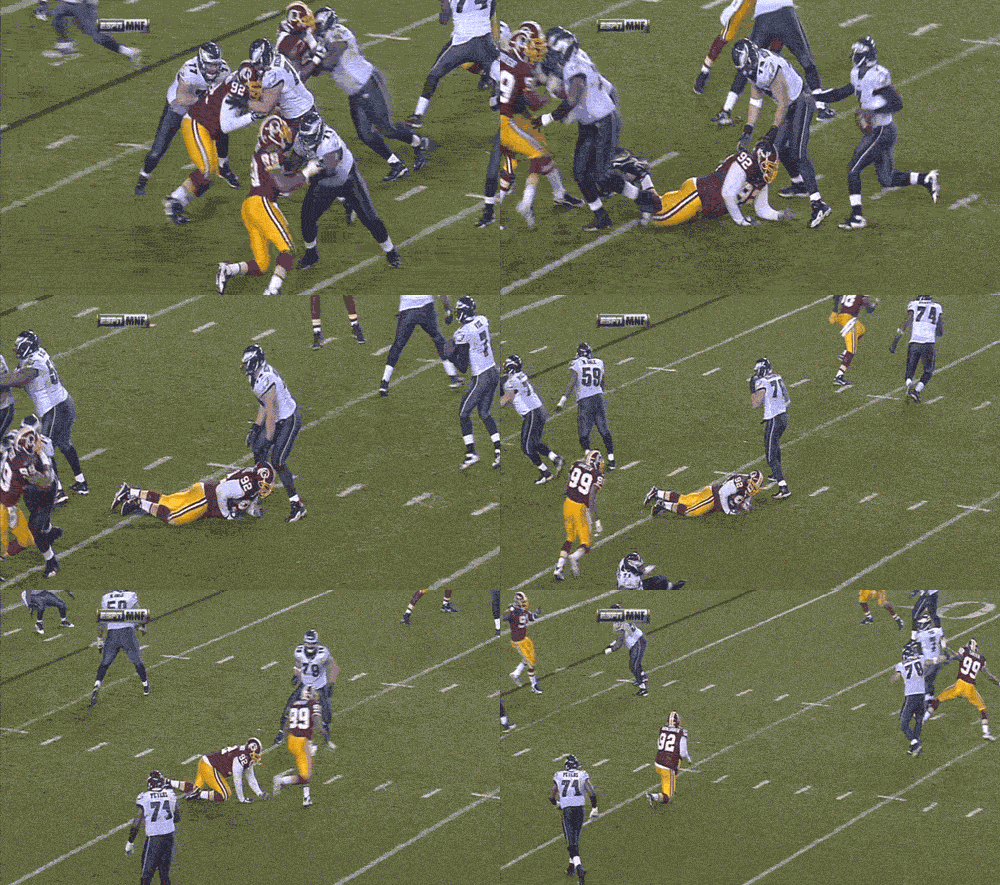
 Fatigue in the NFL is definitely real, and a team that’s tired is not a team that’s likely to excel. But I don’t know if it’s even possible to accurately measure the effect of fatigue in the NFL, and if it is, I certainly don’t know how to do it. Fatigue is a useful descriptive term but one hard to define. Is playing 3 games in 11 days likely to lead to a fatigued team? What about traveling west to east for a 1:00 game? How does that compare to being on the field for 10 minutes? And how does that compare to playing opposite a defense that’s gone 3 and out on three straight drives?
I don’t know. What I can do is look at the data we have from the last 12 years and see what general trends we can discern. So, are defenses worse off if they’ve been on the field for awhile?
There have been nearly 15,000 instances of teams having 1st and 10 near mid-field, defined as between the two 47 yard lines. On average, when teams gain possession in that area, they scored 2.2 points per drive. And, on average, those teams over the course of the season, averaged 1.75 points per drive over all drives.
So what happens if the “1st and 10 from the 47, 48, 49, 50, 49, 48, or 47” is the second play of the drive? Or the third? Or the 9th?
The 2.2 points per drive average when the situation occurs on the first play of the drive is the lowest in the group, although I don’t think that’s due to fatigue. Take a look:
The middle column shows how many points, on average, teams scored in that situation, while the far right column shows the quality of the offenses in general (not that it really matters in this case). If fatigue had an impact in this situation, you would see the teams that start at their own 20, take 6 or 7 plays, and then have 1st and 10 at midfield be very successful. But that’s not the case.
It’s not surprising that the teams whose first play is the 1st and 10 at midfield fare the worst here, as those are the teams that haven’t proven anything; all other teams at least got one first down on the drive. The gambler’s fallacy would be to assume (correctly) that it’s really difficult to string together a long, 15-play drive, so teams on the 8th play on 1st and 10 at the 50 are unlikely to keep the success going. To be honest, I am at least a little surprised to see no discernible difference in outcomes. I also limited the data to just drives in the final 25 minutes of the game, but the results were largely the same.
I then looked at teams who started drives with 10-15 minutes left in the game, tied or trailing by no more than 8 points, and with possession between the 20 and 29-yard lines. I used four inputs — score margin, yards from the end zone, offensive team rating (on the season) and the number of additional plays run by the offense compared to the opposing offense.
As you might guess, only one of those variables was statistically significant: offensive team rating. The “yards from the end zone” was the second closest, and came close to mirroring the results we would expect. The “number of plays run” differential variable, however, had a p-value of 0.40, and was practically insignificant, anyway (a weight of -0.01). I tried using simply number of plays run by the offense instead of the play differential, but that was even less useful as a predictor.
I also looked at situations where a team had already run 30+ more plays than its opponent and then started a new drive. Excluding drives late in games (where a team might not be focused on scoring), on average, these teams started the drive with the ball at their 37 and scored 1.94 points. Additionally, on average, these teams were also leading 23-9.
What does that tell us? In general, you would project a team to score around 1.4 points with the ball on 1st and 10 at the 37, so that would be a sign that perhaps fatigue was playing a factor. On the other hand, these teams were clearly the better teams in these games (and these teams were generally better than average offenses), so that would cut against the idea of fatigue being the driving factor. The counterbalancing force would be that teams leading by 14 points aren’t as concerned with scoring, so that could artificially depress the results.
Measuring fatigue isn’t particularly easy. As Justice Stewart might say, you know it when you see it. In this post I looked at three different ways of measuring fatigue, but I’m sure you guys have more thoughts. I figured I’d throw this out to the crowd and see what creative ways you guys have for measuring the effect of fatigue.
