≡ Menu

In Part I, we learned that there is a correlation between 40-yard dash times and wide receiver success in the NFL. Today, I want to look at a third variable: NFL Draft status.

My sample once again comprises the 853 wide receivers who ran the 40-yard dash at the NFL combine from 2000 to 2017. All data is publicly available from PFR, via Stathead Football. If you think there was a strong correlation between 40-yard dash time and NFL production, wait until you see the correlation between 40-yard dash time and draft status.

In the table below, the average draft value represents the FP draft value associated with each pick. A higher number means more draft value — i.e., an earlier pick — was used to select those players. [continue reading…]

{ 0 comments }

2021 Draft Order: Miami Has Hacked The Process

The NFL Draft is supposed to help promote parity in the league. By giving the teams with the worst records the best draft picks, all teams are pushed to regress towards the mean over time. The Jaguars and Jets were the worst two teams in the 2020 NFL season, and they have the first two picks in the 2021 NFL Draft, giving those organizations a chance to land franchise-altering quarterbacks.

But the third pick belongs to the Miami Dolphins, as the last bit of compensation in the Laremy Tunsil trade. Miami is the rare team that was both good last year and has a ton of draft capital, which could set the team up for long-term success.

Yesterday, the NFL released the final order for the entire 2021 NFL Draft. Using both the traditional, Jimmy Johnson draft chart and the Football Perspective Draft Value Chart, below is how much draft capital each organization has, from most to least. [continue reading…]

{ 0 comments }

Moore displays how many top seasons in a row he has had.

In 2019, Carolina wide receiver D.J. Moore gained 1,175 receiving yards; in 2020 he caught 66 passes for 1,193 yards. Strong seasons, to be sure, but probably not too noteworthy in your head. For instance, over the last two seasons, there have been 15 players who had more than 1,193 receiving yards in either 2019 or 2020.

But among that group, tight end Travis Kelce is the only one who did it in both years. In fact, Moore is the only wide receiver to hit 1,175 yards in both seasons. Drop the threshold to 1,165 yards, and DeAndre Hopkins also joins the group. Drop down to 1,130, and then Stefon Diggs and Allen Robinson also make the cut (as does another tight end, Darren Waller). But no matter: if one is playing a game of trivia, D.J. Moore is the answer to the question: which wide receiver topped the highest threshold of receiving yards in each of the past two season?

That’s funky, of course, and a misleading way of implying that Moore might be the best receiver in the NFL. In addition to Kelce, four wide receivers (Diggs, Hopkins, Robinson, and Davante Adams) gained more receiving yards than Moore and a few others (Michael Thomas, Julio Jones, Chris Godwin, Calvin Ridley, and Tyreek Hill) also have averaged more receiving yards per game than Moore. [1]Allen Robinson actually averaged fewer yards per game; Moore played 15 game both years, while Robinson did not miss a game. But misleading stats can also make for fun trivia, so this made me wonder: who are the other D.J. Moore all stars in NFL history?

For example, Michael Thomas crossed the highest threshold in both 2018 and 2019, as he was the only player to top 1,400 yards both seasons. In 2017 and 2018, DeAndre Hopkins had over 1,375 receiving yards both years. In fact, 2019 and 2020 was the first time since the strike-impacted seasons of 1987 and 1988 that no wide receiver topped 1,200 yards both seasons.

The table below shows the leading wide receiver in each pair of seasons since the merger, from the perspective of crossing a certain minimum threshold. [continue reading…]

References

References
1 Allen Robinson actually averaged fewer yards per game; Moore played 15 game both years, while Robinson did not miss a game.
{ 0 comments }

The 2020 Atlanta Falcons starting offensive linemen were all former first round picks. Atlanta drafted right guard Chris Lindstrom and right tackle Kaleb McGary in the first round of the 2019 Draft, five years after using the 6th overall pick on Texas A&M left tackle Jake Matthews. In 2016, Atlanta signed center Alex Mack, the 21st pick in the 2009 Draft, away from the Browns to a monster deal; he’s been the center of the team’s offensive line ever since. And in the 2019 offseason, the left guard spot was pugged by James Carpenter, who had been a first round pick out of Alabama and then played four seasons each with the Seahawks and Jets.

It should go without saying that that is a lot of highly drafted offensive linemen for one team, even if Atlanta only drafted three of the players. [1]The Falcons also had five first round picks on offense outside of the offensive line: the Falcons drafted QB Matt Ryan, WR Julio Jones, and WR Calvin Ridley in the first round, too, and added former … Continue reading Let’s compare them to the Green Bay Packers, who had arguably the best offensive line in the NFL and trotted out the following starting five:

The Packers had one of the least heralded group of offensive linemen in the league — at least from a draft perspective (in other news, the entire left side of the line made the Pro Bowl). How does that compare to the rest of the NFL? [continue reading…]

References

References
1 The Falcons also had five first round picks on offense outside of the offensive line: the Falcons drafted QB Matt Ryan, WR Julio Jones, and WR Calvin Ridley in the first round, too, and added former first round picks at RB (Todd Gurley) and TE (Hayden Hurst) in the 2020 offseason. Slot receiver Russell Gage, a sixth round pick out of LSU, was the 11th starter, and presumably teased mercilessly in the huddle.
{ 0 comments }

Over at FiveThirtyEight, Josh Hermsmeyer recently wrote about wide receivers and 40-yard dash times. Using yards per route run as his measure of productivity, Josh concluded “that higher speed isn’t associated with higher on-field production.” Today I want to take a deep dive into the question of how much 40-yard dash times are correlated with wide receiver success. For a very long time, people have argued that 40-yard dash times are overrated (actually, for a very long time, people have argued that just about everything is overrated). But such a comment is paper thin, because it’s unclear exactly how “rated” 40-yard dash times are, anyway. So let’s skip the overrated/underrated analysis and dive into the data.

My sample comprises the 853 wide receivers who ran the 40-yard dash at the NFL combine from 2000 to 2017. [1]Why those years? PFR’s data only goes back to 2000, and players who participated at the combine more recently than 2017 have not yet accrued four NFL seasons. All data is publicly available from PFR, via Stathead Football. I then looked at how many receiving yards those players gained in their first four seasons in the NFL. [2]Chosen because this represents the average length of a rookie contract. The question of what metric to use to measure production is a complicated one: receiving yards is not perfect (and I will revisit this decision at the end of the article), but it should work well enough for these purposes.

On average, these 853 players ran the 40-yard dash in 4.51 seconds and gained a total of 678 receiving yards in their first four seasons; this includes the 360 of them who never gained a receiving yard in the NFL. The top three wide receivers by receiving yards over this period [3]This analysis, of course, excludes players who were not invited to the combine like Tyreek Hill and Josh Gordon, undrafted players like Victor Cruz, Robby Anderson, and Doug Baldwin, and players who … Continue reading were Michael Thomas, A.J. Green, and Anquan Boldin, who ran the 40-yard dash in 4.57, 4.48, and 4.72 seconds, respectively. Strike one for 40-yard dash times mattering. The fastest two players were John Ross and Donte’ Stallworth, who both ran the 40 in 4.22 seconds. [4]That might sound like strike two, but Stallworth was tied for the 61st most receiving yards out of this group if 853 receivers. It’s a strike for 40-yard dash time being the only thing that … Continue reading

But anecdotes can only take us so far when we have 853 players, from Ross and Stallworth on the far left, to Thomas up at the top, all the way to Mississippi State’s De’Runnya Wilson, who never played in the NFL and ran the 40 in 4.85 seconds. [continue reading…]

References

References
1 Why those years? PFR’s data only goes back to 2000, and players who participated at the combine more recently than 2017 have not yet accrued four NFL seasons.
2 Chosen because this represents the average length of a rookie contract.
3 This analysis, of course, excludes players who were not invited to the combine like Tyreek Hill and Josh Gordon, undrafted players like Victor Cruz, Robby Anderson, and Doug Baldwin, and players who skipped the combine like Corey Davis.
4 That might sound like strike two, but Stallworth was tied for the 61st most receiving yards out of this group if 853 receivers. It’s a strike for 40-yard dash time being the only thing that matters, but not for 40-yard dash time having any value.
{ 16 comments }

On Monday, I looked at which receivers were the most productive on a per-team pass attempt basis. This is one good way to measure wide receiver production, but it is far from perfect.

Players on teams with bad quarterbacks will be harmed, as are players who are “competing” with really good receivers on their offense will be boosted. The two guys I’m really thinking of are Terry McLaurin (who ranked 23rd in ACY/TPA on Monday) and Allen Robinson (19th), two wide receivers we know are very good but had very poor quarterback play. [1]An interesting scenario is in Carolina, where the quarterback play was below average but D.J. Moore and Robby Anderson had to compete with each other.

So today I want to look at which receivers gained the largest share of their team’s receiving pie, measured simply as receiving yards in the games they played. Davante Adams led all players in percentage of team receiving yards, at 37.2%, and he did it while playing for the best passing offense in football. It is extremely rare for a wide receiver to both play for an incredible passing offense and have an insanely large share of the pie: it is one reason why Adams had one of the great seasons in receiving history in 2020.

Beyond Adams, who were the most impressive receivers in 2020? There might be some trade-off between being on a great offense and being on a bad one; all things being equal, it’s easier for Robinson or McLaurin to gobble up targets than say, someone in Tampa Bay or Kansas City’s offense. One way I like to measure receivers is to look at both the quality of the pie — i.e., how good was their passing game — and how big of a slice each receiver gobbled up. Getting a good-size pie on a great passing offense, a large chunk of a good passing game, and a huge chunk of a bad passing game are all about equally impressive if you think that players “compete” with their teammates for targets.

In the graph below, I’ve shown the percentage of the team receiving yards each receiver had in 2020 (limited only to the games they played) on the X-Axis, and their team’s passing efficiency (as measured by ANY/A) on the Y-Axis. I’ve also labeled some notable players who stood out. [continue reading…]

References

References
1 An interesting scenario is in Carolina, where the quarterback play was below average but D.J. Moore and Robby Anderson had to compete with each other.
{ 0 comments }

Top Receivers in 2020 Per Team Pass Attempt

Nobody could stop Adams in 2020.

Davante Adams was the best wide receiver in the NFL in 2020, and by a very large margin. Unless you want to assign a heavy penalty on him for playing with the MVP quarterback, Adams had otherworldly numbers. He played in just 14 games, but still gained 1,374 yards, 73 first downs, and caught 18 touchdowns. This came in just 461 pass attempts during those 14 games, making that even more impressive.

When measuring receiver performance, it’s important to recognize that some wide receivers play on pass-heavy teams while some play on run-heavy teams. Targets are often mistakenly viewed as a measure of opportunity, when really targets are a form of production; a player who gets a target on a play is doing something positive. The best measure of opportunity is routes run, and team pass attempts serves as a good proxy for that.

Let’s skip Adams, who again blows away the field. Let’s instead look at Titans wide receiver A.J. Brown, who is often the lead horse for the great efficiency numbers that Ryan Tannehill has produced since joining the Titans. Brown missed two games this year, but in those 14 games, he gained 1,075 receiving yards, 55 first downs and 11 touchdowns. Most impressively, this came with only 424 pass attempts (excluding sacks) in those games. Brown picked up a first down on 13% of all Titans pass attempts in the games he played, the fourth-best mark in the NFL; he caught a touchdown on 2.6% of all Tennessee pass plays during those 14 games, the third-highest mark in the league. A receiver can only produce on passing plays, and Brown was a huge reason for the Titans success last year.

For each receiver last year, I calculated how many Adjusted Catch Yards they gained, which is simply receiving yards with a 9-yard bonus for each first down and a 20-yard bonus for each touchdown. [1]Without duplication, so a touchdown only gets 11 additional yards, since each touchdown is always a first down. For Brown, that means he gained 1691 adjusted catch yards; in the 14 games he played, he averaged 3.99 ACY per team pass attempt, the second-best rate in the NFL. Here are the top 100 receivers by this metric: [continue reading…]

References

References
1 Without duplication, so a touchdown only gets 11 additional yards, since each touchdown is always a first down.
{ 0 comments }

On paper, the Buccaneers added a lot of big names in the offseason. Tom Brady and Rob Gronkowski from the Patriots, a former top-5 pick at running back in Leonard Fournette, and an All-Pro wide receiver in Antonio Brown. Tampa Bay also hit home runs with its first two draft picks, offensive tackle Tristan Wirfs and cornerback Antoine Winfield Jr..

But the Buccaneers did not have a particularly large amount of turnover compared to recent Super Bowl champions. In fact, by one measure, each of the five previous Super Bowl champions had bigger turnover than Tampa Bay. Other than Brady, most of the big names didn’t have a big impact for Tampa Bay, at least until the Super Bowl. Leonard Fournette had just 367 rushing yards during the regular season; Brown had just 483 receiving yards in 8 games; Gronk averaged 39 yards per game, the lowest mark in his career other than during his rookie season (in ’19, O.J. Howard averaged 33 yards per game for Tampa Bay). Of course, in Super Bowl LV it was a different story: our lasting image of the 2020 Bucs will be Gronkowski scoring 2 touchdowns, Brown catching a touchdown, and Fournette picking up 135 total yards and a touchdown.

How do we compare one team to its squad from the prior year? Great question! It’s tricky: we want to compare not just roster turnover, but the value of those players. The Chiefs added both Brady and LeSean McCoy, but that should not count as equal moves. Similarly, you have to look at how the player was used in the prior season. For example, Kurt Warner was on both the ’98 Rams and the ’99 Rams, but it would be poor analysis to say that the ’99 Rams had the same quarterback as they did the prior year.

Really we want to look at two things: how much was the player a part of the Super Bowl team (to avoid overemphasizing the McCoys of the world) and for players on the team, how much was that player a part of the team the prior year (to avoid the Warner problem). To measure how valuable a player was, I am going to use PFR’s AV, which does as good a job as any other metric to compare the value of players across positions and eras. For each player on each Super Bowl team, I will measure how much AV they produced as a percentage of the team’s total AV. I will also do that the year before, and then take the lower of those two values.

Let’s use a few examples. The 2020 Buccaneers had 243 points of AV, and Brady had 15 of them; therefore, he was responsible for about 6% of the team’s value. He was not on the team in 2019, of course, so Brady gets a 0 when we calculate how much of the 2019 Bucs were on the 2020 Bucs. That’s a big deal, because there is only 94% of the AV left to allocate. McCoy had just 1 point of AV, or 0.4% of the team’s AV; he also gets a zero since he wasn’t on Tampa Bay in 2019, but that has a much smaller impact. Donovan Smith had about 4% of the AV on the 2019 Bucs and 4% of the AV on the 2020 Bucs; therefore, taking the minimum doesn’t change things; he gets assigned 4%.

If we do this for every player on the 2020 roster, and take the minimum value between the percentage of AV they had for the ’20 Bucs and the percentage of AV they had for the ’19 Bucs, and then sum the results, we get a value of 60%. This may not mean a ton to you in the abstract — it wouldn’t be quite right to say that 40% of the roster turned over — but it is very helpful if we are comparing teams. [continue reading…]

{ 0 comments }

Guest Post: Quarterback Performance vs. Playoff Wins

Adam Steele is back for another guest post. You can view all of Adam’s posts here. As always, we thank him for contributing.


With the 2020 NFL playoffs having just concluded, now seems like a great time to tackle a question I’ve had for years: How strongly does quarterback performance correlate with team success in the postseason?

First, we need to measure quarterback performance. I graded each playoff start on a 0-4 scale, with zero being terrible and four being dominant. I chose this because it matches the academic GPA scale we’re all familiar with. The grade is based on performance while adjusting for era, opponent, weather, and other contextual factors.

Now you may be wondering why I don’t just use stats to grade games. Well, for the tiny sample of a single game stats can be very misleading, especially given the opponent and weather extremes we tend to see in the playoffs. I also prefer a rough instrument for this study so parsing all games into five buckets is ideal.

I included all quarterbacks with six or more playoff starts, giving us a sample of 69 players and 745 graded games. We’ll look at individual quarterbacks later, but for now let’s evaluate the big picture: [continue reading…]

{ 0 comments }

In the modern NFL, the passing game — and the passing offense — is king.  With completion percentages, passing yards, and passing touchdowns continuing to hit all-time highs, and interceptions reaching all-time lows, it’s easy to only focus on each team’s passing game.  But you may have missed not one, but two of the greatest defensive record-breaking seasons of all time.

The NFL record by a defensive player for interceptions in a season is 14, set by Dick “Night Train” Lane in 1952.   A bad faith argument sometimes notes how remarkable it was that Lane did that in a 12-game season, ignoring the fact that interceptions were more than three times more likely per pass attempt back in the early ’50s.  And while pass attempts are going up, because the interception rate has dropped so significantly, the amount of interceptions in each game has significantly decreased over time:

[continue reading…]

{ 1 comment }

Clyde Edwards-Helaire has had a really good 13 months. He’s gone 13-1 as a starter for the 2020 Chiefs, including a win in the AFC Championship Game. This is a nice continuation of his time at LSU, where Edwards-Helaire went 15-0 as the leading rusher for the Tigers. Since January 1, 2019, Edwards-Helaire has gone 29-1 in his 30 games.

CEH is on the verge of winning the national championship and the Super Bowl in back to back seasons, a pretty rare feat. There have been 14 players to win a national championship and an NFL championship in back to back seasons. [1]The NFL qualifier excludes two other seasons. In 1947, when Frank Kosikowski was on Notre Dame’s back-to-back champions in 1946 and 1947; as a rookie, he played in the AAFC with the Cleveland … Continue reading [continue reading…]

References

References
1 The NFL qualifier excludes two other seasons. In 1947, when Frank Kosikowski was on Notre Dame’s back-to-back champions in 1946 and 1947; as a rookie, he played in the AAFC with the Cleveland Browns, who also won the the championship. In 1961, end Tommy Brooker was a key member of the undefeated Crimson Tide team. In 1962, he was drafted by the Dallas Texans (now the Chiefs), and he played both end and kicker for the team. In fact, he kicked the game-winning field goal in overtime to capture the AFL title that season.
{ 0 comments }

Leading Rusher For Each Super Bowl Team

The 2014 Patriots were not very reliant on the ground team. Jonas Gray led the team in rushing yards with just 412 in 8 games, while Shane Vereen was second with 391 over the full season. Stevan Ridley had 340 in 6 games, while LeGarrette Blount had 281 in five appearances. Even as a team, New England only ranked 18th in rushing yards. And while Blount ran all over the Colts (30/148/3) in the AFC Championship Game, he was held to just 40 yards on 14 carries in the Super Bowl, which still managed to lead the team.

Among the now 110 teams to make the Super Bowl, the 2014 Patriots rank last when it comes to rushing yards gained by their leading rusher. The 1998 Broncos, of course, rank first: Terrell Davis rushed for 2,008 yards that season. The graph below shows the rushing yards (pro-rated to 16 game seasons for years with shorter schedules) for the leading rusher on each Super Bowl team: the winners are shown in black, the losers in green, and the Bucs and Chiefs are shown in team colors. [continue reading…]

{ 0 comments }

In 1959, John Unitas led the NFL in pass attempts, completions, passing yards, and passing touchdowns en route to a unanimous MVP award.  In addition, his Baltimore Colts repeated as NFL champions, capping off a brilliant season for the legendary quarterback.

Two years later, in the early days of the AFL, George Blanda was the league’s MVP as he threw for 3,330 yards (no other player had 2,700 yards) and 36 touchdowns (no other quarterback had even 20). Teaming with Bill Groman and Charley Hennigan, Houston had a dominant offense and won the AFL Championship.

But since then — which would include the entirety of the Super Bowl era — no quarterback has won the Super Bowl in the same season where he led the league in passing yards.  A similar but slightly different criteria yields a different result.  Team passing yards, as opposed to individual passing yards, has two major differences: sack yards are deducted at the team but not the individual level, and of course situations where a quarterback does not play a full season will have a much smaller impact on the team level. [continue reading…]

{ 0 comments }

How the Chiefs and Buccaneers Got To Super Bowl LV

The Chiefs have three superstars leading their dominant offense: TE Travis Kelce was drafted in 2013, WR Tyreek Hill was drafted in 2016, and QB Patrick Mahomes was drafted in 2017. Kansas City’s top three defensive stars — nose tackle Chris Jones, safety Tyrann Mathieu, and edge rusher Frank Clark — were added three different ways.  Jones was second round pick in 2016, Clark was acquired via trade in 2019, and Mathieu was a free agent pickup in 2019.

That 2019 year was a big offseason for Kansas City.  Sure, the team was the #1 seed in 2018, hosted the AFC Championship Game, and only lost in overtime to the eventual Super Bowl champions, but that team was a bit different from this version. Six likely starters in Super Bowl LV — Mathieu, Clark, WR Mecole Hardman, ILB Damien Wilson, G Nick Allegretti, and CB Bashaud Breeland — were added in the 2019 offseason. [continue reading…]

{ 0 comments }

The 101-Year History of Black Quarterbacks in the NFL

Fritz Pollard, the first African American coach and quarterback in the NFL.

Back in 2008, I wrote a four part series detailing the history of the black quarterback.

Six years ago, I updated that article, just as I did last year. Today, in honor of black history month, let’s revisit the history of black quarterbacks in the NFL. And while for the last 53 of those seasons, at least one black quarterback was in the NFL, the roles and treatment of black quarterbacks have varied greatly throughout the Super Bowl era.

The history of black quarterbacks in professional football is complicated. The New York Giants did not have a black quarterback throw a pass until 2007, when Anthony Wright became the first to do so; 10 years later, Geno Smith became the first and only black quarterback to start a game for the Giants, the last team to finally start a black player at quarterback. But as far back as 1920, Frederick Douglass “Fritz” Pollard was the tailback of the Akron Pros; a year later, he was promoted to player/coach, and became the first black head coach in NFL history. Pollard helped the Pros win the championship in the NFL’s inaugural season. [1]At the time, the NFL went by the name the American Professional Football Association. It was not known as the NFL until 1922. The Pros ran the single-wing, and Pollard was the player lined up behind the center who received the snaps. At the time the forward pass was practically outlawed, so Pollard barely resembles the modern quarterback outside of the fact that he threw a few touchdown passes during his career. [2]In addition to his NFL exploits, Pollard also achieved a great deal of fame for leading Brown to back-to-back road wins over the powerhouse schools of the time, Yale and Harvard, in 1916. He would … Continue reading And, of course, it was a time of significant discrimination: Pollard and end Bobby Marshall were the first two black players in professional football history.

As told by Sean Lahman, at least one African American played in the NFL in every year from 1920 to 1933; while there were several notable black players, Pollard was the only one [3]Well, maybe we can include single-wing tailback Joe Lillard, too.  In 1933, he had more than twice as many passing yards and rushing yards as any of his Cardinals teammates. He would then leave the … Continue reading resembling a quarterback. [4]It wasn’t just African Americans that had full access during this era: Jim Thorpe coached and starred in a team composed entirely of Native Americans called the Oorang Indians in 1922 and 1923. Beginning in 1934, that there was an informal ban on black athletes largely championed by Washington Redskins owner George Marshall. It wasn’t until 1946 that black players were re-admitted to the world of professional football, when UCLA’s Kenny Washington [5]Who occupied the same backfield with the Bruins as Jackie Robinson. and Woody Strode were signed by the Los Angeles Rams; in the AAFC, Bill Willis and Marion Motley were signed by Paul Brown’s Cleveland Browns that same season.
[continue reading…]

References

References
1 At the time, the NFL went by the name the American Professional Football Association. It was not known as the NFL until 1922.
2 In addition to his NFL exploits, Pollard also achieved a great deal of fame for leading Brown to back-to-back road wins over the powerhouse schools of the time, Yale and Harvard, in 1916. He would become the first African American to be named an All-American and the prior season, he lead Brown to the Rose Bowl.
3 Well, maybe we can include single-wing tailback Joe Lillard, too.  In 1933, he had more than twice as many passing yards and rushing yards as any of his Cardinals teammates. He would then leave the NFL after the racial ban to go pitch in the Negro Leagues.
4 It wasn’t just African Americans that had full access during this era: Jim Thorpe coached and starred in a team composed entirely of Native Americans called the Oorang Indians in 1922 and 1923.
5 Who occupied the same backfield with the Bruins as Jackie Robinson.
{ 1 comment }

Los Angeles Makes Another Blockbuster Jared Goff Trade

It was just under 5 years ago that the Rams made a blockbuster trade to acquire the number one overall pick to select Jared Goff. As a reminder, in April 2016, the Rams traded:

the 15th overall selection (WR Corey Coleman), the 43rd [1]Which had been acquired when the Rams traded Sam Bradford to the Eagles. pick (Austin Johnson), the 45th selection (Derrick Henry), and a third round pick (#76, Shon Coleman), plus next year’s first round pick (which turned into the 5th overall pick and Corey Davis) and third round picks (#100, Jonnu Smith)

to Tennessee for

the first overall pick (Goff), and two later round picks in the 2016 Draft (#113-Nick Kwiatkoski, #177-Temarrick Hemingway)

At the time, the Rams probably didn’t think they would be sending the 5th overall pick in 2017, but that’s one of the risks of trading away a future first round pick.  And how did it work out for Los Angeles?  It’s tough to say.  Goff certainly didn’t live up to expectations: the Rams are explicitly telling the world that Goff is not good enough by trading him and a lot of draft capital to Detroit for Matthew Stafford.  On the other hand, not only did Goff have a lot of success with the Rams, but there is some irony in what wound up happening.  The concern in sending a lot of draft capital to move up to draft a quarterback is that you wind up in Jetsland, where New York sent a ton of capital for Sam Darnold and then never could build a team around him.  The Rams didn’t get the franchise quarterback they wanted, but wound up building a great team around Goff despite the lack of draft capital.  One could argue that Los Angeles is one of the top-5 talented teams in the NFL, if you remove the quarterback from the equation.

And that is the gamble Los Angeles is making this weekend.  The Rams just sent Goff, along with the team’s first round picks in both 2022 and 2023 and the 88th pick in the 2021 Draft to Detroit for Matthew Stafford.  And it’s very interesting what the trade says about not just how the Rams, but the entire NFL, view Goff.

Valuing future picks is always challenging because we have to include the time value discount associated with those picks plus the uncertainty of knowing exactly where they will fall in the draft. [2]The Texans have twice traded away top-5 draft picks in recent years without knowing it.  This trade is particularly difficult to analyze because it’s initially unclear whether Goff is an asset (a talented, former number one overall quarterback in his prime) or a liability (a quarterback viewed as significantly overpaid with a contract that is going to cost Detroit $54M in cap dollars over the next two years, unless they cut him, in which case he would cost $44M over the next two years).

What do the Lions want to do? If they are looking to tear down the roster and rebuild, Goff may not have a lot of value — and they could look to trade him or cut him in the next 12 months.  That would mean he is viewed as a liability, and the Rams actually paid less than they would have for Stafford if they didn’t make Detroit take Goff.  On the other hand, are we to assume that no team would have traded for Goff with his existing contract?  If even one team (the Colts? Steelers?) would have offered the Rams something, then there would have been no reason to bundle him in this deal.  But perhaps his contract really was an albatross: we will only find out once we see what the Lions do with him.  As it turns out, we can get a pretty good sense of whether Goff is an asset or a liability by analyzing the rest of the trade.  More on that in a moment.

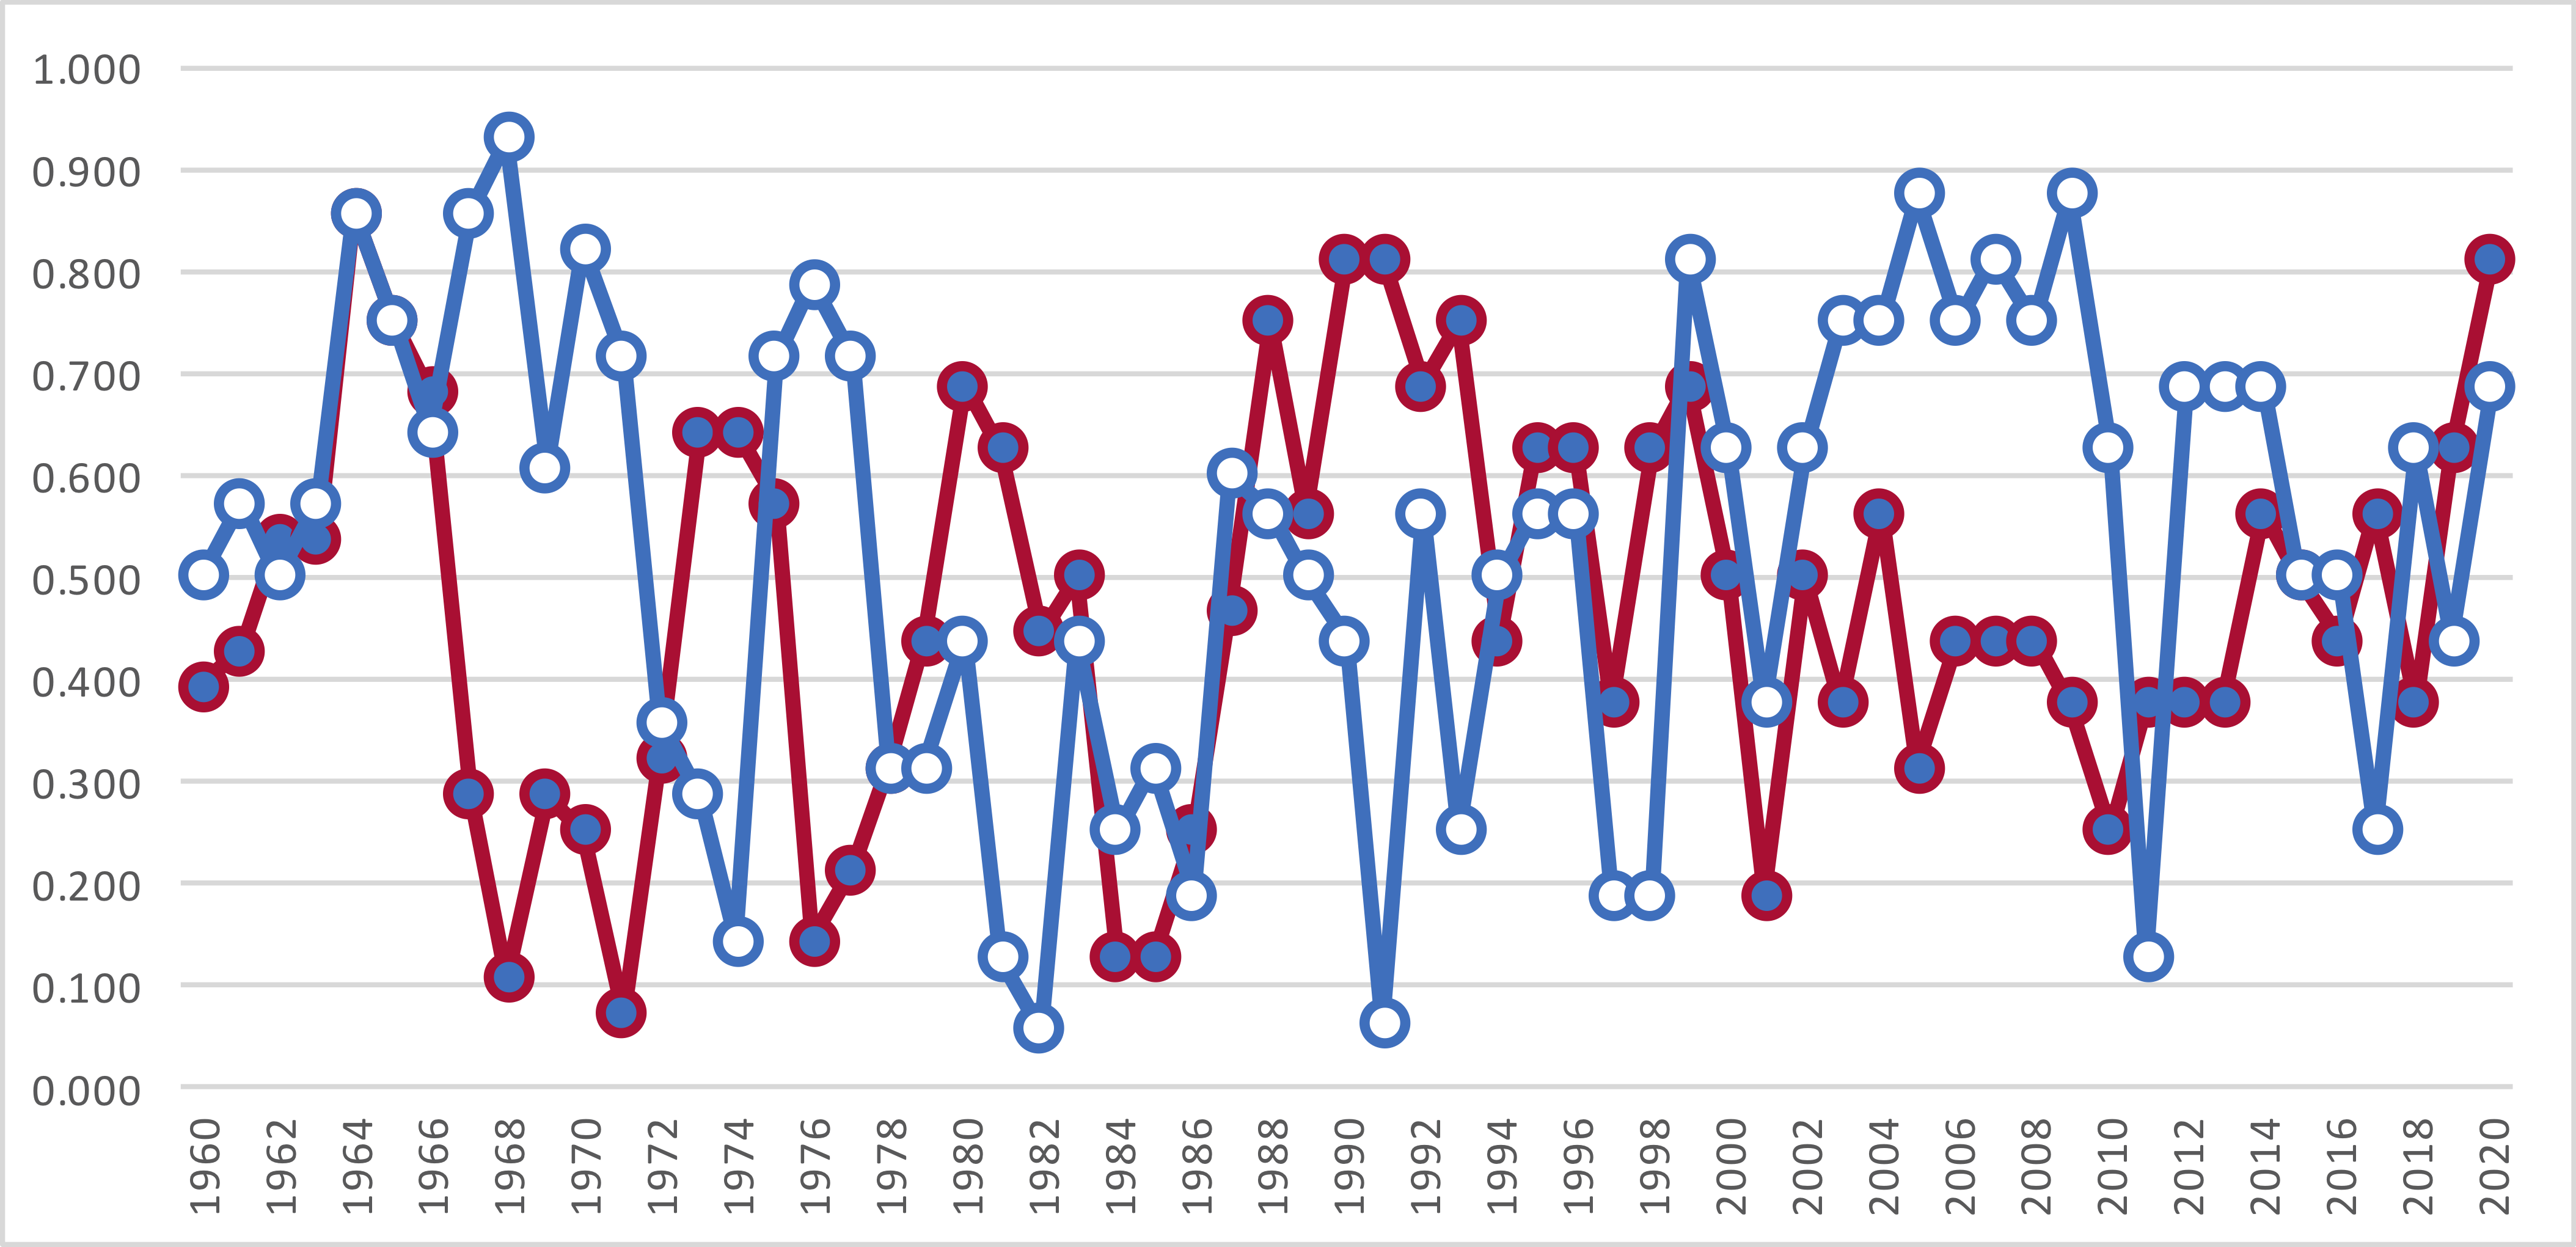
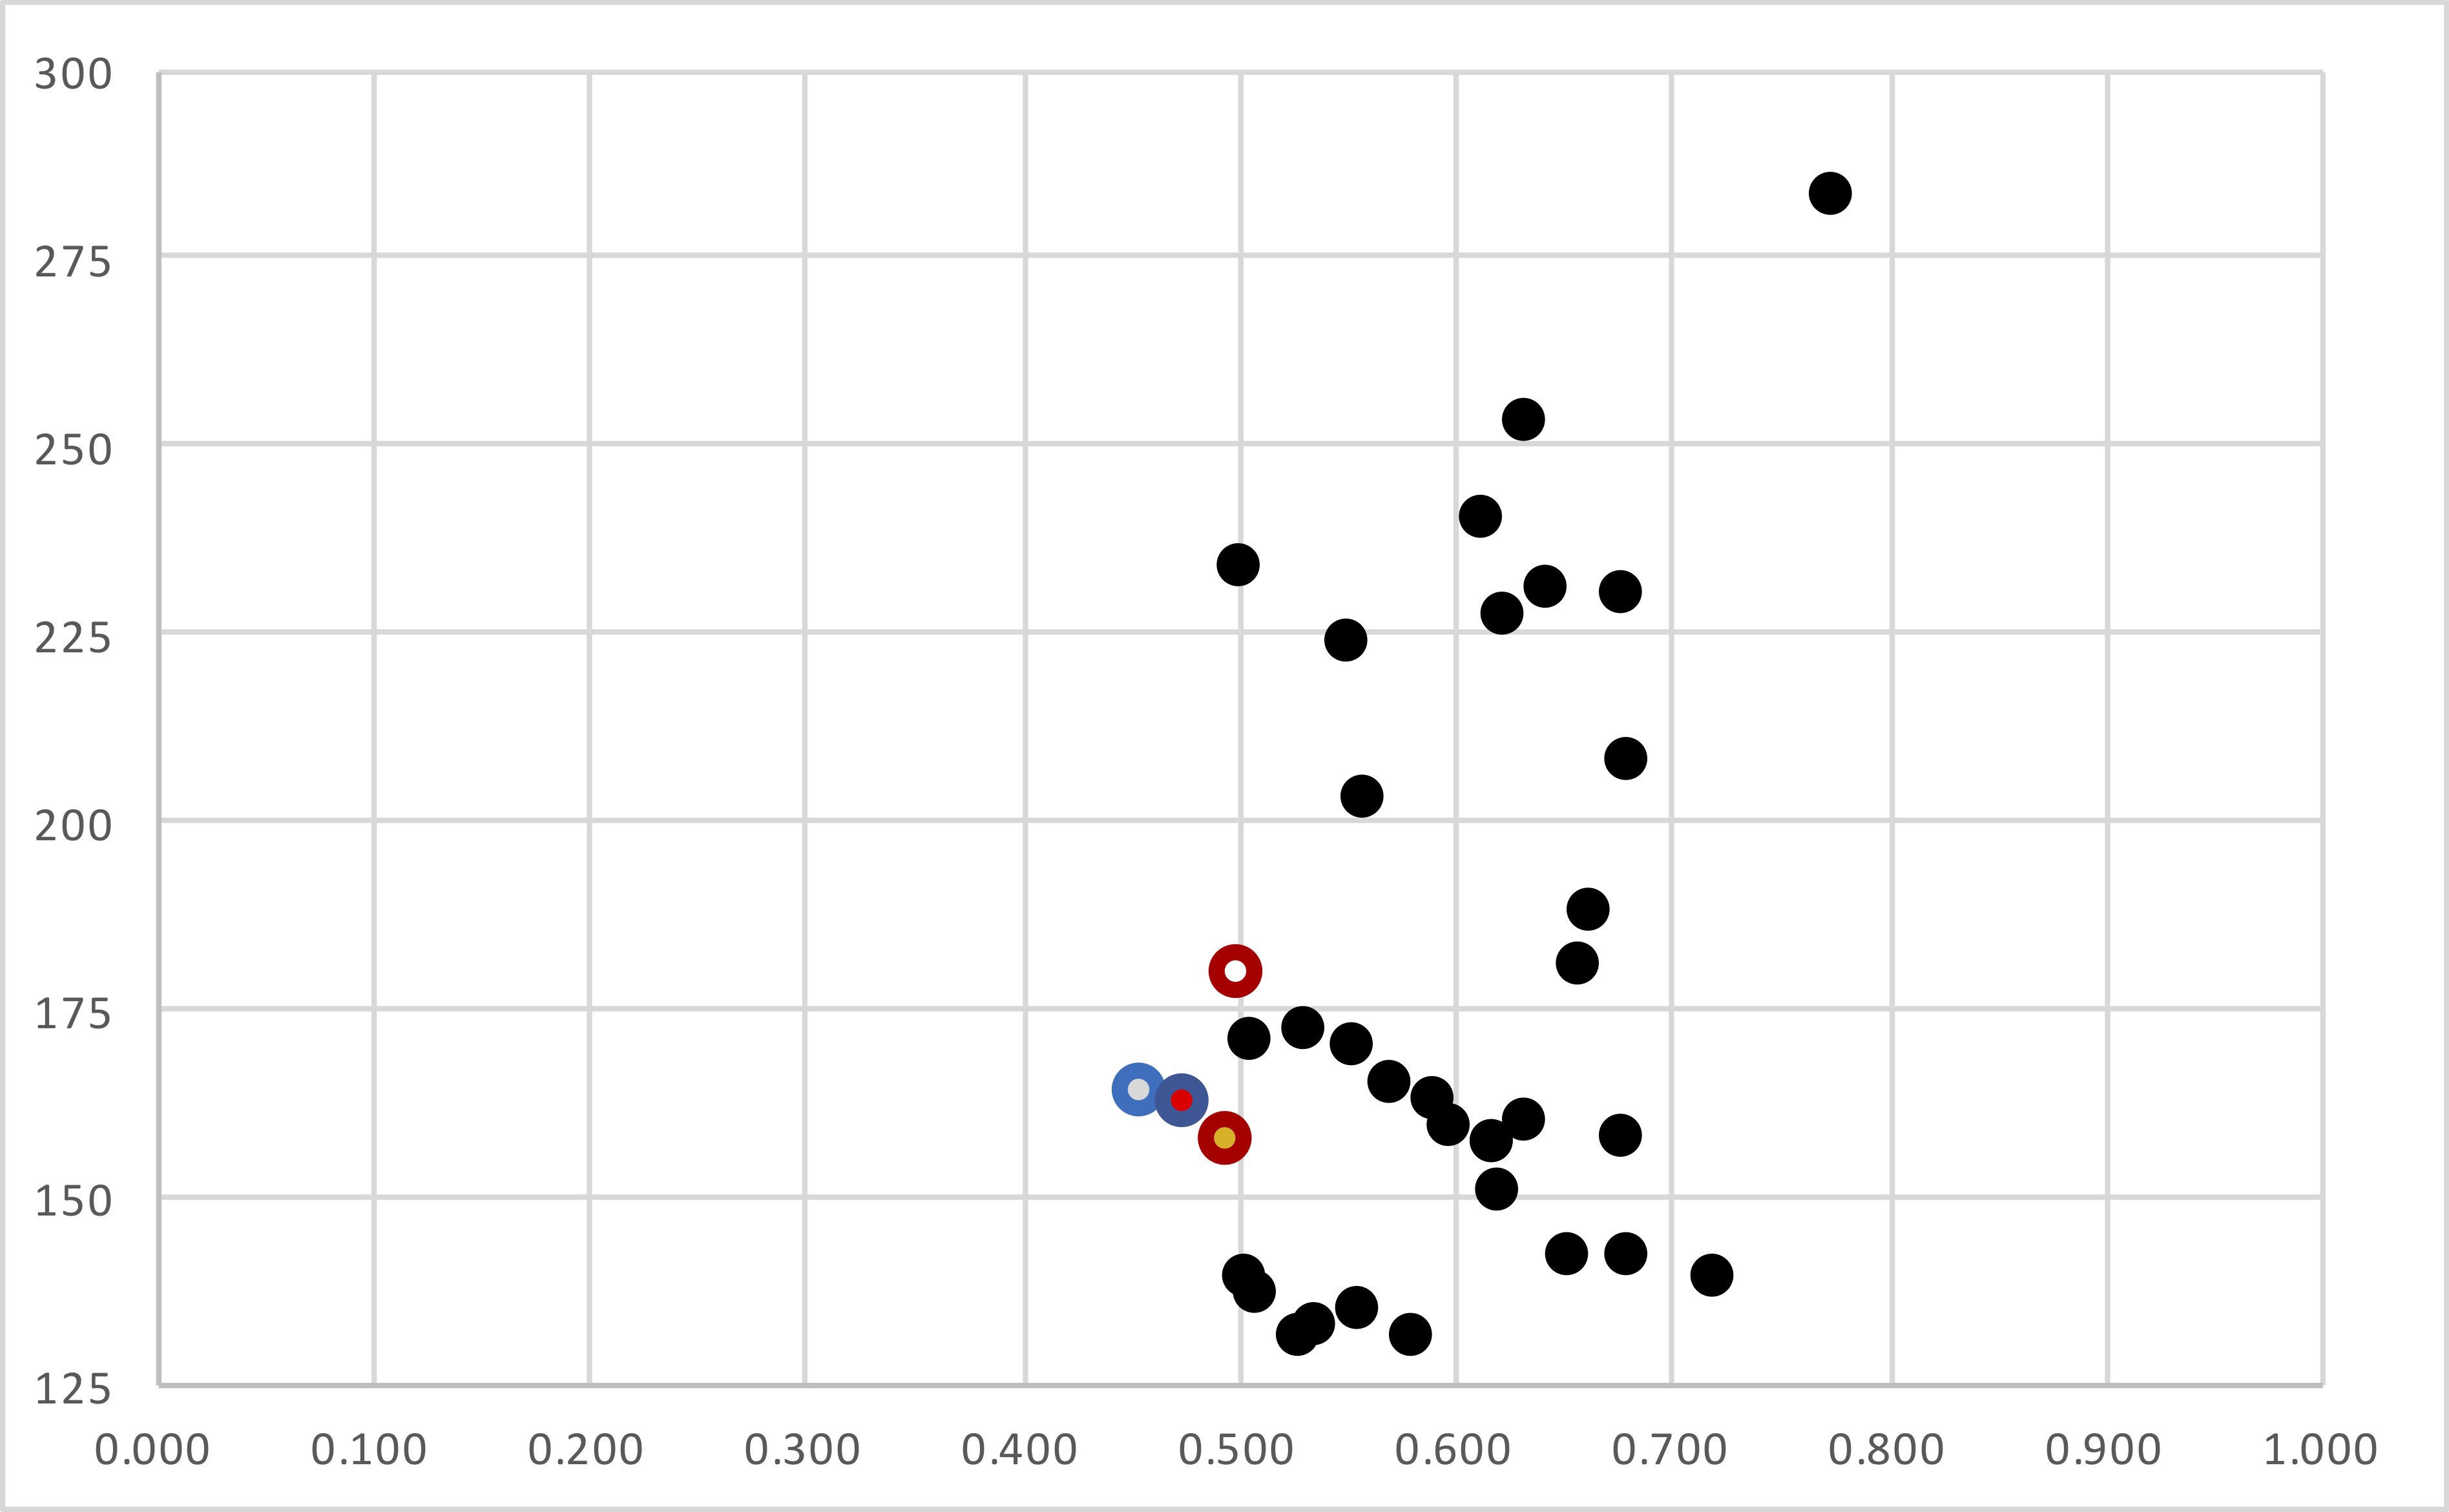
For Detroit, this closes the book on the Stafford chapter.  Did he disappoint in Detroit?  I think the better summary is that he was a very good player saddled on a bad franchise. There are only four quarterbacks to start 130+ games with one team despite having a losing record: Stafford, Joe Ferguson, Jim Hart, and John Brodie.  Here is every quarterback-team relationship with 130+ starts, with their collective winning percentage on the X-Axis and their number of starts on the Y-Axis.  I have put Stafford, Ferguson Hart, and Brodie in team colors; yes, Stafford has the worst winning percentage of the group. [3]And yes, this cut-off was intentional, and historians should have been able to guess that Archie Manning started 129 games for the Saints.

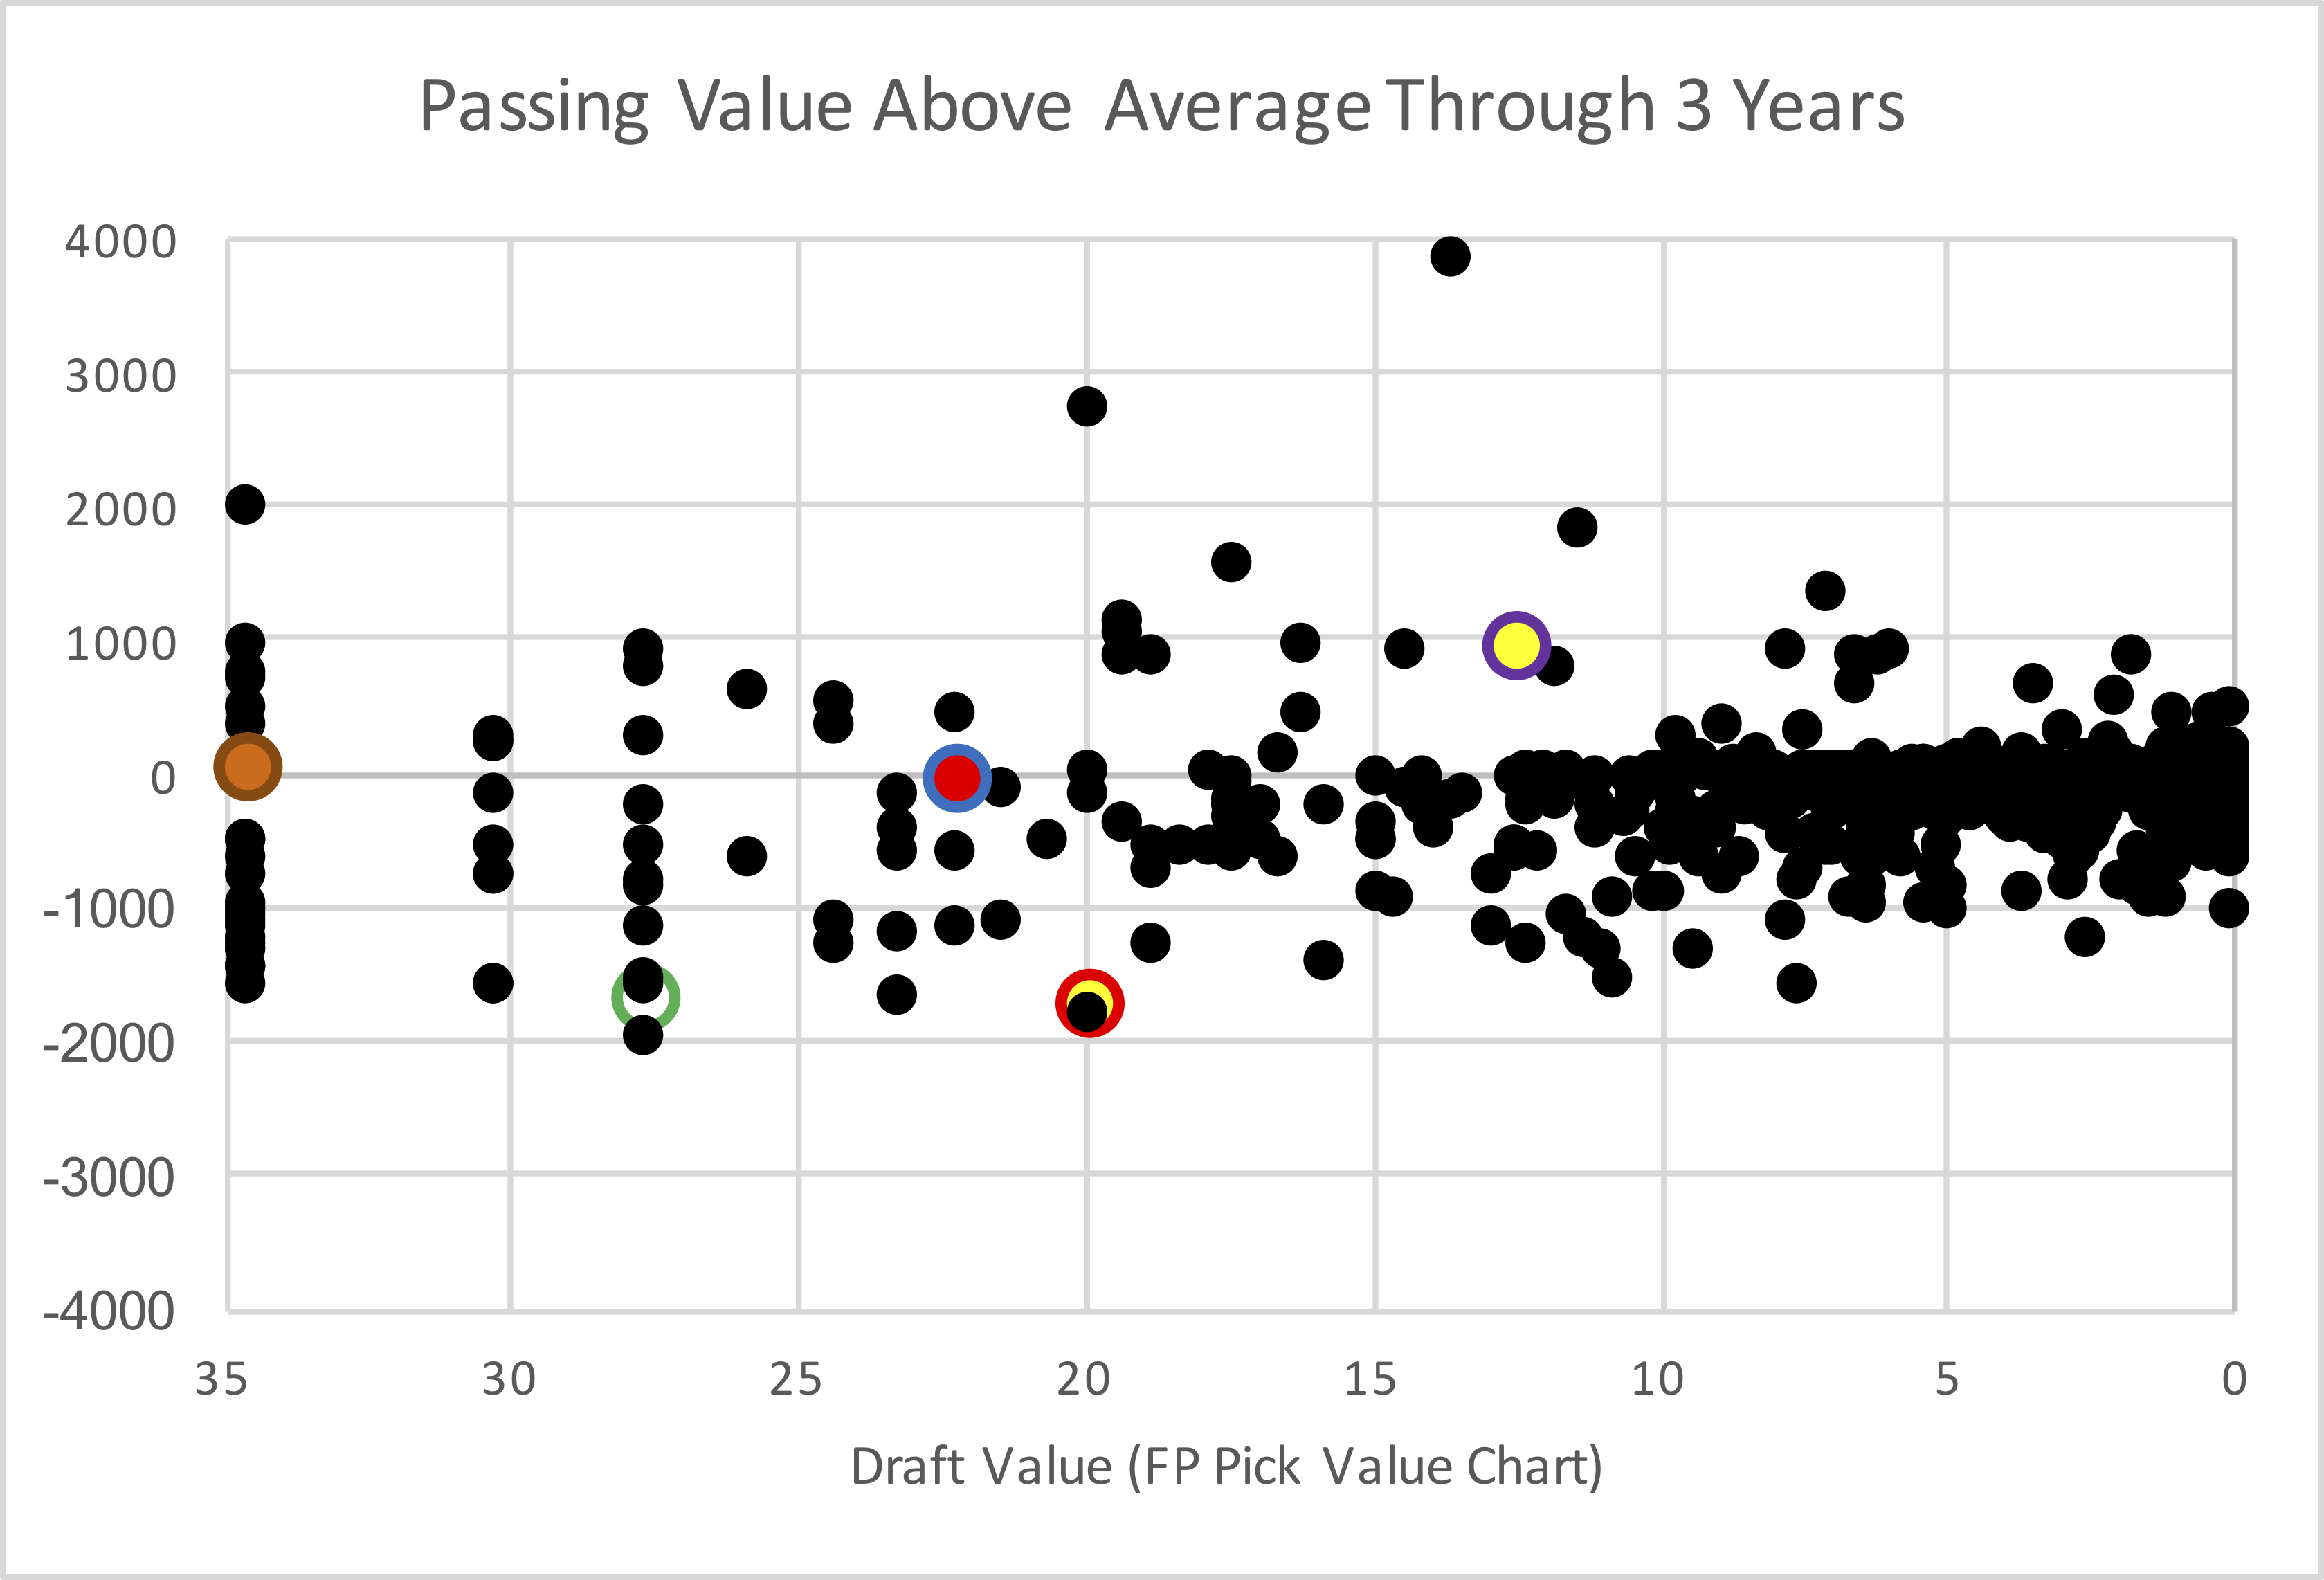
So how much is Los Angeles giving up to get Stafford?  Some NFL teams put a full round discount on future picks, which would make a 2022 1st round pick equal to a 2021 2nd round pick, and a 2023 1st round pick equal to a 2021 3rd round pick.   That is more justifiable when, like with the Rams, the expectation at least is that those first round picks will not be top-10 picks.  If we use the Jimmy Johnson calculator, and treat the ’22 1st as equivalent to the 45th pick and the ’23rd 1st like the 75th pick, that implies L.A. sent value equal to the 20th or 21st pick in this year’s draft.  But that is probably the wrong way to analyze the situation: it assumes too significant a discount, as we would expect Stafford to be worth more than that (for example, Indianapolis has a quarterback need and the 21st overall pick in this year’s draft, and that presumably would not have been enough to get Stafford).

So if that discount is too high, how do we determine the right discount?  Let’s start by saying the average first round pick is worth 18.4 points on my chart, equivalent to the 13th overall selection (because the dropoff in value is logarithmic). On the JJ Chart, the average first round pick is about the same, falling in between the 12th and 13th overall picks.

If we use a 10% discount rate, that would make a 2022 1st round pick equal to the 17th pick on my chart and the 15th on the JJ Chart. Use a 20% discount rate, and a 2022 1st round pick is equal to the 23rd pick on my chart and the 17th on the JJ chart; a larger discount rate than that is hard to justify. For a 2023 1st round pick, using a 10% discount rate, we get the 22nd pick or the 17th pick on the FP and JJ charts, and equivalent to the 36th pick and the 24th pick in 2021 using a 20% discount rate.

Here, the Rams are getting Stafford, a relatively known commodity. [4]It’s important to keep in mind that often teams trade future firsts with a specific rookie player in mind; when Atlanta traded a future first round pick for the 6th pick in the draft it … Continue reading Does that argue for a higher discount rate? Perhaps so. So let’s say we use the 20% number. How do we value the 88th pick in this year’s draft plus the two first rounders the next two years? [5]Of course, the Rams are without a first round pick in 2021 due to the Jalen Ramsey trade. If we consider the 2022 and 2023 first round picks to be average in value, and then apply a 20% discount, those picks combined with the 88th overall selection are equivalent to the 32.6 points on the Football Perspective Draft Value Chart and 1817 points on the traditional, JJ Chart. That’s equal to between the 1st and 2nd picks on my chart, or the 4th pick on the traditional chart.

And that is… a lot. I feel pretty confident in saying that such a collection of picks is worth more than Stafford alone. The Jets and Dolphins are the 2nd and 3rd picks, and I don’t see any reason to think either team would trade that pick for Stafford. Miami in particular might be a great landing spot for a player like Stafford, but there was no indication that the Dolphins were willing to offer up the 3rd overall pick for Stafford.

Which means the Rams — and the NFL — must view Goff as a liability. Stafford alone isn’t worth the 3rd pick in the draft, but Stafford is worth the 3rd pick along with Goff’s contract.

References

References
1 Which had been acquired when the Rams traded Sam Bradford to the Eagles.
2 The Texans have twice traded away top-5 draft picks in recent years without knowing it.
3 And yes, this cut-off was intentional, and historians should have been able to guess that Archie Manning started 129 games for the Saints.
4 It’s important to keep in mind that often teams trade future firsts with a specific rookie player in mind; when Atlanta traded a future first round pick for the 6th pick in the draft it wasn’t for the generic 6th pick; it was for Julio Jones, a player they certainly had a very high grade on. That sort of certainty and opportunity (after all, the 6th pick if used on Jones might be worth the 1st overall pick to Atlanta if he was the top player on their board) would make teams more comfortably trading more, which would imply a higher discount rate on future picks.
5 Of course, the Rams are without a first round pick in 2021 due to the Jalen Ramsey trade.
{ 0 comments }

In 2020, Derrick Henry had a monster season, rushing for 2,027 yards. In an era where the game continues to shift more to passing every year, Henry’s effort was truly remarkable. It’s also interesting that Buffalo WR Stefon Diggs led the NFL with 1,535 receiving yards.

That made 2020 a bit unusual: in recent seasons, the player with the most receiving yards tends to have a higher number than the player with the most rushing yards. That’s a reversal of how things used to be. The graph below shows the NFL’s rushing and receiving king in each season, and how many rushing or receiving yards they gained. For non-16 game seasons, the numbers were pro-rated to a 16-game era. [continue reading…]

{ 0 comments }

LeSean McCoy Is Looking For Back To Back Rings

Since the start of the 2010 season, no player has more rushing yards than LeSean McCoy. It is easy to forget, but McCoy spent some time as the starting running back for the 2019 Chiefs, even though he did not get a carry in the playoffs. McCoy rushed for 465 yards and 4 touchdowns in the regular season and did earn a ring with Kansas City and his former head coach.

It might be even easier to forget that McCoy is a member of the 2020 Buccaneers. He was signed in early August, before Leonard Fournette would make his way to Tampa Bay.  McCoy has been the team’s fourth string running back, behind Ronald Jones, Fournette, and Ke’Shawn Vaughn. But no matter: McCoy is, technically, back in the Super Bowl, for the second year in a row.

If Tampa Bay wins, McCoy — who was arguably the best running back of the 2010s — will close out his career with a pair of rings with two teams that nobody will ever associate him with. That said, he would join a pretty exclusive list. Here are the eight players who have won back to back rings with different teams.

  • The two famous members of the club pulled off this trick in 1994, as members of the San Francisco 49ers, and in a surrounding year with the Dallas Cowboys. One was Deion Sanders, who left Atlanta for San Francisco in 1994, and then San Francisco for Dallas in ’95. The other was Ken Norton, Jr., who spent the first six years of his career with Dallas, and won the Super Bowl in 1992 and 1993. Norton then joined the 49ers in ’94, where he spent the final seven seasons of his career. Hochstein and Norton are the only two players to win Super Bowls in three consecutive seasons.
  • Guard Russ Hochstein was the next player to do so. He was drafted by Tampa Bay in 2001 and played in one game in 2002; he was waived in October and signed by the Patriots a week later. He stayed in New England through 2008, so Hochstein picked up a Super Bowl ring for his cup of coffee with the Bucs and then earned two more the next two seasons in New England. Hochstein was also a freshman with Nebraska in 1997, when the Cornhuskers were named national champions by USA Today and ESPN. He’s got a lot of hardware!
  • Defensive back Derrick Martin played in five games for the Packers in 2010 and 14 for the Giants in 2011. Sure, Martin had just 1 interception and 14 tackles during those two years, but it counts!
  • Brandon Browner was the next to do it, and he had a big role in both title teams.  He was a star on the ’13 Seahawks, although he was suspended towards the end of the season and did not play in the team’s postseason run. He joined New England in 2014, and then made the play of the game — or, perhaps, the assist of the game — to help the Patriots defeat his former team. [1]Caylin Hauptmann was also a member of the 2013 Seahawks, and he was signed by the 2014 Patriots.  I don’t believe he should be included, but if you want to, feel free!
  • LeGarrette Blount led the NFL in rushing touchdowns in 2016 with New England, picking up a ring with the Patriots that season.  The next year he joined the Eagles, and scored a touchdown in Philadephia’s Super Bowl win over his former team. Chris Long was also a rotational defensive linemen on both the ’16 Patriots and ’17 Eagles.
  • Surely you don’t remember that Kenjon Barner was the kickoff returner for the ’17 Eagles, do you?  Barner, a star of Oregon under Chip Kelly, joined Philadelphia under Kelly’s watch and survived with the team through 2017.  The next season, he was signed by the Patriots and rushed for 71 yards before being cut in midseason.  No matter: when the ’18 Patriots went on to win the Super Bowl, Barner received a ring.  Literally.  Oh, and guess what? Barner is also a member of the ’20 Buccaneers, although he is unlikely to play in Super Bowl LV.  But I assume he is definitely ready for a third ring in four years.


References

References
1 Caylin Hauptmann was also a member of the 2013 Seahawks, and he was signed by the 2014 Patriots.  I don’t believe he should be included, but if you want to, feel free!
{ 0 comments }

How do Kansas City and Tampa Bay compare to previous Super Bowl participants when it comes to scoring and preventing points? Without any adjustments for era, these two teams look like awful defensive teams and very good (but not historically great) offensive teams.

In the graph below, the X-Axis shows points scored per game, while the Y-Axis shows points allowed per game. The best teams would be in the lower right, at least according to this metric. The Bucs and Chiefs are color-coded, with Super Bowl winners in black circles and losers in white circles. The ’99 Rams are in the lower right corner at 33 points per game and 15 points allowed per game; the ’13 Broncos are the team at the far upper right, while the ’11 Giants, of course, are in the upper left: they are the only Super Bowl team to allow more points than they scored. [continue reading…]

{ 1 comment }

The 2017-2020 Saints Came Up Just Short

The Saints have been defined by Sean Payton and Drew Brees for 15 years. And because of that, we tend to think about the Saints as a team that won a Super Bowl — even if the New Orleans championship team was over a decade ago.

The current Saints team — with offensive stars like Alvin Kamara and Michael Thomas, and a host of talented defensive players (Demario DavisCameron Jordan, Marcus Williams and Marshon Lattimore, among others) — has not tasted championship success despite a remarkable amount of regular season success. In fact, they haven’t even made the Super Bowl. And with Brees now retiring, it looks like the curtain will close on what is easily the best four-year run in New Orleans regular season history.

Over the last four years, New Orleans has the most wins of any team (49), scored the second-most points behind Kansas City, and allowed the fifth fewest points.

Such great regular season success often results in a championship or two, and almost always results in a Super Bowl appearance. The Saints have a 0.766 winning percentage over the last four seasons, making them just the 4th franchise in the Super Bowl era to have such a high level of regular season success without making it to a Super Bowl.

The Dallas Cowboys from 1966 to 1969 had a similar streak of disappointing endings. In ’66, Dallas went 10-3-1 with the best offense in football; they lost to the Lombardi Packers in the NFL title game, the first time such game was the precursor to the Super Bowl. In ’67, Dallas went 9-5 but lost to the Packers in the Ice Bowl, again on the doorstep of the Super Bowl. In 1968, Dallas went 12-2, beating the Browns easily in the regular season but losing to them in the playoffs.

Don Meredith had led Dallas to a 27-9-1 mark from ’66 to ’68, but was embarrassed by Cleveland in the ’68 postseason, going 3 for 9 for 42 yards with three interceptions before being benched. At 31 years old, Meredith retired after the season. Enter Craig Morton, who led the ’69 Cowboys to an 11-2-1 mark in 1969… before the team again saw their season end at the hands of the Browns. Four seasons, a 0.768 winning percentage, and no Super Bowl appearances. The next year, Morton (with some help from Roger Staubach) and Dallas went 10-4 and finally reached it to the title game… before losing to the Colts. The year after, in 1971, Staubach helped Dallas finally reach the mountain top, winning Super Bowl VI.

The Oakland Raiders had a similar rough stretch from ’72 to ’75. In 1972, under Daryle Lamonica, the Raiders went 10-3-1 and ended the year on a 6-game winning streak. In the playoffs, it took the Immaculate Reception to defeat Oakland. In 1973, Ken Stabler became the starter, and while the Raiders would go 9-4-1 and avenge the playoff loss to Pittsburgh in the ’73 postseason, Oakland would still come up short against the defending Super Bowl champion Dolphins, who would repeat in ’73. In 1974 the Raiders went 12-2 and led the NFL in scoring; they would get their revenge against Miami in a memorable way in the playoffs, but once again were bested by the Steelers in the postseason. In 1975, Oakland had another great regular season that ended in a third straight loss in the AFC Championship Game, again to the Steelers. Over that 4-year run, the Raiders had a 0.768 winning percentage, but no Super Bowl appearances. Finally, in year five, Oakland would go 13-1, beat a depleted Steelers team in the playoffs, and then make — and win — their first Super Bowl.

The last franchise to discuss had a much longer run of frustration and did not ever result in redemption. The Los Angeles Rams from ’73 to ’76 had a 0.795 winning percentage, while the ’75 to ’78 squads went won 76.7% of their games. The ’67 to ’70 Rams also qualify with a 0.768 winning percentage during that four year run. Guard Tom Mack was on the Rams from ’66 to ’78; Merlin Olsen was a Ram from ’62 to ’77, so let’s call these the Mack/Olsen Rams.

Let’s look at the Rams from ’66, when Roman Gabriel took over as the starting quarterback, through the end of the ’70s. There was a constant shuffling of coaches and quarterbacks during the Mack/Olsen era,

The ’75 to ’78 Rams won 77% of their games and lost in the NFC Championship Game three times. From ’67 to ’70, Los Angeles twice missed the playoffs despite strong seasons, and twice lost in the division round to the eventual NFC Champion. But the period from ’73 to ’76 takes the cake: L.A. went 44-11-1 in the regular season but never made it to the Super Bowl. Minnesota went 45-10 and made it to three Super Bowls during this window, with Dallas (who beat the Rams in the playoffs in ’75) earning the other NFC appearance.

And then we have the Saints. New Orleans has won 11, 13, 13, and 12 games over the last four seasons. The 2017 season ended with the Minnesota Miracle; in 2018, the Saints earned the #1 seed but lost to the Rams in the NFC Championship Game, with a key defensive pass interference by Rams cornerback Nickell Robey-Coleman going uncalled. In 2019, New Orleans went 13-3 in the rare year where that landed them the three seed. That bad luck continued, with wildcard Minnesota once again upsetting the Saints and ending their season. And finally, in 2020, the Saints swept the Bucs in the regular season and earned the #2 seed in the NFC, but lost the third game against Tampa Bay in the Division Round.

References

References
1 Harris was the main quarterback for most of the season, but a shoulder injury late in the season made Jaworski the playoff starter.
{ 0 comments }

2020 Is A Very Offensive-Powered Final Four Ever

Two years ago, I wrote that 2018 gave us The Most Offensive-Powered Final Four Ever. Well, Tom Brady and Patrick Mahomes are back, this time joined by the Packers and Aaron Rodgers and the Bills and Josh Allen (as opposed to the Saints and Drew Brees and the Rams and Sean McVaybot in ’18). In 2018, the top four teams in scoring made it to the final four: it doesn’t get any more clear cut than that.

This year, the top three scoring teams — Green Bay, Buffalo, and Tampa Bay, in order — are in the final four. They are joined by the Chiefs, who ranked 3rd in the AFC (behind Tennessee) and 6th in the NFL in scoring (also behind New Orleans). Saying that Kansas City has the worst offense of any playoff team left is a bit like saying that Batman is the superhero with the weakest powers; you may have a bunch of evidence, but nobody is going to take your claim very seriously. It is also worthwhile to point that that the Chiefs ranked 2nd in the NFL in scoring after 16 weeks, before benching Patrick Mahomes and several other starters in a meaningless week 17 game and falling to 6th in the rankings.

And while this year may not have the final four according to the ranks, it is certainly up there as one of the highest-powered final fours of all time. In 2020, NFL teams averaged 24.8 points per game; the Packers led the league by averaging 31.8 points per game, or 7.0 points per game better than average. There have been 204 teams to make it to the conference championship game since 1970, and I calculated how many points per game each team scored relative to league average in each season. I also did the same for points allowed. The graph below shows all 204 teams, with their points scored per game relative to league average on the X-Axis, and the points allowed metric on the Y-Axis. In other words:

Top right = good offense, good defense
Top left = bad offense, good defense
Bottom left = bad offense, bad defense
Bottom right = good offense, bad defense

As you would expect, most of the teams that make it to the conference championship game fall in the upper right quadrant. I have color-coded the 2020 teams in the graph below. [continue reading…]

{ 0 comments }

Aaron Rodgers and Tom Brady meet again: Can you feel the hype?

There are, of course, a lot of similarities between Aaron Rodgers and Mark Sanchez.

Both players were born in California, played college football in California, and were drafted by cold-weather teams.

Both players were first round picks to teams in green jerseys.

Both players have thrown exactly 89 career interceptions in the NFL.

And one season, at the start of a new decade, both Sanchez and Rodgers got trounced by a Tom Brady-led team. In 2010, in a game against the Patriots, Sanchez went 17 for 33 for 164 yards with 0 TDs, 3 interceptions, and 1 sack for 15 yards, producing an anemic 0.41 ANY/A as the Jets lost 45-3. In 2020, in a game in Tampa Bay, Rodgers went 16 for 35 for 160 yards with 0 TDs, 2 interceptions, and 4 sacks for 42 yards, a 0.72 ANY/A average; the Packers lost 38-10.

But Sanchez would get a chance to exact revenge in the postseason, and it was served ice cold: the Jets won, the largest regular season margin ever avenged in a game at the same site in the playoffs. This year’s Packers/Buccaneers game is a little different. For starters, the Jets actually had beaten New England earlier in the year, while Green Bay and Tampa Bay are no longer division rivals and only played once during the regular season. More importantly, while the 2010 Patriots were the better team and the home team, this time around, Brady’s team looks to be the worse team and is on the road.

So enough with the constant Sanchez/Rodgers comparisons. Let’s begin looking at situations similar to what will be playing out on Sunday in the NFC Championship Game: that is, times where a team met once (and only once) during the regular season, and then met again in the playoffs.

There have been three 40+ point wins in the regular season that saw rematches in the postseason: in all three, the regular season team won again.  Those three games were, with the team that got blown out listed first, 1969 CLE @ MIN, 1991 DET @ WAS, and 2018 PHI @ NOR.  You will notice that in all three games (along with many of the other, less than 40 point blowouts), the team that got blown out — for lack of a better words, let’s call them the Packers of history — were on the road in the rematch.  And that’s part of what makes the Green Bay/Tampa Bay game less common.

The Packers will be 3.5 point favorites in the NFC Championship Game. So a better comparison might be the 2016 Chiefs and Steelers. In 2016, Kansas City was very good: they finished 12-4, but they were blown out, 43-14, on the road in Pittsburgh during the regular season. Pittsburgh went 11-5, and so the postseason game was in Kansas City. That sounds similar to the upcoming Green Bay/Tampa Bay game, with the rematch switching venues to the home of the better team. The Chiefs were 2.5 point favorites in that game, which they… well, lost, 18-16.

There have been 20 teams in the Super Bowl era that are facing something “similar” to what the Packers have this weekend. That means they:

  • Lost by double digits in the lone regular season game against the playoff opponent
  • The rematch was at the site of the “Packers” team
  • The “Packers” were favored to win the postseason rematch

How did previous Packers teams fare? They went 14-6, meaning the Chiefs/Steelers game referenced above was an outlier. If you want an example that Packers fans will be happy about, let’s use a very topical pair of teams. In 1993, the Buffalo Bills hosted the Kansas City Chiefs for the AFC Championship Game. In the regular season, in a game on the road at Arrowhead, the Bills were easily handled by the Chiefs, 23-7. In the rematch, Buffalo — the “Packers” in this example — was favored by 3 points, despite going up against an old man considered the greatest quarterback of all time: Joe Montana. Buffalo did win the rematch easily, 30-13, and knocked Montana out of the game.

Here are all 20 games, with the “Packers” team — the one that got blown out in the regular season but hosted the rematch — listed first. Excluding four games that are red herrings, the home team went 11-5 in the rematch. Whether you think that’s good (hey, they got blown out the first time and won over 2/3s of their games) — or bad (they were favored to win and only won 11 out of 16 times) is up to you. It’s also worth pointing out that at least three of the times the home team exacted revenge involved some pretty miraculous circumstances, [1]The Comeback, The Catch II, Ray Hamilton. and this pretty easily could have been an 8-8 split.

Please leave your thoughts in the comments.

References

References
1 The Comeback, The Catch II, Ray Hamilton.
2 Manning benched in the middle of the game as the Colts already had the 1 seed locked up.
3 Week 17 game where the Bengals rested starters as the game was meaningless for Cincinnati.
4 Week 17 game where the Bengals rested starters as the game was meaningless for Indianapolis.
5 While this was a week 17 game, it was not meaningless for Buffalo; the Bills lost the AFC East by losing this game. And while this game might have an asterisk because Kelly was injured during the game, the rematch also came the next week without Kelly in a forgotten matchup between the two teams.
6 This game came with replacement players.
{ 0 comments }

The 2018 Draft Class was hailed as one of the best of all time. Where do things stand after three years? At a high level, it looks like there are three winners and two losers — after all, three of those quarterbacks will be starting games this weekend in the division round of the playoffs, while the other two were huge busts for their drafting team. But let’s dig a little deeper:

  • Baker Mayfield was the first overall pick and has had an up-and-down run with Cleveland. Overall, he’s done enough to show that he deserves to keep the starting job, but he has not had a top-10 quarterback season since entering the league. Probably a bit below the expectations that come with the number one overall pick, but Cleveland fans are not unhappy.
  • Sam Darnold was the third overall draft pick, selected by the New York Jets. It has not gone well.
  • Josh Allen was the 7th overall pick and is probably the toughest player to evaluate. He was awful as a rookie, bad as a second-year player, and then played like a top-5 quarterback in 2020. He looks like a big win for Buffalo, and he adds a lot of value as a runner; that said, as a passer, he’s actually been below average over the course of his three seasons.
  • Josh Rosen has been the clear worst quarterback of the group, and his team moved on from him after just one year. Rosen has been worse than Darnold on a per play basis, but given that Arizona replaced him with Kyler Murray, you could argue that the Cardinals were hurt less by the Rosen pick than the Jets were with Darnold. Rosen has been a fast burn, like a Johnny Manziel, while Darnold more fits the Joey Harrington or Rick Mirer slow burn mold.
  • Lamar Jackson is the quarterback least capable of being evaluated solely as a passer, because he’s been the most dynamic runner in the NFL since he entered the league. Still, he’s been a very good passer through three seasons, and has clearly been the most productive quarterback through three years.

The graph below shows all quarterbacks drafted over a 50-year period, from 1969 to 2018. The Y-Axis shows how much passing value over average they produced — calculated by taking each quarterback’s Adjusted Net Yards per Attempt average relative to league average in each season, and multiplying that by the number of dropbacks. The X-Axis shows each player’s draft value, which is based on their draft selection. The more highly drafted players are on the left side of the chart, while the later picks are on the right side of the chart. For the 2018 1st round quarterbacks, I made their bubbles larger and color-coded them by team.

And here is the full dataset; the table is sortable and searchable.

Darnold and Rosen grade out as two of the five worst passers through three seasons in the entire study, although a pair of Jaguars have them both beat.

{ 0 comments }

It is hard to beat a good team three times in a season, they say. Since the 1970 NFL Merger, there have been 21 instances where a team swept a team in the regular season and then had a third battle in the playoffs. The sweeping team has gone 14-7 in those games, which means it must not be *that* hard to beat a playoff team three times in a season. [1]For the historians out there, in the ’60s, the sweeping team went 3-1: the ’63 Chargers swept the Patriots and then beat them in the AFL Title game, the ’64 Bills pulled off that … Continue reading

It is worth noting that in 4 of these 21 trio of games, the sweeping team was on the road in the postseason. [2]The ’84 Seahawks swept the Raiders but finished three games behind them in the standings and lost in the playoff game, the ’92 Chiefs went 10-6 and swept the 11-5 Chargers and lost in San … Continue reading In the 17 instances where the postseason home team swept their playoff opponent during the regular season, the home teams went an impressive 12-5 in those games. The home team was, as you would expected, favored in all 17 games, with an average points spread of 5.8 points.

In the season opener, the Saints beat the Bucs by 11 points, and then the Saints shocked Tampa Bay on the road in the rematch, 38-3. Drew Brees threw 6 touchdowns and had no interceptions in the two games, while Tom Brady threw just 2 touchdowns and 5 interceptions while averaging just 5.13 net yards per attempt in those games. New Orleans won the two games by an average of 23 points a remarkable amount even for a two-game sweep. But it probably doesn’t mean much: there were three teams in our 17-paired sample where the sweeping team averaged a 17-point win or better during the regular season; shockingly, those teams went 0-3 in the playoff rematch.

The graph below shows the average margin of victory (on the X-Axis) for the sweeping team in the regular season, along with the results in the playoff game on the Y-Axis. Obviously if the dot is below the 0 line on the Y-Axis, that means the sweeping team lost in the postseason.

So yes, the Saints sure seem well equipped to handle Tampa Bay based on their dominant performance in the regular season. But I think it is probably best just to ignore that; for the most part, the sweeping teams usually win because they were the better team in the regular season and were at home in the playoffs. In this case, New Orleans is a 3-point favorite in the rematch, a pretty low number due to the low homefield advantage in this COVID-19 world and the extremely similar points differential the two teams had during the regular season.  I agree with Vegas: I’d make New Orleans the favorite, but this game feels close to a toss up.  And while I wouldn’t put much stock in the Saints regular season sweeps, I certainly would ignore any analysis that says it’s hard to go 3-0 against a good team.  Once you go 2-0, it’s actually not that hard!

The table below shows the 17 trio of games discussed above. Again, the home playoff team after sweeping their postseason opponent has gone 12-7 since the merger. The table below also includes links to all three games.

As always, please leave your thoughts in the comments.

References

References
1 For the historians out there, in the ’60s, the sweeping team went 3-1: the ’63 Chargers swept the Patriots and then beat them in the AFL Title game, the ’64 Bills pulled off that same trick against the defending champion Chargers, and in the NFL, the Packers swept the Colts, although the last game came without either Hall of Fame quarterback. The one that went the other way was in 1969, when the AFL’s Chiefs lost to the Raiders in two tight regular season games, and then beat Oakland in the AFL Championship Game.

In the post World War II period (1945 to 1959), the sweeping team went 4-2 in these games: Cleveland pulled off this trick twice in the AAFC, and the ’52 Lions and ’58 Giants did it against the Rams and Browns, respectively. On the other hand, in 1950 (i) the Rams were swept by the Bears in a pair of close games, and then beat Chicago at home in the tiebreaker game, and (ii) the Browns lose two tight games to the Giants and then beat New York in the tiebreaker game.

2 The ’84 Seahawks swept the Raiders but finished three games behind them in the standings and lost in the playoff game, the ’92 Chiefs went 10-6 and swept the 11-5 Chargers and lost in San Diego in the postseason. On the other side, the ’99 Jaguars went 14-2, but lost all three games to the 13-3 Titans, the ’04 Seahawks went 9-7 but were swept by the 8-8 Rams in the regular season before beating them at home in the playoffs.
{ 7 comments }

Today Marks The First Ever Bills/Colts Playoff Game

The Colts have played 47 playoff games in franchise history, including 5 games apiece against the Steelers, Chiefs, and Patriots. But until today, the Colts have never played the Bills in a playoff game, one of just two AFC teams (Jacksonville) that the Colts have never played in the postseason.

The Bills have played 31 playoff games, including against the Dolphins four times. Buffalo has played a postseason game against all but two AFC teams: the Colts and the Ravens.

For half of Buffalo’s history, the Colts were a division rival; but the two teams were rarely both good at the same time. The graph below shows each team’s winning percentage in each season since 1960.

In ’64 and ’65, the Bills won the AFL Championship both seasons, while the Colts were one one of the top NFL contenders. Of course, the two leagues wouldn’t first play until the following season. At least one of the teams — usually Buffalo — had a losing record for most of the next two decades. The Bills would have a decade long stretch under Jim Kelly when they were a perennial contender, while the Colts were having mostly down seasons.

In 1999, the Bills went 11-5 under Doug Flutie while the Colts and Peyton Manning went 13-3; both teams lost in notable fashion to the Titans in the playoffs. This year, those records are reversed, but along with ’64 and ’65, ’99 and ’20 are the only seasons in 60 years where both teams went 11-5 or better (or the same winning percentage in a non-16 game season). The Colts had a long run of success under Manning while the Bills were having down years.

But today, the longtime AFC East rivals will finally play in a playoff game.

{ 0 comments }

Cordarrelle Patterson just become the first player to be named a first-team All-Pro returner by the Associated Press for the fourth time in his career. Patterson is on the Mount Rushmore of all time great returners, as he has dominated this era of kickoff returners in outlandish fashion. And he continues to rack up the postseason honors to go with his tremendous return averages, even if it come with a bit of an asterisk.

The Associated Press began naming an All-Pro kickoff returner in 1976; despite the name, it’s far from clear whether the voters drew a distinction between punt and kickoff returns. [1]In 2011, Patrick Peterson received the most votes of any kickoff returner, and he was therefore the first-team All-Pro selection. Only problem: Peterson, who had a magnificent year as a punt … Continue reading That was due in large part to some great returners beginning to enter the league. The previous year, Cardinal Terry Metcalf set an NFL with 2,462 all-purpose yards, and he ranked 3rd in punt return average and 2nd in kickoff return average. In Houston, Billy Johnson, of white shoes fame, had three punt returns for a touchdown in 1975. Pro Football Weekly named Johnson as its All-Pro returner that year, and beginning in ’76, the AP followed suit with a special slot dedicated to kickoff returners.

In the inaugural year, Denver’s Rick Upchurch earned first-team All-Pro honors from the Associated Press; that would happen two more times in his career. In the ’90s, Mel Gray also earned 3 first-team All-Pro returner nods from the Associated Press, and Devin Hester (’06, ’07, ’10) would later become the third player to earn three such honors. [continue reading…]

References

References
1 In 2011, Patrick Peterson received the most votes of any kickoff returner, and he was therefore the first-team All-Pro selection. Only problem: Peterson, who had a magnificent year as a punt returner, did not return a single kickoff that season.
{ 14 comments }

2020 AP All-Pro Teams Announced

After every year, I like to post the full results of the Associated Press voting for the All-Pro team, as the voting numbers are much more valuable than the binary answer to the question of whether or not a player was an All-Pro.

You were probably just getting to the new 2016 rules changes: that year, the AP decided to remove the fullback position in place of a “Flex” spot that goes to a running back, wide receiver, or tight end.  On defense, a “Defensive Back” spot was added

Historically, the voting has been wildly inconsistent at different positions, which has led to numerous embarrassing examples.  This year, the FLEX position and the Defensive Back position have been removed, with 3 WRs being selected and just one fewer defensive player. There were no positional issues this year, but the second-team process remains a joke. Raiders TE Darren Waller had 107 receptions for 1,196 yards and 9 touchdowns but was not a second-team pick.  He would likely have been a unanimous second-team pick if the All-Pro team had an actual second team; instead, because the first-team pick was unanimous, there is no second-team tight end selected.

The full results below.  The first-team picks are bolded. [continue reading…]

{ 0 comments }

Previously:

Week 17 was understated this year; with several playoff spots locked up, many teams rested starters and treated this like the final week of the preseason. With nothing to play for, the Eagles benched their starting quarterback midway through the game, putting in third stringer Nate Sudfeld. P.J. Walker, Chad Henne, and Mason Rudolph, saw significant action this week, while the Rams and Cardinals played one of the few meaningful games but with John Wolford and Chris Streveler as the starting quarterbacks. Remarkably, it was still a pretty good passing week for the NFL: the league averaged 6.30 ANY/A and a 91.8 passer rating in week 17.

The 5-10 Lions faced the 6-9 Vikings in a true meaningless game that turned out to be the most entertaining game of the early window. Kirk Cousins threw for over 400 yards and had a passer rating over 125; that happened only 6 times in the entire decade of the ’90s, but was the fifth time it happened in the 2020 season.

Perhaps just as impressive was Aaron Rodgers in the afternoon game; he threw for a first down on 52% of his dropbacks, including four touchdown passes, in an easy win over the Bears.
[continue reading…]

{ 0 comments }

Final 2020 Passing Statistics

It was the greatest passing season in NFL history… again. More on that in a moment, but first, let’s marvel at the game’s two best players. Aaron Rodgers and Patrick Mahomes were the top two quarterbacks in 2020, and the former MVPs both had magnificent seasons. Unfortunately for Mahomes, he faded slightly down the stretch, while Rodgers went into hyperdrive, throwing 8 TDs and nearly averaging 10 yards per attempt over his final two games.

In 2020, the league average was 6.40 ANY/A, the highest rate in NFL history. Rodgers averaged 8.89 Adjusted Net Yards per Attempt, a number that historians might feel sounds familiar: it’s the exact same number Mahomes averaged in his MVP campaign in 2018. In 2007, Tom Brady averaged 8.88 ANY/A, and in 2013, Peyton Manning averaged 8.87 ANY/A. It doesn’t quite crack the top 5 in this metric since 1970, or even make it the best season for Rodgers: he averaged 9.39 ANY/A in 2011.

But with an 8.89 ANY/A average on 546 dropbacks (526 pass attempts plus 20 sacks); since Rodgers averaged 2.49 ANY/A more than league average, we multiply those two numbers to conclude that Rodgers added 1,355 adjusted net yards of passing value over average. [1]That number is outstanding, but not all that noteworthy from a historical perspective. It 30th in history, in a near dead heat with Philip Rivers, 2009. From 2004 to 2019, there were 15 QBs who … Continue reading Mahomes averaged an excellent 8.33 ANY/A, or 1.93 ANY/A better than league average. He had more dropbacks than Rodgers (610), but that wasn’t enough to overcome the efficiency gap; Mahomes produced 1,176 yards of passing value over average. Deshaun Watson (8.22 ANY/A, 593 dropbacks, 1,077 yards of value over average) ranked 3rd in the greatest season by a QB who went 4-12 in NFL history.

But the Mahomes/Rodgers race was the story of the second half of the season.  In the chart below, I’ve shown how much cumulative value they provided by week, with Rodgers ultimately pulling ahead only in the final two weeks (and Mahomes, of course, sat in week 17).

Statistically speaking, it’s a narrow but clear win for Rodgers. In addition to leading the NFL in both ANY/A and Value, he also finished first in completion percentage and interception rate and touchdown rate. In fact, Rodgers joined Steve Young (1992) as the only quarterbacks since World War II to lead the NFL in completion percentage, interception rate, and touchdown rate in the same season.

Here are the full passing stats for each quarterback who threw 224 pass attempts in 2020. [continue reading…]

References

References
1 That number is outstanding, but not all that noteworthy from a historical perspective. It 30th in history, in a near dead heat with Philip Rivers, 2009. From 2004 to 2019, there were 15 QBs who qualified for the passing title and had a Relative ANY/A of at least 2.50, including most of the MVP seasons you can remember. Rodgers’s season numbers are outstanding, but the era is doing some of work in boosting his numbers; in other words, don’t listen to anyone who says this is one of the 10 greatest seasons in quarterback history, because it was not.
{ 0 comments }

When the Jets traded an enormous sum of draft capital to draft Sam Darnold — more draft capital, mind you, than the number one overall pick — the organization expected big results. Instead, it get the smallest results possible, which is just one reason why the Jets fired GM Mike Maccagnan last year.

Darnold was drafted with the 3rd overall pick in the 2018 Draft, the second quarterback selected after Baker Mayfield. And from 2018 to 2020, among the quarterbacks with at least 600 pass attempts, Darnold ranked dead last in both Adjusted Net Yards per Attempt and passer rating. [continue reading…]

{ 0 comments }
Next Posts Previous Posts