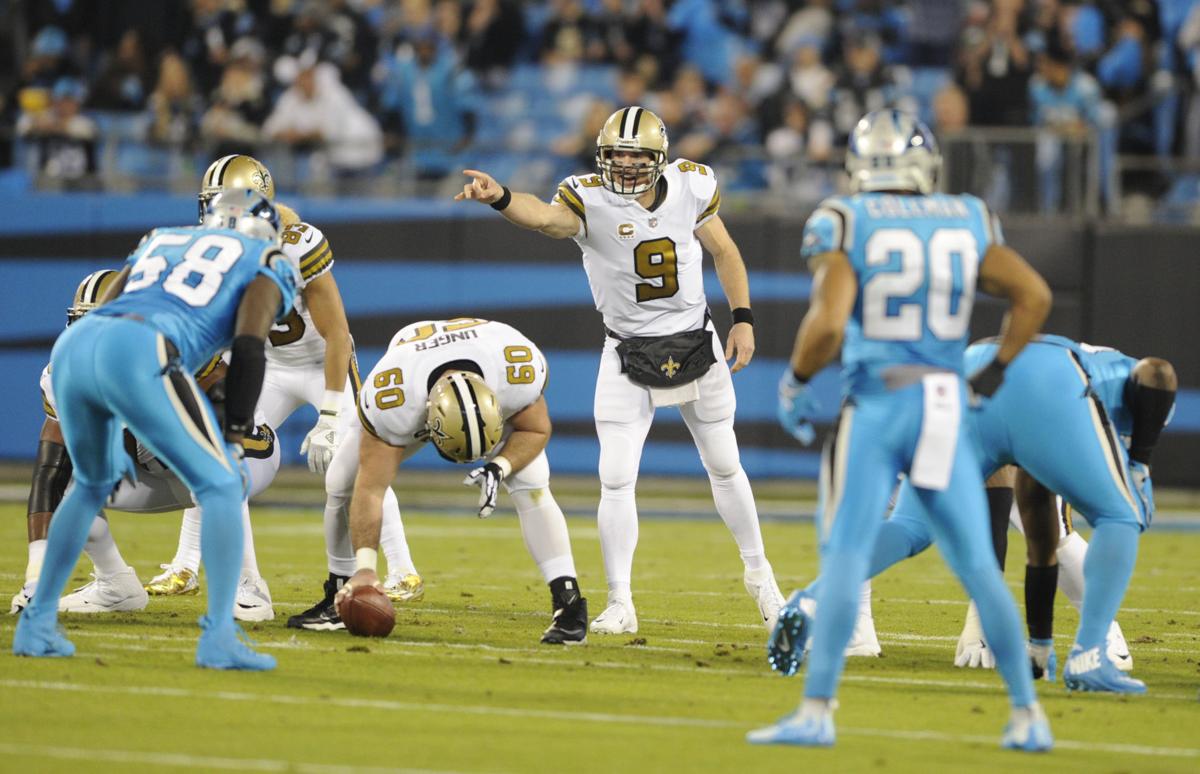
The NFL has released its list of the 22 finalists for the all-century team at quarterback: Sammy Baugh, Sid Luckman, Otto Graham, Bobby Layne, Norm Van Brocklin, Johnny Unitas, Bart Starr, Fran Tarkenton, Joe Namath, Roger Staubach, Terry Bradshaw, Dan Fouts, Joe Montana, Dan Marino, John Elway, Steve Young, Troy Aikman, Brett Favre, Peyton Manning, Tom Brady, Drew Brees, and Aaron Rodgers.
Which 10 will make the list? As I wrote yesterday, I think there’s a clear top tier of quarterbacks that must be included. They are, in chronological order:
Sammy Baugh, Otto Graham, Johnny Unitas, Joe Montana, Peyton Manning, and Tom Brady.
Each of those QBs won multiple championships and multiple MVP awards; in fact, these 6 are the only 6 quarterbacks to do so.
I would then make a 7th tier for one QB. Include him with the first 6 if you like, but whatever you do, you can’t justifiably keep him out of the top ten.
Dan Marino.
That leaves 15 quarterbacks remaining for just three spots. So who misses — and makes — the cut?
Let’s go in reverse order: I think there are three quarterbacks who have little chance of making the cut: Troy Aikman, Dan Fouts, and Joe Namath. All are great, worthy Hall of Famers, but all have too many obstacles to making a top ten list.
- Aikman didn’t have an extraordinarily high peak or longevity and he was not a statistical superstar. Despite the difference in team success, he was a direct contemporary (and competitor) with Steve Young, and he loses that battle.
- Fouts was very good at the end of the ’70s, but he’s generally lumped in with Montana and Marino as quarterbacks of the ’80s: and he loses those battles every time. He was the best quarterback from ’75 to ’84, but the lack of postseason success haunts (and especially his performances in losses) him in a way that he needed more than just 2 first-team All-Pro honors to overcome. Fouts only ranked 4th all-time in passing touchdowns at the time of his retirement, and never caught Fran Tarkenton for the passing yards crown. An outstanding player, but he does not have a great argument for being one of the 10 best passers of all time.
- Namath is probably the most underrated quarterback in pro football, at least if you listen to those who just look at his raw stats. He was the best of his generation at avoiding sacks and fumbles, and while he threw a lot of interceptions, he also was well ahead of every other quarterback in his era at moving the ball down the field. He won 2 AFL MVP awards and was named the AFL All-Decade QB, but with only one Super Bowl title and an injury-shortened career, he’s not top 10 material.
That leaves 12 quarterbacks with 3 open spots, which we can sort of group into four eras.
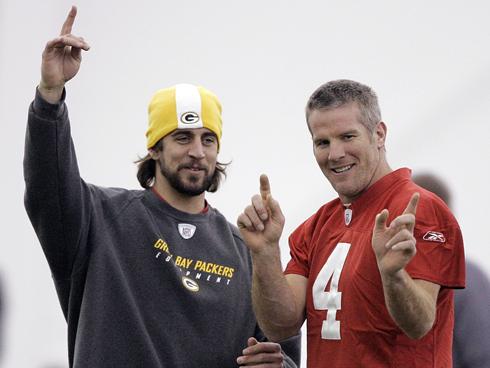
The Active Guys: Drew Brees, and Aaron Rodgers.
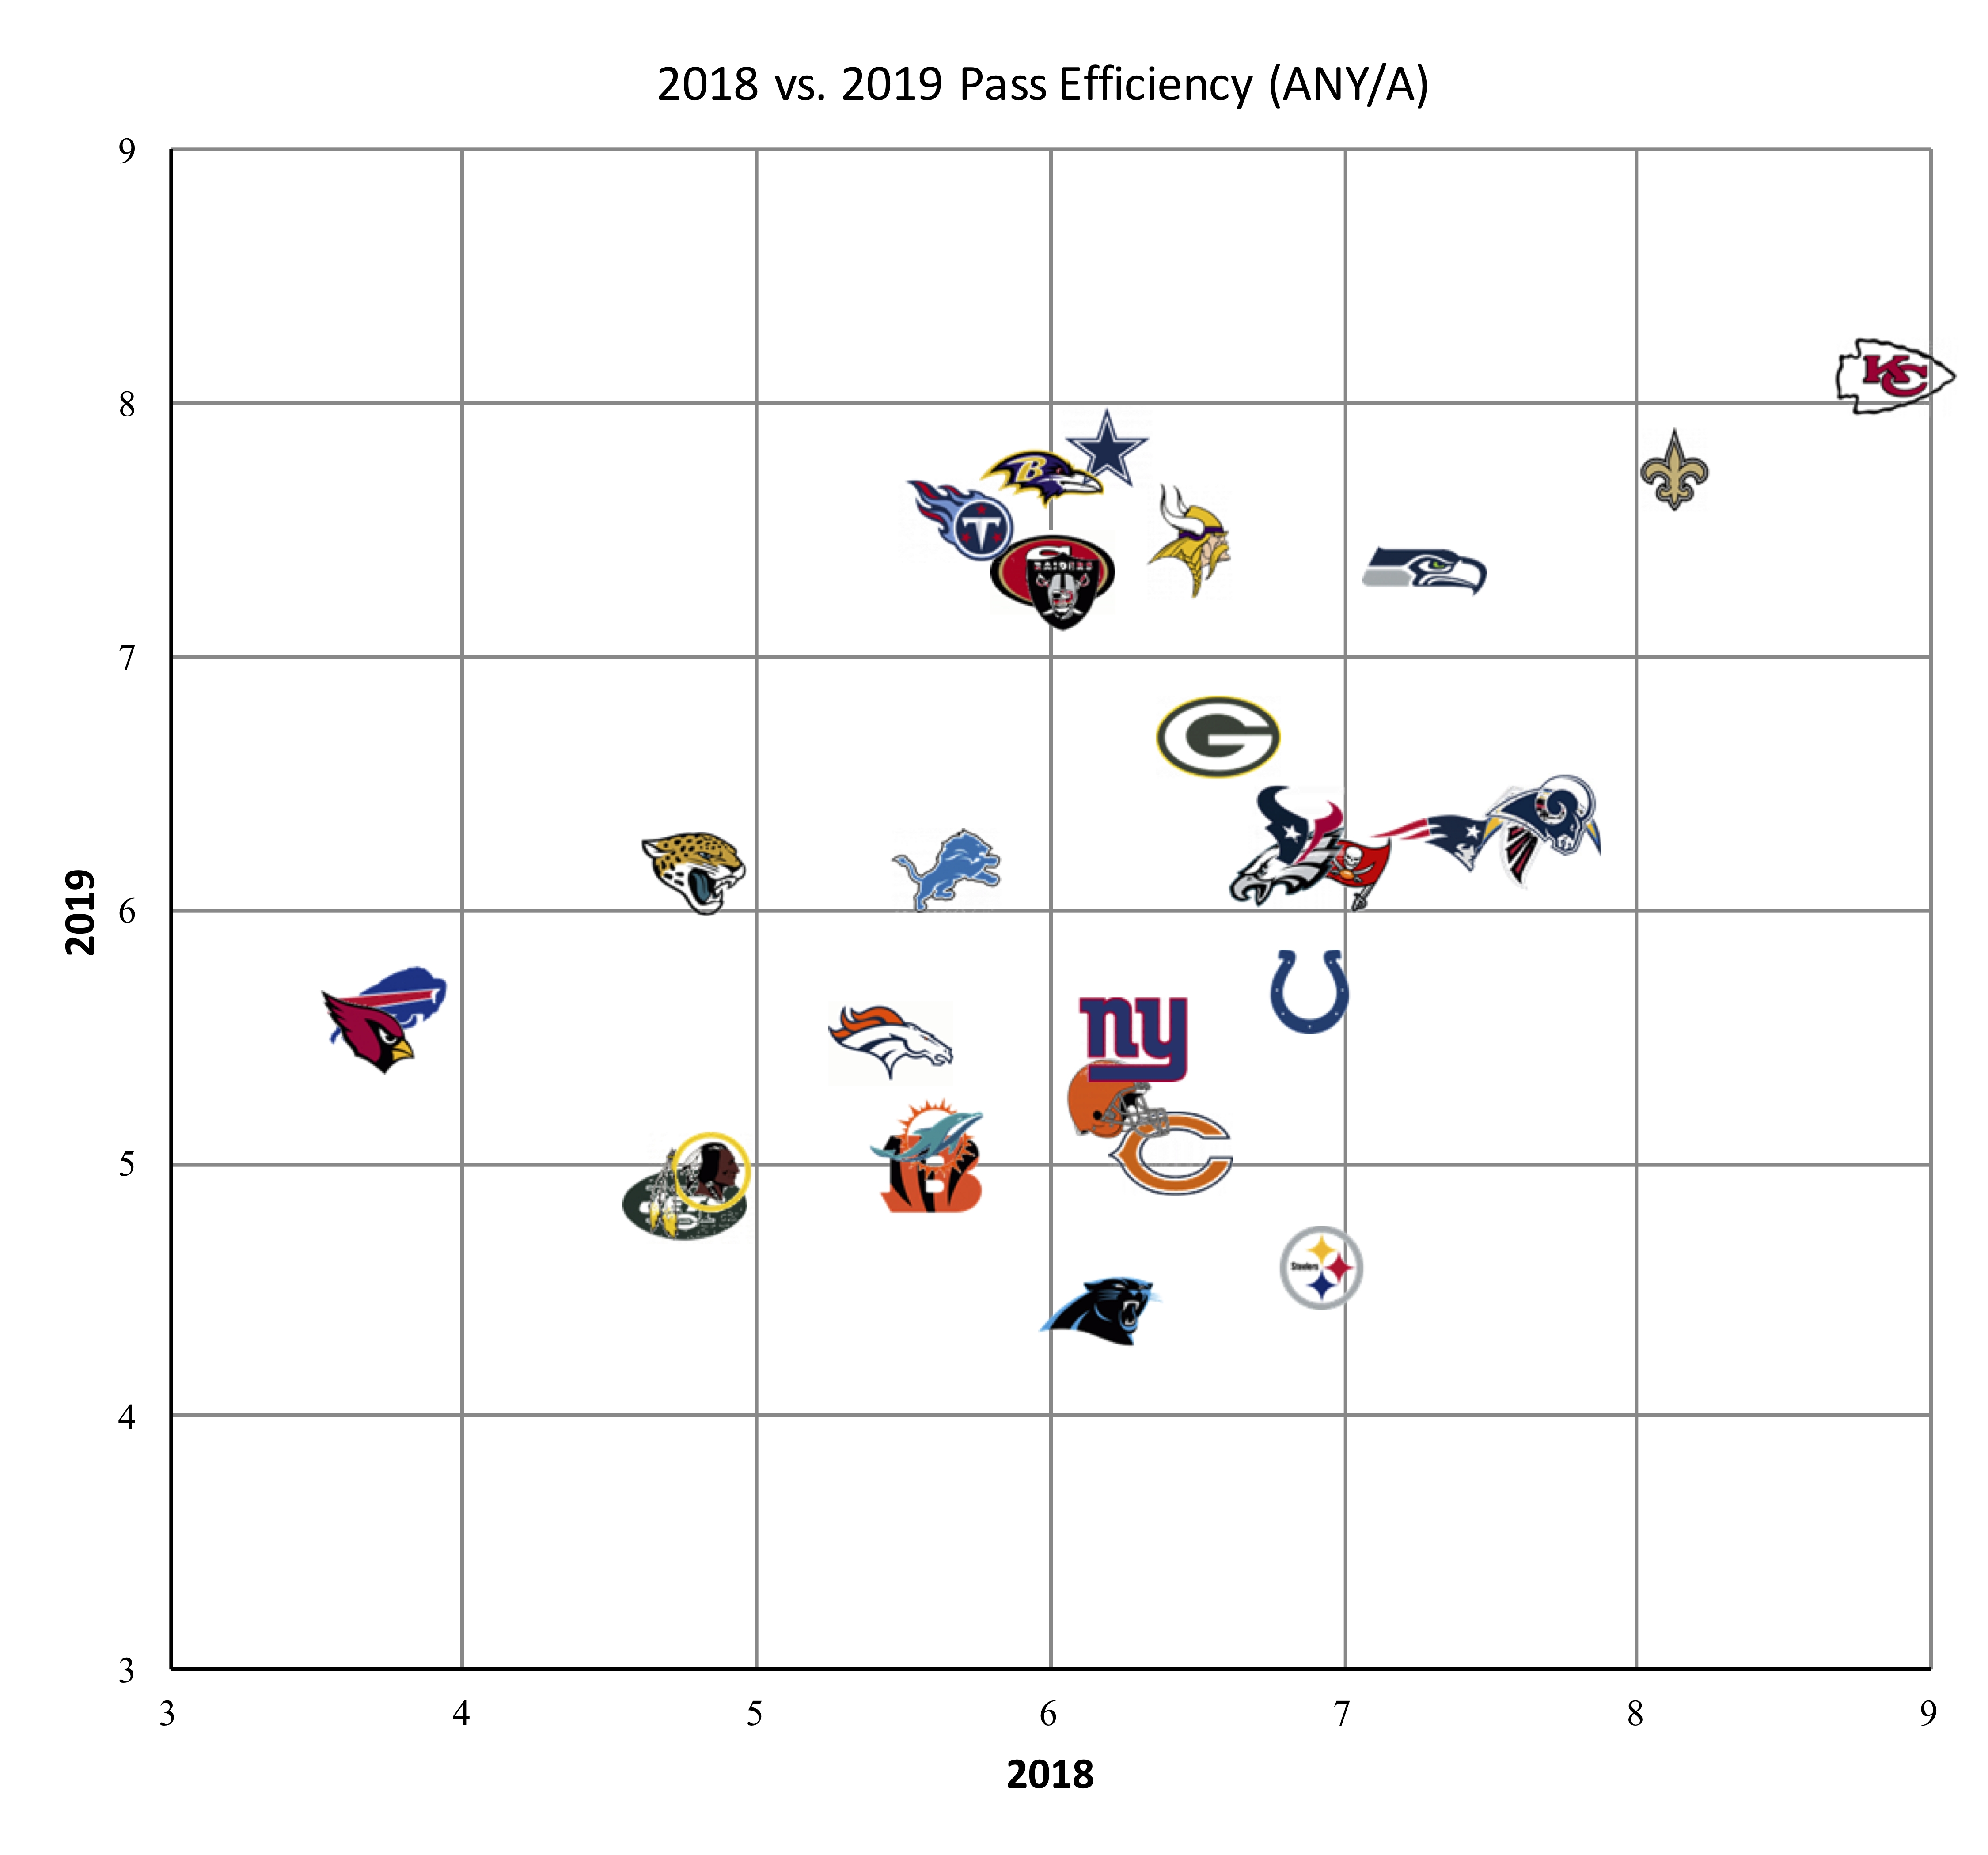
A big caveat here: much (all?) of the voting was done after the 2018 season, making this really the #NFL98. And the last two years help out Brees a lot more than they help Rodgers. Brees led the NFL in passer rating in 2018 and may do it again in 2019, while setting a new all-time single-season mark in completion percentage both seasons. Rodgers has fallen on relative hard times, by the standards of an all-time great.
At this point, it’s hard to argue for Brees not being in the top 10 all-time. He’s led the NFL in passing yards 7 times, touchdowns 4 times, and completion percentage 6 times. He’s also the all-time leader in both passing yards and passing touchdowns. Brees has also quietly moved into 4th all-time in career wins.
The knocks on Brees are threefold, at least when it comes to being a top-10 QB ever: he’s never won an MVP, he had just 1 All-Pro season, and has won only one title. He’s also 4th all-time in career losses. But the biggest knock is he was clearly not the best or second best QB of his generation, and he might even be the 4th-best QB of his era depending on how you rank Rodgers.
While Brees comes up short with the MVP voting Rodgers has two legendary, MVP seasons. He’s won a Super Bowl and been extraordinarily unlucky in the playoffs.
- In 2016, he staged an epic comeback with two Hail Marys on the final drive to force overtime, and then his team lost before he ever took the field again.
- The year before, his Packers failed to recover an onside kick at the end of the fourth quarter; Seattle scored a touchdown, Rodgers answered with a field goal drive, and then never saw the field in overtime in that game, either.
- In 2013, Rodgers led Green Bay on a field goal drive to tie the game. The 49ers responded by putting together a 14-play drive to take the final 5:06 off the clock and kicked a game-winning field goal on the game’s last play.
- Rodgers lost his first playoff game in one of the greatest passing matchups ever: he threw for 423 yards on 42 passes, produced 5 touchdowns, and the 45 points that produced was only enough to give the Packers a chance to go to overtime.
- The other three postseason losses on Rodgers’ resume came when the Packers allowed 37, 44, and 45 points.
Rodgers has the best passer rating of all time. He also has the best TD/INT ratio of all time. Both of those statistics, of course, are not era-adjusted, although his era-adjusted numbers are still outstanding. At the time of the voting, Rodgers has completed 8 full seasons and two half-seasons, with off-the-charts efficiency numbers. But he was clearly not Brady or Manning, and if you value volume, he wasn’t at Brees’s level yet, either.
With only three spots remaining, and two of the first 7 going to contemporaries, I think neither make the team.
Verdict: Neither. [continue reading…]