≡ Menu

Andrew Healy, frequent contributor here and at Football Outsiders, is back for another guest post. You can also view all of Andrew’s guest posts at Football Perspective at this link, and follow him on twitter @AndHealy.


For a stats guy, the Wells Report is gripping reading, particularly the appendices provided by the consulting firm Exponent. The conclusion there is pretty simple. Compared to referee Walt Anderson’s pregame measurements, the Patriots’ footballs dropped significantly further in pressure than the Colts’ footballs did. Therefore, even if Tom Brady’s involvement is unclear, a Patriots’ employee probably deflated the balls.

At first glance, that evidence seems pretty convincing, maybe even strong enough to conclude more definitively that tampering occurred. And it is kind of awesome that the officials even created a control group. But there is a problem with making firm conclusions: timing. As Exponent acknowledges, the measured pressure of the balls depends on when the gauging took place. The more time that each football had to adjust to the warmer temperature of the officials’ locker room at halftime, the higher the ball pressure would rise.

And, not surprisingly given the Colts’ accusations, the officials measured the Patriots’ footballs first. This means that the New England footballs must have had less time to warm up than the Indianapolis footballs. Is that time significant? We will get to that, but it does make for a good argument that the Indianapolis footballs are not an adequate control group for the New England footballs. Given the order of events, we would expect the drop of pressure from Anderson’s initial measurements to be lower for the Colts’ balls that had more time indoors at halftime. As the Wells report notes, the likely field temperature was in the 48-50 degree range, compared to the 71-74 degree range for the room where the footballs were measured.

So, how much lower? Here it gets a little fuzzy. The report is clear that the Patriots footballs were gauged first during halftime, but it is unclear about whether the second step was to reinflate the Patriots’ balls or to measure the four Colts’ balls. In Appendix 1 (see p. 2 of the appendix), Exponent notes “although there remains some uncertainty about the exact order and timing of the other two events, it appears likely the reinflation and regauging occurred last.” If events unfolded this way, it would make the Indianapolis footballs at least a better sort of control group. [continue reading…]

{ 34 comments }

Weekend Trivia: Supplemental Draft

Given that the NFL draft and the lead-up to the draft have become so remarkably over-exposed, is there anything about the NFL that is under-exposed at this point? Or at least not over-exposed? Maybe the answer is no, but today’s trivia questions at least look at the hidden part of the draft: the supplemental draft.

After producing Steve Young and Bernie Kosar in the 1980s, the supplemental draft mostly went dead at producing quarterbacks from 1990 until Terrelle Pryor in 2011. Who is the only quarterback that was drafted in the supplemental during that time?

Trivia hint 1 Show


Trivia hint 2 Show


Trivia hint 3 Show


Click 'Show' for the Answer Show

Just as only one quarterback was selected in the supplemental draft in the 90s, there was only one quarterback chosen in the supplemental draft in the 1970s. Can you name him?

Trivia hint 1 Show


Trivia hint 2 Show


Trivia hint 3 Show


Click 'Show' for the Answer Show

{ 6 comments }

Last year, I wrote a post on the plays that had the biggest impact on the eventual Super Bowl champion. These were the plays that affected the Super Bowl win probability by the biggest amount among teams that did not win the title. At the time, the Buffalo Bills were on the short end of the most influential play in the Super Bowl era. When Frank Reich put the ball down for Scott Norwood, I estimated that the Bills had a 45% chance on winning the Super Bowl. [1]Recent research by Chase suggests something similar. After the kick went wide right, the Bills’ win probability fell to zero. The 45 percentage point fall was the biggest change for a non-champion of any play in the Super Bowl era. Over 48 years, a bunch of plays fell in that range, but no team could point to a single play as having lowered its championship chances by so large an amount.

A couple weeks ago, that long-held record got broken kind of like Michael Johnson broke the 200-meter record in the Atlanta Olympics. Malcolm Butler’s pick obliterated the old mark. My estimate has the Butler interception as increasing the Patriots’ chances of winning by 0.87. There is no doubt that what some have called the Immaculate Interception is on an island by itself as the most influential play in NFL history.

To get that change in win probability from Butler’s play, I am going to assume that the Seahawks would have run on third and fourth down. I am going to give a run from the one a 60% chance of working. That might seem high, but the Patriots were the worst team in football in stuffing the run in important short-yardage situations either on third or fourth down, or down by the goal line. And their limited success mostly came against terrible running teams. It is not a huge sample, but against teams outside the worst quarter of rushing teams by DVOA, the Patriots had allowed opponents to convert 16 of 17 times with two yards or less to go for a first down or touchdown. If we add the playoffs, they actually had three more stops against good running teams (Baltimore and Seattle), albeit in games where the opponent had a good amount of success on the ground. [2]Note that the stop against Baltimore should not even count. In an otherwise great game for Gary Kubiak, he called for a reverse to Michael Campanaro on third-and-1 in the second quarter. The run was … Continue reading With Seattle being the best rushing team in football by a mile and the Patriots being at best not great in run defense in that situation, it seems hard to think that Seattle had anything less than a 0.60 chance of scoring on a run. [continue reading…]

References

References
1 Recent research by Chase suggests something similar.
2 Note that the stop against Baltimore should not even count. In an otherwise great game for Gary Kubiak, he called for a reverse to Michael Campanaro on third-and-1 in the second quarter. The run was stopped for a loss. The Patriots basically could not stop Justin Forsett, making the reverse call very unnecessary.
{ 31 comments }

The Patriots SRS rating has been inflated in the postseason

The Patriots true SRS rating is deflated if you only use regular season data.

It has always seemed a little strange to me that we think about the regular season and the playoffs separately when evaluating a team’s season. At least, that’s usually what happens in terms of the numbers. We think about a team’s regular season record and we think about where they were eliminated in the playoffs. A team’s Simple Rating System (SRS) rating is based just on their regular season performance. [1]Note that Football Outsiders’ DVOA does update for the playoffs. When we evaluate a team or a matchup, it might make more sense to think about their whole body of work including the playoffs when calculating ratings.

In the table below, I have calculated the SRS of Super Bowl teams according to Pro Football Reference’s (PFR) method that considers just the regular season. [2]It looks like I get the same numbers as PFR in a bunch of cases, but I have not checked all of them. In any event, it looks like my program works. I have also added adjusted ratings that include the playoff games leading up to the Super Bowl. These set of adjusted ratings help to identify the Super Bowls that were the closest and best matchups based on teams’ performances over the entire season including the playoffs. [continue reading…]

References

References
1 Note that Football Outsiders’ DVOA does update for the playoffs.
2 It looks like I get the same numbers as PFR in a bunch of cases, but I have not checked all of them. In any event, it looks like my program works.
{ 10 comments }

The physicist Werner Heisenberg (this guy, not this guy) found that observers affect the systems they attempt to measure, something that is related to but actually separate from his Uncertainty Principle. Even if Heisenberg was thinking about submicroscopic particles whizzing around, his ideas can still apply to writing about NFL betting. Writing about my bets could change the sequence of events that follow, at least in theory, just like all the other actions people take everywhere that put the world on a different course. The NFL season that just unfolded was just one of an infinite number of potential seasons that could have happened. In what share of the possible seasons did my pick for the NFL’s worst team start the season 9-1? Am I just the worst predictor ever, someone dumb enough to underestimate the great Arians and the new great HC of the NYJ? Or was I tempting fate by writing about real bets?

Since I am supposed to be a coldly-rational, data-driven guy, I am going to chance it and review my NFL betting this year. This is risky since my betting year could still be saved by events yet to be determined. Before I get to all that, I am hoping that maybe my writing about football can influence something much more plausible, namely whether I attend the Super Bowl next week. Apologies for this distraction, but I could really use some help.

***HUMBLE REQUEST BEGIN***

If you have read any of my stuff here or on Football Outsiders, you may know that I am a Patriots fan. Sufficiently dedicated to have flown from Los Angeles to Boston for the Ravens game, then back to LA for the first week at Loyola Marymount, before flying back to Boston for the Colts game. Now I am hoping to obtain two tickets to the Super Bowl. Here is what I can offer: [continue reading…]

{ 6 comments }
Brady likes the second half of the season

Brady likes the second half of the season

When we think about the most dominant teams of all time, the New England Patriots of the last few years don’t leap immediately to mind. Yet, their performance late in the year has been mind-bogglingly good. From 2010-13, New England went 29-3 in the final eight games of each season, a record that no other team since 1960 can match over any four-year period. Including their three games this year, the Patriots are on a 32-3 run in regular-season games in the second half of the season. From 2010-2013, the Patriots also have the biggest four-year point differential in second-half games in the history of football.

Part of that huge point differential comes from the higher point totals that teams have than they did in the past, and from New England’s offensive-centric philosophy. As a result, when we look at Pythagenpat records, the Patriots are not as dominant. [1]I used 0.251 as the value in the Pythagenpat formula to find exponents for each team-year. Here are the hundred best late-season teams over any four-year period, according to Pythagenpat record. The Patriots from 2010-13 rank only 38th on the list, behind four other recent Patriots’ runs, some of those overlapping with 2010-13. The Patriots have been great and it is an unlikely outcome that they’d have no Super Bowls in the decade so far, but they also have not been quite as strong in terms of their true strength as their second-half records would suggest. As a high-scoring team, we would have expected them to lose more of their regular season games than they have. [continue reading…]

References

References
1 I used 0.251 as the value in the Pythagenpat formula to find exponents for each team-year.
{ 3 comments }
Mike Smith, thinking about kicking or punting.

Mike Smith, thinking about kicking or punting.

With just under five minutes left in last Sunday’s game against the Giants and his team trailing 27-20, Mike Smith went for it on 4th and 1 from his own 29 yard line. As was the case on repeated 4th down attempts the last time his team visited MetLife Stadium to face the Giants, the decision to be aggressive did not work out well. Matt Ryan was sacked for a nine-yard loss that effectively ended the game. If his previous behavior is any guide, Smith may learn the wrong lesson from that outcome and choose not to go for it again when the next similar opportunity arises. Smith illustrates better than any other coach the potential for fourth down failure to lead to future fourth down timidity.

Before those two failed Ryan fourth down sneaks against the Giants in that 2011 playoff game, Smith actually was one of the more enlightened coaches on fourth down strategy. From 2008-2011, Smith was the third-most aggressive coach of the last twenty years, at least according to Football Outsiders’ Aggressiveness Index. Dating Smith’s turning point is a little tough. He got burned going for it in Week 10 of the 2011 regular season, when he tried a sneak on 4th and inches from his own 29 in overtime against the Saints. He punted in a couple of situations where he usually went for it late in the 2011 season, but then was aggressive closer in against the Giants. By the 2012 regular season, Smith hadn’t just abandoned his prior tendency for aggressive strategy. He entirely reversed it. In 2012, he was the least aggressive coach in football, only going for it once in 91 qualifying fourth-down tries. He was similarly passive in 2013. His fourth down decision last Sunday was surprising given that trend.

To see Smith’s evolution on fourth down strategy, consider his decisions on 4th and 3 or less when between the opponent’s 10- and 40-yard lines. To consider only situations where there was a real choice while keeping things as simple as possible, I look only at first-half decisions along with third-quarter decisions where the margin was ten points or less. [continue reading…]

{ 8 comments }

In the third quarter on Monday night, I texted my Patriots fan buddy Matt, “Is it possible that we suck? Maybe the run is finally over.” Bill Barnwell mused on this, and Aaron Schatz also wrote about it. It was hard not to think that, given the way the Patriots were manhandled by a mediocre team playing without several key players. It looked every bit as bad as the 41-14 score and maybe worse.

I remember the last time I wondered if the Pats were done. In a 34-14 loss to the Browns in 2010, the Patriots looked pretty impotent. In that game, as in the Chiefs one, the Pats had just under 300 yards of offense. Peyton Hillis ran over the Patriots. Of course, that wasn’t the end. Maybe this time is different, though. If anything the Chiefs game was even worse, so it’s possible this time really is the end. [1]And those Pats were 6-1 at the time of the loss to the Browns.

Will the Patriots offense be good later this year? To provide a little insight into this, I went back and looked at performance trends for quarterbacks who have had long careers. The first table looks at quarterbacks since 1969 who have the biggest single-season drops in adjusted net yards per attempt (ANY/A) from the previous five year trend. I look just at quarterbacks with at least 100 attempts in a season and I weight by the number of attempts when calculating the average ANY/A over the previous five years.

[continue reading…]

References

References
1 And those Pats were 6-1 at the time of the loss to the Browns.
{ 20 comments }

I am getting some well-deserved crap from people about just how bad my predictions have been so far. The Arizona Cardinals have already somehow outperformed the number of wins I gave them. The Jacksonville Jaguars, my pick to win the AFC South at 8-8, at one point in the game against the Colts had been outscored 112-13 over a stretch of about nine quarters. And my pick to win the NFC North at 14-2 could be 0-3 if Marty Mornhinweg let his head coach call the timeouts. [1]We are talking about the Jets here so they probably would have blown that game, anyway.

But I did win my first Stone-Cold Mega-Lock of the Week with my very comfortable tease of the Bengals and Falcons. So things are looking up and I’m taking that as license to check out some historical betting data for anything that might seem appealing after three weeks.

Last year’s Carolina Panthers are the inspiration for the analysis here. After three weeks, they were a 1-2 team with a big positive point differential. The Panthers last year lost 12-7 to Seattle and 24-23 to Buffalo before annihilating the Giants 38-0. Despite VOA liking the Panthers even after just three games, the betting market came around later in at least one way. The Panthers were at 3/1 to make the playoffs last year after three weeks, even though Football Outsiders had their playoff odds at over 50% at that time.

Is it possible that teams like the 2013 Panthers have historically been undervalued? It seems likely that Carolina was a little undervalued last year after three weeks. By looking at point spread data, we can see if teams that have likely been better than their records have been good bets in the early part of the season. Specifically, I’m going to look at whether betting on early-season underachievers (teams with deceptively poor records) or against overachievers has been profitable now and in the past.

Data and Methods

Feel free to skip this part, but here’s the background for those interested. I have put together Pro Football Reference’s point spread data for all games from 1979 to 2012. This sample is good enough for the tests of long-term and recent betting strategies that I want to do.

I’m going to look at betting outcomes in games 4-8 for teams that are either losing teams (winning percentage below 0.5) with strong Pythagorean records or winning teams with weak Pythagorean records. I will keep things simple and define Pythagorean wins here as:

Pythagorean Wins = (Previous Points Scored ^2.53)/(Previous Points Scored^2.53 + Previous Points Allowed^2.53)

In a continuing effort to avoid unnecessary complications, I’m just going to split the data up over time, looking separately at results before and after 2000.

Betting On and Against Pythagorean Outliers

Below is how you would have done over time if you bet on or against two kinds of teams:

  • Overachievers: Teams with winning records with bad point differentials for their records
  • Underachievers: Teams with losing records with good point differentials for their records

An overachiever is more specifically a team with a winning record that has a Pythagorean winning percentage at least 25 percentage points worse than their actual winning percentage. An underachiever has a Pythagorean winning percentage at least 25 percentage points better than actual.

YearsOverachieving TeamsUnderachieving Teams
1979-1999174-142-11 (55.1%)141-146-5 (50.9%)
2000-2012109-99-4 (52.4%)108-100-8 (52.0%)

The results show that, before 2000, you would have won most of the time betting on overachieving teams, teams that were not as good as their records would suggest. I was surprised by that and it even made me wonder if I made a coding mistake. I certainly expected that any tendency away from an even split would have been in favor of betting against teams with good records and relatively poor point differentials. Note that the even split occurred in the past for the underachievers, the teams with good point differentials and poor records.

More recently, the data come pretty close to an even split for betting both on the overachievers and the underachievers. Betting on the overachievers and the underachievers has been successful about 52% of the time since 1999.

So the overall message is that there is little value now or in the past in identifying Pythagorean outliers and either riding the teams with deceptively poor records or fading the teams with misleadingly good ones. In fact, the only pattern from the past suggested it was a good idea to ride the teams with misleadingly good records. I tried to check this out a bit to just see if it was just betting on teams with good records that was profitable, but betting on all teams with winning percentages over .750 has gone almost exactly dead even over time. It would be great to hear any thoughts you might have in the comments for this pattern. I feel like I’m missing something.

Overall, the message here is the one that we get most of the time if we try to find patterns that might lead to a consistently profitable and simple betting strategy. It just ain’t there. That doesn’t make this a bad post, though: as Chase once noted, an answer of “not useful” is often just as meaningful as any other answers.

The Stone-Cold (I Think There May Be a 60% Chance This Bet Will Win) Mega-Lock of the Week

So I am now 33% on my Stone-Cold Mega Locks of the Week. If I get the next two, I will be at 60%. If I get the next two after that, I’ll be at 71%. I kind of think I should be able to claim extra points already, Chris Berman-style, for my tease last week, since the Falcons and Bengals won by a combined 89-21 score that wasn’t that close. But I will instead put my faith in the always reliable larger sample size that will bear out these predictions living up to their title. [2]Note that no mega-lock promises were made on the season predictions.

Two-team teaser: Pittsburgh down to -1.5 and Indianapolis down to -1.5

This week, I like another two-team teaser of two home teams, this time down to 1.5 points. I particularly like the Steelers down to 1.5 points. I do not understand how they could be the same offense for quarters 3-8 of this season as they were for the other high-efficiency ones. Still, I like the Steelers (#10 in DVOA) at home against the Buccaneers (#32).

I’m a little less sure about the other side of the tease, where I have Indianapolis (#21) over Tennessee (#25). In fact, I mainly just wanted to get the Pittsburgh end of the tease. I may be getting that queasy-knees feeling come Sunday. It’s hard to feel that way about Andrew Luck, but I didn’t imagine I’d ever be going into the water tethered to a Ryan Grigson-led team.

Season record: 1-2

References

References
1 We are talking about the Jets here so they probably would have blown that game, anyway.
2 Note that no mega-lock promises were made on the season predictions.
{ 7 comments }

Here is graphic video of a famous football player performing an act of cowardly violence against a defenseless victim. The offender did not receive any penalty for his actions. After committing that crime, the assailant showed no remorse at the condition of the victim, who lay prostrate on the ground. Not disciplined for earlier acts of violence, that player struck again, this time paralyzing his defenseless victim. That victim would eventually die far too young, in part as a consequence of that attack.

For this perpetrator, the response was much worse than insufficient punishment or radio silence. Jack Tatum was celebrated for many of his hits, perhaps most notably the one on Sammy White in Super Bowl XI. The Ray Rice punch makes all of us cringe, but the hit on White―and even more so the one on Darryl Stingley ― should also make us cringe. [continue reading…]

{ 21 comments }

Betting Bad: Thinking About Uncertainty in Prediction

Barack Obama was not the only winner in the 2012 presidential election. Nate Silver, now founder and editor in chief of Five Thirty Eight, and other stats-y election forecasters basked in the praise that came when the returns matched their predictions.

But part of the praise was overstated. At the very end, Silver’s models essentially called Florida a toss-up, with the probability of an Obama win going just a few tenths of a percentage point above 50%. But because his model gave Obama the slightest of edges in Florida, his forecast in most of the media essentially became a predicted Obama win there. In addition to accurately forecasting the national popular vote, Silver then received credit for predicting all fifty states correctly.

I am all in favor of stats winning, but the flip side of this is the problem. If Obama had not won Florida, Silver’s prediction―which, like that of other forecasters such as Sam Wang of the Princeton Election Consortium, was excellent―would have been no less good. [1]This is a column about football, but you might want to check out some of the stuff through that link on the differences between Silver and Wang on the upcoming midterm elections. They both know way … Continue reading And if stats folks bask too much in the glow when everything comes up on the side where the probabilities leaned, what happens the next time when people see a 25% event happening and say that it invalidates the model? [2]Of course, maybe Football Outsiders has already run into that with the 2007 Super Bowl prediction. Perhaps sports people are ahead of politics on this stuff.

Lots of people have made this point before — heck, Silver wrote about this in his launch post at the new 538 — but it is really useful to think carefully about the uncertainty in our predictions. Neil has done that with his graphs depicting the distribution of team win totals at 538, and Chase did so in this post last Saturday. Football Outsiders does this in its Almanac every year, with probabilities on different ranges of win totals. [continue reading…]

References

References
1 This is a column about football, but you might want to check out some of the stuff through that link on the differences between Silver and Wang on the upcoming midterm elections. They both know way more than I do, but for the small amount that it is worth, I lean more towards Wang on this one.
2 Of course, maybe Football Outsiders has already run into that with the 2007 Super Bowl prediction. Perhaps sports people are ahead of politics on this stuff.
{ 12 comments }

Red Zone Diaries: Week 1 Review

Football is back. Oh my goodness gracious. Football is back.

The return of football also means the return of TV’s greatest channel and one of the five most important innovations of the 21st century. The Red Zone Channel has simultaneously rendered obsolete commercials, bad games, bad moments of good games, and halitosis. Let’s celebrate with a running diary. Below is what I was thinking as I watched the RedZone through the early games on Sunday.

Allow me to make one gambling note right off the bat. My stone-cold mega-lock of the week was a two-team tease of the Raiders (to +11.5) and the Bears (to -1). I feel completely queasy about the Bears part of this bet. I’m sticking with it, but every instinct in my body is crying out: “Why take Jay Cutler down to 1 point when I can take Peyton Manning down to 2? You know you will regret this.” So if I sound extra emotional about Raiders-Jets and Bills-Bears, that’s why.

One more note: I was writing this as the games were still going on so the time is approximate in some cases. You can pick most of those out by the times that are whole numbers that end in :00 or :30.

Week 1 Red Zone Diaries

Pregame: Ten years of redzone? I didn’t know about this until 2010 or so. Clearly I am getting old. Maybe I’m remembering that wrong, anyway, since I am getting old. Oh so good to see Andrew Siciliano. Is it possible he’s the median man in America? Dark hair, white, average handsomeness, only his ears seem anything other than completely average. If he’s the median man, here’s the Andrew Siciliano of restaurants and the Andrew Siciliano of American incomes. [continue reading…]

{ 4 comments }

Which team will be the biggest surprise in 2014? Last year, the Houston Texans shocked Vegas and analytics fiends alike. Before the season, the Texans’ over/under win total was 10.5. Football Outsiders Almanac projected them to have 9.3 wins and gave them a 67% chance of making the playoffs. Basically nobody saw the 2013 Texans’ implosion to 30th in DVOA coming. Interestingly, though, the Texans are part of a larger trend in the kinds of teams that have been having enormous drop-offs in performance.

Consider the graph below. It looks at the change in DVOA for good-but-not-great teams, those that ranked between 6th and 15th in the previous year. [1]Before 1989, I use Andreas Shepherd’s estimated DVOA. I thank him for sharing his data.

AH Fig 1

Historically, the good-but-not-great teams have regressed a little bit. From 1985 to 2010, those teams dropped on average between two and four points of DVOA. The trend was relatively stable for each five year period. While we would expect some regression from good teams, the size of that regression has changed since 2010. Over the last four years, the good-but-not-great teams have dropped an average of ten points of DVOA, the biggest regression by far since the merger. Note that if we drop 1983 to account for regression coming out of the strike-shortened 1982 season, we get a DVOA change for 1980-1984 of about four points of DVOA, making 2010-2013 even more clearly on its own island. This idea leads into my first prediction for the season. [continue reading…]

References

References
1 Before 1989, I use Andreas Shepherd’s estimated DVOA. I thank him for sharing his data.
{ 30 comments }

Projecting Success for New Head Coaches

In 1995, Football Outsiders graded the Eagles special teams as the worst in the NFL. The next two years, Philadelphia ranked 20th and 26th, respectively. In 1998, after hiring a new special teams coordinator, the team still finished just 25th. But, over the next eight years, the Eagles’ special teams flipped dramatically, ranking as the second-best in football during that period. In fact, from 2000-2004, Philadelphia ranked in the top five in the Football Outsiders’ special teams ratings each season.

When the Ravens hired the coordinator of those special teams, John Harbaugh, as their head coach in 2008, Baltimore turned one of the more surprising coaching hires in recent history into one of the best. Based on where the team was when it hired him, Harbaugh’s first three years were about the best since 1990 of any coach not named Harbaugh, at least according to DVOA. The Ravens made the playoffs in Harbaugh’s first five seasons, winning the Super Bowl in the last of those. Harbaugh’s success even caused Chase to wonder whether it would change the way teams hired head coaches.

Since Harbaugh was so successful as a coordinator, does that mean he was a good bet to be a successful head coach? At first glance, you might think just about every coordinator who gets promoted or poached to become a head coach was very successful in his previous job. As it turns out, that’s not always the case. Once we correct for expectations, a little more than one in four hired head coaches actually underperformed in their previous jobs, at least according to DVOA.

Consider one man who performed particularly poorly as a coordinator: Eric Mangini. The 2005 New England defense had a DVOA that was 15.2 points lower than we would have predicted based on the Patriots’ performance in the preceding seasons. He was not so much of a (Man)genius to have a good defense in 2005, and that may have given some hint that he was not the greatest bet to succeed as a head coach, either. [1]Always a bonus when painful Jets memories come up organically. There are always other coaching greats like Joe Walton for Jets fans to remember fondly, at least for epic nasal invasions.

This leads to an obvious question: on average, have teams done better when they have hired head coaches who were actually good in their previous jobs (either as coordinators or head coaches)? Let’s take this to the data. [continue reading…]

References

References
1 Always a bonus when painful Jets memories come up organically. There are always other coaching greats like Joe Walton for Jets fans to remember fondly, at least for epic nasal invasions.
{ 10 comments }

Prop Joe’s Favorite NFL Prop Bets

I think I’m one of eight billion people who love “The Wire” and “Breaking Bad.” Those are the two best TV shows I’ve seen and it isn’t particularly close. [1]“Seinfeld” is all alone in third with a pretty big gap after that, too. “The Wire” had an amazing volume of unforgettably vivid characters. Below is my list of memorable “Wire” characters. To be a real test of unforgettableness, it’s got to be off the top of my head, so I’m sure I’m going to forget somebody, but here goes and I’ll include the first thought that jumps to mind:

Omar (“man’s gotta have a code”), Bunk (“f***”), McNulty (“f***”), DeAngelo (library), Stringer (mastermind), Avon (winner), Brother Mouzone (bow tie), Cedric (good posture), Garcetti (that’s actually the mayor of LA, I mean the Baltimore mayor), Clay Davis (“sheeeeeet”), Bunny (“New Hamsterdam”), Keisha (car chase scene), Lester (wood carving), Bodie (corner), Prop Joe (large), …

Ah, Prop Joe. Prop Joe was a very large and very reasonable drug kingpin. His name apparently stemmed from saying “I’ve got a proposition for you,” so we could certainly see him getting into prop bets. So, in honor of Prop Joe, I’ll cover some intriguing season prop bets. [2]The actor who played Prop Joe, Robert F. Chew, sadly passed away in January 2013. Most of these bets are only available online, which continues to be a legal gray area. Like Prop Joe, I would never directly touch anything slightly questionable, so I will be referring to bets made by my good friend Rawls. [3]Definitely not this Rawls who is the enemy of all that is good. We’ll start with his favorite prop bet for 2014 and go from there in descending order.

Rawls’s Prop Bet #1: $76 On Any Team To Win at Least 14 Games (Odds: 3/1)

At first glance this bet seems to have a lot of merit. Since the 1987 strike, at least one team won 14 games 15 out of 26 times (57.7%). In the last 15 years, it’s even better, hitting 10 out of 15 times (66.7%). The bet only needs to win 25% of the time to break even, so this looks fantastic.

But Chase brought up a point that Rawls missed: schedule strength. The years without a 14-game winner in the last 15 years include 2012 and 2013. Rawls dismissed that as a blip, but it comes in part from two of the best teams in football playing in the same division. Moreover, the last run of years without a 14-game winner (1993-1997) also happened during a time of NFC dominance, at least until ‘97. The Cowboys played the Packers and Niners every year during that span, for example. This season, the best teams in football may have it even tougher. The Niners and Seahawks have to play each other twice, and each has one of the four hardest schedules in football this year. The Broncos get the NFC West, the Saints have the sixth-hardest schedule, and the Packers have above-average schedule strength. Only the Patriots have an easy schedule amongst the main threats to win 14 games. [continue reading…]

References

References
1 “Seinfeld” is all alone in third with a pretty big gap after that, too.
2 The actor who played Prop Joe, Robert F. Chew, sadly passed away in January 2013.
3 Definitely not this Rawls who is the enemy of all that is good.
{ 8 comments }

Not Tim Couch

Not Tim Couch.

The preseason is meaningless, right? Well, as it turns out, it might give us a window into quarterback development, despite what you might think. The threshold for whether the preseason is useful is whether including that information tells us anything about a quarterback’s potential that we don’t already know from his draft position (or perhaps certain analytics). I have been putting together data from preseason box scores going back to 1997. The data show that, for some quarterbacks, the preseason is not quite meaningless.

Neil Paine showed some interesting evidence relating to this idea on Friday. Looking at team performance since 2009 for teams with new quarterbacks, Neil showed that preseason passing efficiency helps predict regular season passing efficiency. It’s important to note that part of this result may have been pretty predictable even before we watched those preseason games. The 2012 Redskins replaced Rex Grossman and John Beck with the #2 pick in the draft who would have been #1 in an average year. So we would expect a big improvement to come just by way of moving from Grossman to a healthy RGIII. [continue reading…]

{ 12 comments }
Gronk can catch, block, and spike. But can he do all that without getting injured?

Gronk can catch, block, and spike. But can he do all that without getting injured?

In the 2011 AFC Championship Game against the Ravens, Bernard Pollard happened to Rob Gronkowski. And the Patriots offense ground to a halt for the rest of the game before being held to just 17 points in the Super Bowl. [1]Yes, a very limited Gronk played in SB XLVI, but he had only two catches and jumped like me when battling Chase Blackburn on Brady’s underthrown fourth quarter pick. In 2012, it was a freak injury on an extra point and then a reinjury in the divisional playoffs against the Texans. After that, the Patriots offense put up only 14 against the Ravens in the 2012 AFC Championship Game. Last year against the Browns, he took one of those horrible hits that make you cringe and want to keep him away from running seam routes in any regular season game. [2]The link is of Gronk shopping for groceries instead of the hit, because who wants to see that again? And the Pats put up 16 points against a mediocre and banged-up Broncos defense in the AFC Championship game. [3]The only two games all season where the Broncos gave up fewer points were against Houston and Oakland.

The Gronkowski injuries provide a tantalizing set of what-ifs. The Patriots have been within two games of a title the last three years. A healthy Gronkowski could have made the difference in any of those years. The Football Outsiders’ Almanac shows that the Pats’ offense was actually pretty good late in the season without Gronk, but they were terrible early in the year―they actually had a negative DVOA without him. Over the last two regular seasons, the Pats have averaged 34 PPG with Gronkowski, but six points fewer in New England’s 14 Gronk-less games.

And as much as I believe in stats, I’m not sure we really need them to tell us that Gronkowski is one of the most important non-quarterbacks in football. If he’s healthy through the playoffs, the Patriots seem likely to be neck-and-neck with the Broncos. With a defense that may be one of the best in football, I’d argue that the Pats should be a little better than the Broncos, even. [4]Unless Manning is just much better than Brady, I guess. I’m not seeing that. Denver’s only other big advantage is at receiver. Fine, but a healthy Gronkowski seems to even up a fair bit of that. … Continue reading Regardless, the Pats offense has been uniformly excellent with a healthy Gronkowski since 2010. Taking just the games where Gronk played, the Pats have ranked 1st, 3rd, 1st, and 2nd in offensive DVOA over the last four years.

That means one of the most important questions in the NFL in 2014 is whether we’ll see a healthy Gronkowski through the end of the season and into the playoffs. At this point, I think the reflexive answer is to assume that the answer is “no.” It certainly doesn’t feel like he’s going to be healthy. But previous examples of players getting hurt can provide some insight into Gronkowski’s actual chances.

Recovery for Injured Young-and-Excellent Players

In his second year, Gronkowski had an Approximate Value (AV) of 14. He then played only parts of the next two seasons due to injury. Considering players who started their careers since 1970, there have been 34 who had an AV season of at least 13 in their first two years and who then did not start at least 25% of the games in the following two years. This is a reasonable list of young-and-excellent players who then missed significant time in years 3 & 4. Most of these players missed time due to injuries, although some of those cases were a bit debatable. [5]In addition, I omitted two players who were obviously benched for other reasons: Shaun King and Derek Anderson. And Joe Cribbs, who went to the USFL for the fifth year of his pro career. Regardless, the conclusions are pretty much the same if we drop some of those cases. [continue reading…]

References

References
1 Yes, a very limited Gronk played in SB XLVI, but he had only two catches and jumped like me when battling Chase Blackburn on Brady’s underthrown fourth quarter pick.
2 The link is of Gronk shopping for groceries instead of the hit, because who wants to see that again?
3 The only two games all season where the Broncos gave up fewer points were against Houston and Oakland.
4 Unless Manning is just much better than Brady, I guess. I’m not seeing that. Denver’s only other big advantage is at receiver. Fine, but a healthy Gronkowski seems to even up a fair bit of that. And then there’s Brandon LaFell’s impending record-breaking season. I’m about to get shouted down. [Chase note: I don’t know how much longer I can stomach Andrew writing for Football Perspective.]
5 In addition, I omitted two players who were obviously benched for other reasons: Shaun King and Derek Anderson. And Joe Cribbs, who went to the USFL for the fifth year of his pro career.
{ 6 comments }

Some teams, like the Rams have done a good job of fielding a very young roster; others, like the Raiders, have made a conscious effort to head in the other direction. Overall, the Rams are more representative of the current trend. NFL teams have made a shift towards younger players in the last three years, although you might be surprised by just how dramatic and sudden the change has been. The drop in Approximate Value (AV)-weighted ages of NFL rosters in the last three years is more than 50% larger than in any other three-year period in NFL history.

healy 1

Looking at the graph, there are two seismic shifts that changed the age distribution of the NFL in the Super Bowl era: the increase that started in the late ‘80s and the decrease in the last five years. These changes tell us about how changes in the collective bargaining agreement can change the NFL landscape in both subtle and dramatic ways.

First, the increase in NFL roster age in the 1980s coincides pretty closely with the introduction of Plan B free agency in 1989. It looks like the increase maybe starts a year too early. Remember, though, that the 1987 age may be skewed a bit by the three games with replacement players. Taking that point in mind, the increase from 1988 through 1993 coincides exactly with the introduction of limited free agency. [continue reading…]

{ 15 comments }

In the Super Bowl era, there has been just one team that was both the youngest in the league and one of the five best teams in football: the 2012 Seattle Seahawks. As friend of Football Perspective Neil Paine recently pointed out, being young and great has historically been a good predictor of teams that have become dynasties. Consider the table below. It captures every team since 1966 that ranked amongst the five youngest teams by Approximate Value (AV)-weighted age and had at least 12 Pythagenpat wins, adjusting everything to a 16-game schedule. [1]My AV-weighted age calculations are very similar to Chase’s, but not always exactly the same. For example, I have Seattle third in 2013, while he has them second. We both had Seattle at 26 years, … Continue reading

TeamYearPyth WinsAV-wtd ageAge Rank
PIT197213.525.65
DAL199212.626.42
DAL199312.426.74
STL199914.226.65
CHI200112.426.55
SDG200612.626.55
IND200712.826.74
SEA201212.625.81
SEA201313.1263

There are seven unique teams on this list, not counting the two repeaters. When trying to predict what’s going to happen with the Seahawks, there are two different ways to look at this list. The first looks good for their dynasty potential. The first two teams on the list, the ’72 Steelers and the ’92 Cowboys went on to win multiple Super Bowls. The closest comparison in terms of age also looks pretty good. Teams used to be younger, so the best comparison probably isn’t the ’72 Steelers, who were even younger by age but were only the fifth-youngest team in 1972, but the ’92-’93 Cowboys. They are the only other team on this list to be so young and so good.

Of course, even the Cowboys had a pretty short run. Their stay at the top was nothing like the ’70s Steelers or ’80s Niners, who were also quite young. [2]They were the third-youngest team in 1981, their first championship year. Free agency helped to minimize their time on top. The ’90s Cowboys were the first great team in the free agency era. Players gained full freedom of movement only in the year after their first Super Bowl. Plan B free agency allowed limited movement starting in 1989.

Free agency and the salary cap help to explain the path of the other four teams on the list. They point towards a more cautious prediction about the Seahawks’ dynasty hopes. Between them, the ’99 Rams, ’01 Bears, ’06 Chargers, and ’07 Colts won one Super Bowl and played in two others. Within three years of their great-and-young season, only the Chargers were significantly better than league-average.

These more recent examples may do a better job of predicting the Seahawks future success. Before the beginning of full free agency in 1993, good-and-relatively-young teams appear to have generally followed a clear and sustained upwards trajectory over the long term. Since then, however, success has generally been less sustainable. The table below looks at teams’ strengths over time according to PFR’s Simple Rating System. [3]I thank Bryan Frye for sharing his SRS dataset. Here I’ve made the cutoff any team that was in the five youngest teams in a given year and also had a SRS rating of at least 6. The table shows the trend in strength for the previous season and the following three seasons.

TeamYearSRS (t-1)SRS (t)SRS (t+1)SRS (t+2)SRS Wins (t+3)AV-wtd ageAge Rank
PIT1972-3.6108.26.814.225.65
BAL1975-8.78.69.85-8.825.95
SFO1981-6.26.2-2.48.712.725.83
NOR1987010.11.54.6-1.3264
DAL19924.49.99.610.19.726.42
Average-2.828.965.347.045.325.943.8
TeamYearSRS (t-1)SRS (t)SRS (t+1)SRS (t+2)SRS (t+3)AV-wtd ageAge Rank
DAL19939.99.610.19.72.426.74
IND1999-5.46.17.9-3.81.225.61
STL1999-2.311.93.113.4-3.326.65
IND20006.17.9-3.81.2726.33
CHI2001-6.37.9-5.3-3.5-8.226.55
BAL2003-2.16.36.1-1.89.326.43
IND20031.2711.410.85.926.54
SDG2004-6.89.19.910.28.826.52
BAL20046.36.1-1.89.3-6.726.73
SDG20059.19.910.28.8526.85
JAX20064.87.56.8-2.5-6.526.52
SDG20069.910.28.856.626.55
SDG200710.28.856.64.826.42
IND20075.9126.55.92.926.74
SEA20120.812.21325.81
SEA201312.213263
Average3.349.095.864.952.0926.413.25

One surprising pattern in these data is just how infrequently young teams won in the past. From 1966-1992, only five teams were among the five youngest and still had an SRS of at least 6. Since 1993, it’s happened 16 times. In the past, teams had more of an opportunity to gradually build strength. So it looks like there was a greater share of young teams building for something and old teams trying to stay on top. Since 1993, the standard deviation of team ages is about 20% smaller than it was before that. In the last ten years, the standard deviation is about 30% smaller than it was before 1993. The ages of rosters are more compressed than they used to be.

The other thing to take away from these tables is the dropoff in years 2 and 3 since full free agency. For the pre-1993 teams, the good-and-young teams held much of their value. After starting at an average SRS of 8.96, they were still at 7.04 two years later and then 5.3 three years later. Since 1993, teams have deteriorated more quickly. From an average of 9.09, the more recent high quality young teams fell to 4.95 two years later and all the way to 2.09 three years later.

Since there are only five teams in the pre-1993 group, we want to be careful with interpreting too much into the earlier data. It’s possible that the ’72 Steelers and ’81 Niners are anomalies. At the same time, the success three years later is skewed downwards by the ’75 Colts, who would have been much stronger in ’78 if they had a healthy Bert Jones.

With the bigger set of more recent teams, the clear takeaway is that in the current era, even very good and young teams are just slightly better than average than three years later. The Seahawks may buck this trend, but they probably won’t. With Russell Wilson to sign and long-term cap hits for players like Richard Sherman and Earl Thomas, they’re more likely to have a brief run than a long one.

Another alternative may be available, though. If Wilson makes the leap into the Brady-Manning class (he may) and Pete Carroll turns out to be a truly elite coach (also possible), they may be able to fashion a New England-kind of dynasty. That sort of dynasty is not really built on youth. Consider the aging patterns of the last five teams of the decade.

healy age

The ‘60s Packers, ‘70s Steelers, ’80s Niners, ‘90s Cowboys all showed the same pattern of being relatively young and then progressively aging during their runs. On the other hand, the Patriots show an entirely different pattern. They’re the only dynasty to actually not age as their run progressed. They started old and stayed old through their Super Bowl years. While the Seahawks are starting off younger than those Patriots teams, excellence at QB and coach still offers them their best hope of building a dynasty in the current NFL. The benefits of being young and good are much more fleeting than they used to be.

References

References
1 My AV-weighted age calculations are very similar to Chase’s, but not always exactly the same. For example, I have Seattle third in 2013, while he has them second. We both had Seattle at 26 years, but I have Cleveland also at 26, instead of 26.1.
2 They were the third-youngest team in 1981, their first championship year.
3 I thank Bryan Frye for sharing his SRS dataset.
{ 12 comments }

Not-Entirely-Awful NFL Futures Bets

In the 1990s, there was a hedge fund called Long Term Capital Management that almost brought down the world economy. LTCM made enormous bets on very arcane things such as the spread between two kinds of bonds. Their whole reason-for-being was that they would find small inefficiencies in prices and borrow like crazy to take advantage of those brief opportunities. Other hedge funds did similar things, but these guys thought that they were smarter than everyone else. And, to some extent, they may have even been right. But they were also a little contradictory. What made this hedge fund interesting was not just that it employed two Noble Prize-winning economists, but two who made their name arguing that markets for financial assets were efficient. If their research was right, the inefficiencies on which they were betting should not have existed in the first place.

Now, these guys are way smarter than me, but you may have noticed that I recently wrote about how the NFL betting market appears to be pretty efficient. If that’s right, there shouldn’t be any chances to make profitable NFL bets. If the prices are right, all I’m doing is paying the commission every time I make a bet. Like the guys at LTCM, however, I think I’m smart enough to find bets that are mispriced and that offer some opportunity to make money. I’m probably overconfident and wrong about that, but it’s too much fun to try. And if I fail, which the LTCM guys spectacularly did when some of their billion dollar bets went wrong, at least the implications will not send shock waves to central bankers in Peru.

Bets I Sort of Liked But Decided Not to Pull the Trigger On

There were a series of bets on season win totals that I liked but decided did not quite make sense in the end. Some of the reasons were hard-headedly analytical and others were more visceral. Most notably, I couldn’t commit actual dollars to betting on Ryan Fitzpatrick, even though I came pretty close. [continue reading…]

{ 11 comments }

A few days ago, I was in Vegas with friends and without a car. So I took the chance to shop NFL futures odds to the extent that I felt it was worth it to walk to a given sportsbook. I decided the 3+ mile walk to the Superbook was not worth the opportunity cost in the 105 degree heat, so I didn’t get their numbers. But I did get numbers from three of the major oddsmakers: William Hill, Cantor Gaming, and MGM. Tomorrow, I’ll talk about some bets that seem potentially attractive. As I described recently, the numbers are pretty good now and don’t leave obvious opportunities for the most part, I think.

Yes, I still did like some bets. I only found one season win total I really wanted to bet on, and it’s not one of the ones I would have bet back in March. I made a few bets at the William Hill sportsbook, just a little hole in the wall at the Hooters’ Casino a little ways off the Strip, which could just as easily have been in Nevada towns forgotten by time like Laughlin or Mesquite as in Las Vegas. Then I made a few bets not too far from the beautiful people at the Cantor book in the Cosmopolitan. I spent way too much time thinking about all this stuff, which might not have been necessary if I only had that time machine and could have bet on the initial lines. But there’s also some cool stuff by looking at the teams’ odds that have changed the most in both directions.

Season Win Totals

Some interesting movements have happened in the numbers that Cantor Gaming released in March. Those changes reflect everything that happened in free agency and the draft, but also maybe some numbers that people would have bet on anyway even if nothing had changed personnel-wise.  Below are the opening numbers along with the numbers I gathered during the last week. The Cantor numbers are mostly from 6/18 because their books that I went to would only give me the numbers one at a time. I gathered about eight of those numbers because I was at least considering them as wagers. For those teams, the most recent line is the one that I posted. The other companies’ books gave me complete printouts of all their season win-total lines.

A note on the odds: Lines like -140 mean that you would wager $140 to win $100. Lines like +130 mean you wager $100 to win $130. The numbers are usually split by 20 on either side, which represents the vig, or Vegas’s commission. For example, Denver being at -115 for the over would usually go with -105 on the under. For bigger odds, the over and under can be split by more. Also, the MGM has a slightly larger vig, with a 30 split between the over and under. [continue reading…]

{ 2 comments }

The Smarter (Sigh) Football Betting Market

Economists (I am one) have historically been trained to believe in the efficiency of markets. The simplest way to think of this is that market prices capture all relevant information. Of course, this is sometimes not quite right, or even close to right. All the mortgage-backed securities that helped bring down our economy were horrendously mispriced, for example, despite lots of people seeing the warning signs. Even then, people betting against those securities provided information about their true value. They were just drowned out for too long by people clamoring to buy that worthless stuff.

The sports betting market, though, is a case that we might actually expect to work better. Unlike mortgage-backed securities, everyone making a wager in Las Vegas is incentivized to get the price right. There’s nobody who’s pushing a bad wager on their clients, for example. [1]These perverse incentives have been going on a long time, too. Check out Michael Lewis’s Liar’s Poker for fascinating stories of investment bankers pushing junk on their clients. Therefore, we might expect efficient markets to mostly work in Vegas and that the odds would converge to the correct number.

Mostly, it seems like that’s what’s going on. Whatever information is not contained in the initial odds may be quickly corrected as people swoop in to take advantage. I’ve experienced this first-hand. Last year, I went to Vegas about a week after the first season win-totals for 2013 came out. I found the numbers online and came up with this list of wagers I was interested in. [continue reading…]

References

References
1 These perverse incentives have been going on a long time, too. Check out Michael Lewis’s Liar’s Poker for fascinating stories of investment bankers pushing junk on their clients.
{ 18 comments }

Previewing the World Cup by NFL Divisions

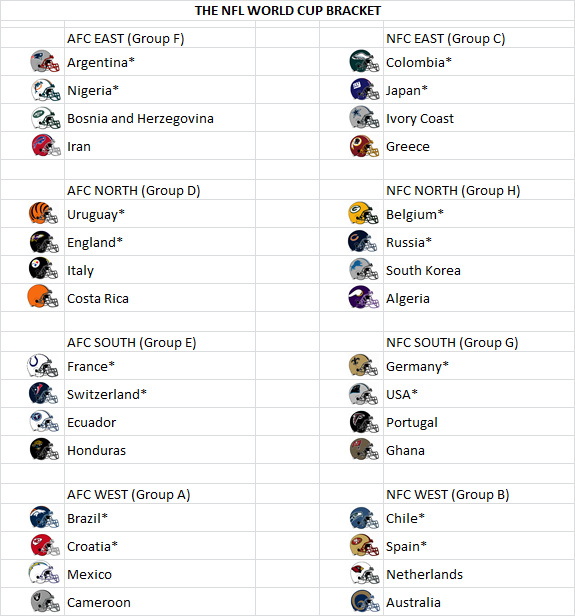
The Super Bowl is a football competition decided by a series of single-elimination playoff games played after 32 teams attempt to qualify from eight groups of four teams each. That’s the World Cup, too!

And just like the NFL, there are some not-so-good AFC South-ish groups and some very good NFC West-like groups. So let’s assign each World Cup group its doppelganger of an NFL division, and then every team to one of the NFL teams in that division.

That gives us our NFL World Cup Bracket. The AFC South is Group E, which contains no great team and at least one candidate to be the Jacksonville Jaguars of the World Cup. The NFC West is Group B, which has three legitimate contenders to win the whole thing, one of which will not even make it out of the group.

Each team is listed in its predicted order of finish within the group according to my highly scientific NFL-based World Cup prediction machine. Teams with a * are predicted to advance out of the group.

NFL WC Bracket [continue reading…]

{ 19 comments }

Bush played with some talented teammates at USC.

Bush played with some talented teammates at USC.

Last week, I wrote about whether having great college teammates might cause quarterbacks and wide receivers to be overvalued in the NFL draft. The results were inconclusive on the impact of teammates on quarterbacks, but they indicated that wide receivers who played with first-round QBs in college tended to underperform in the NFL relative to their draft position. Receivers such as Mike Williams of USC (#10 in 2005) and Marcus Nash of Tennessee (#30 in 1998) may have gone too high in the draft in part because they played with great college QBs who made them look good.

Today, I look at running backs drafted since 1984. I use a slightly different way of looking at the data that I think is a little better. I also revisit the QBs and WR/TEs with that method. Instead of considering the number of first-round college teammates that a player has, I consider the total draft value of college teammates at different positions, as determined by Chase’s chart. [1]I thank commenter Stuart for suggesting this approach in the comments to last week’s post. Going this way makes it possible to look at the entire offensive line’s value, for example, rather than just the number of players who were high picks.

For example, according to PFR’s Approximate Value (AV), Ki-Jana Carter is the biggest underachiever at RB relative to his draft position (since 1984). After being drafted #1 in 1995, he generated just nine points of AV in his first five years. [2]Carter averaged 3.3 yards on 227 carries over his first five injury-plagued seasons. Carter also had a lot of help from his friends in college. He ranks 10th out of 104 RBs picked in the top 32 in terms of the total value of his college offensive linemen according to my measure. His tight end also went in the top ten in 2005; Carter would be 2nd in total line value if we included TEs. Two of his offensive lineman went in the first round in the following year. Two Penn State fullbacks were drafted that year, too. [3]Two Penn State halfbacks were drafted in 1996, as well. One of them was Stephen Michael Pitts, who went to Middletown High School South (NJ), a school that also graduated Knowshon Moreno and, only … Continue reading Could Carter have looked better than he was because he ran behind those great college blockers? Or is the NFL success of the running back who ranks fourth in terms of offensive line help (Warrick Dunn) more representative of RBs, in general?

In addition to looking at the offensive line, I’ll consider whether the total value of college teammates at other offensive positions predicts that running backs become overvalued in the draft. While we might think that RBs are particularly dependent on line help, it actually appears that having a great QB is again the one clear predictor for players being overvalued. [continue reading…]

References

References
1 I thank commenter Stuart for suggesting this approach in the comments to last week’s post.
2 Carter averaged 3.3 yards on 227 carries over his first five injury-plagued seasons.
3 Two Penn State halfbacks were drafted in 1996, as well. One of them was Stephen Michael Pitts, who went to Middletown High School South (NJ), a school that also graduated Knowshon Moreno and, only slightly less famously, me.
{ 3 comments }

Bradford had a lot of surrounding talent in Norman.

Bradford had a lot of surrounding talent in Norman.

Do players get too much credit when teammates make them look good? Take Johnny Manziel. In the last thirty years, no quarterback has had teammates around him drafted so highly. Last year, his left tackle (Luke Joeckel) was the second pick in the draft. This year, his new left tackle (Jake Matthews) was the sixth pick in the draft and his talented wide receiver went immediately after. That’s three top seven picks from his offense in two drafts. Does this means, perhaps, that Manziel was riding those players’ coattails? Or is it Manziel who helped make his teammates look better?

The first round quarterback with the closest comparable surrounding college talent — a left-handed former Florida QB drafted in 2010 — doesn’t appear to be a very promising comparison. Tim Tebow’s top wide receiver was drafted 22nd overall (Percy Harvin) in 2009, and successive linemen Pouncey brothers were drafted in the top 20 the next two years (Maurkice went #18 in 2010 and Mike #15 in 2011). [1]And he had a talented tight end go in the fourth round in 2010, too. Like Tebow, he is also no longer playing football. Let’s move on. Tebow is obviously very different from Manziel, most notably in lacking the important skill for a quarterback of being able to throw a football well. But Tebow may have looked better as a college player in part because of the great talent around him, a situation which may be similar to Manziel.

In general, does having better college teammates cause QBs like Manziel to be overvalued in the draft? Or, do better QBs cause their college teammates to be overdrafted? To check these ideas out, I compared how draft picks performed in their first five years (according to PFR’s Approximate Value) relative to their expected value given their draft position. [2]I did this by running a regression of a player’s value in the first five years on a fifth-order polynomial in draft position. This is pretty much the same thing as looking at the value a player … Continue reading I then compared performance relative to expectation for players who had the benefit of teammates who were drafted in the first round to those who weren’t so lucky. The results are certainly not what I expected: by the end of this post, it might be Bucs fans who worry the most that they overvalued a high pick in the 2014 draft.

Quarterbacks

I first considered the value above expectation (VAE) for quarterbacks drafted in the first three rounds since 1984. It looks like having a lineman drafted in the first round either in the same or subsequent draft has no clear impact on the QB’s VAE. Those QBs who played with first-round linemen do about 1.8 points worse in VAE than QBs (relative to a baseline of 22.2), but this difference isn’t close to being distinguishable from zero. [3]The p-value is 0.70

Here’s the list of QBs from the first three rounds who had at least one lineman drafted in the first round of the same or subsequent draft. [4]All analysis in this post ignores the supplemental draft. The VAE for the last few entries is missing because those players have not finished their first five seasons. Keep in mind that the VAEs cannot be too low for third-round picks like Bobby Hoying, since little was expected of them given their draft position.

QuarterbackYearVAESchoolOL
Boomer Esiason198441.3MarylandRon Solt
Chuck Long1986-18.7IowaMike Haight
Todd Marinovich1991-21.2USCPat Harlow
Matt Blundin1992-19.2VirginiaRay Roberts
Billy Joe Hobert1993-8.4WashingtonLincoln Kennedy
Rick Mirer1993-5.8Notre DameAaron Taylor
Kerry Collins1995-6.8Penn St.Jeff Hartings; Andre Johnson
Todd Collins1995-10MichiganTrezelle Jenkins
Bobby Hoying1996-9.6Ohio St.Orlando Pace
Charlie Batch199814.9East. MichiganL.J. Shelton
Eli Manning20049.5MississippiChris Spencer
Brian Brohm2008-15.7LouisvilleEric Wood
Chad Henne20086.4MichiganJake Long
Matt Ryan200837.9Boston Col.Gosder Cherilus
Sam Bradford20100OklahomaTrent Williams
Tim Tebow20100FloridaMaurkice Pouncey; Mike Pouncey
Andrew Luck20120StanfordDavid DeCastro
Ryan Tannehill20120Texas A&MLuke Joeckel
Russell Wilson20120WisconsinKevin Zeitler; Travis Frederick

There are definitely some classic failures on this list, notably Todd Marinovich, but there are some big successes, too. And, for the more recent QBs, Andrew Luck and Russell Wilson will more than balance out Tebow. Overall, there’s little reason to think getting to play with a first-round lineman causes QBs to be overdrafted in general. As a result, Manziel critics may not have much support if they want to point to Matthews and Joeckel as the reason for Manziel’s college success.

But what about the presence of Mike Evans? Does having an elite wide receiver or tight end mean that a QB might be overvalued in the draft? I ran a separate regression looking at whether having a first-round WR/TE predicts a QB to succeed or flop relative to his expectation. Here, there’s more reason to think there might be something going on, but there is still not clear evidence that teammates make the QB. Part of this is just the relatively small number of QBs with first-round WR/TEs in the sample. On average, QBs with first-round WR/TE teammates in college do 6.5 points worse relative to expectation than other QBs. That gap is still indistinguishable from zero, however. [5]p = .20

Below are the QBs since 1984 who had at least one WR/TE teammate in the same or following year drafted in the first round.

QuarterbackYearVAESchoolWR/TE
Vinny Testaverde1987-4.5Miami (FL)Michael Irvin
Tony Sacca1992-17.7Penn St.O.J. McDuffie
Rick Mirer1993-5.8Notre DameIrv Smith
Kerry Collins1995-6.8Penn St.Kyle Brady
Kordell Stewart199519.9ColoradoMichael Westbrook
Bobby Hoying1996-9.6Ohio St.Terry Glenn; Rickey Dudley
Peyton Manning199840.5TennesseeMarcus Nash
Marques Tuiasosopo2001-14.2WashingtonJerramy Stevens
Chris Simms2003-2.3TexasRoy Williams
Matt Schaub200410.9VirginiaHeath Miller
JaMarcus Russell2007-30.5LSUDwayne Bowe; Craig Davis
Sam Bradford20100OklahomaJermaine Gresham
Brandon Weeden20120Oklahoma St.Justin Blackmon
Robert Griffin20120BaylorKendall Wright
Geno Smith20130West VirginiaTavon Austin

The repeats from the earlier list who were blessed with great help both on the line and at WR/TE were Rick Mirer, Kerry Collins and Sam Bradford. [6]All of those first-rounders were actually TEs (Irv Smith, Kyle Brady and Jermaine Gresham, respectively), although Collins also threw to a second-round WR in Bobby Engram. As you can see, Peyton Manning swings this upwards, but JaMarcus Russell swings it down just as much. Both of those would seem to be anecdotes that fit the story of teammates potentially inflating another player’s perceived value, with the QB inflating the WR (the instantly forgotten Marcus Nash) in Manning’s case and the WR (Dwayne Bowe) perhaps inflating the QB in Russell’s case.

Overall, though, it’s unclear whether WRs in general tend to inflate their QBs, making them overvalued in the draft. The effect size is substantial and just three of the 11 QBs have positive VAE, but it could be driven by random chance given the small sample size. [7]Kordell Stewart is one of those three and he did play a little WR in his first few years, too, but almost all of his value was at QB Given what I find below for predicting WR success, I suspect that the Manning-Nash example may happen more often than the Russell-Bowe situation.

Wide Receivers

Do great college quarterbacks cause NFL talent evaluators to reach for their wide receiver and tight end teammates? It seems like the answer to this question might be yes. Receivers selected in rounds 1-3 who come from schools with first-round QBs drafted the same or following year do 6.4 points worse relative to expectation from their draft position. Here, we have more data and the results are statistically significant that having a first-round college QB has led to their wide receivers being overvalued in the draft. [8]The p-value for this effect is .01 WRs drafted in the first three rounds without a top QB generated an average value in their first five years of 17.6, so the predicted drop in value is down to about 11.2. Having a first round QB thus predicts a WR gets taken a little more than a round too early. [9]For wide receivers, I estimate 17.6 as being the expected value generated by about the 46th pick, with 11.2 the expected value generated by the 89th pick

In fact, from 1984 to 2009, only 20% of the round 1-3 WR/TEs who played with first-round QBs had a positive VAE.

WR/TEYearVAESchoolQB
Jonathan Hayes1985-11.9IowaChuck Long
Flipper Anderson198817.3UCLATroy Aikman
Mike Bellamy1990-16.9IllinoisJeff George
Derek Brown1992-26.7Notre DameRick Mirer
Irv Smith1993-14.9Notre DameRick Mirer
Cory Fleming1994-10.4TennesseeHeath Shuler
Malcolm Floyd1994-7.9Fresno St.Trent Dilfer
Tydus Winans1994-9.8Fresno St.Trent Dilfer
Kyle Brady1995-20.4Penn St.Kerry Collins
Bryan Still1996-10.9Virginia TechJim Druckenmiller
Joey Kent1997-15.7TennesseePeyton Manning
Marcus Nash1998-21.1TennesseePeyton Manning
Patrick Johnson1998-8.7OregonAkili Smith
Kevin Johnson199910.6SyracuseDonovan McNabb
Jabar Gaffney2002-1.1FloridaRex Grossman
Reche Caldwell20022.7FloridaRex Grossman
Taylor Jacobs2003-16.2FloridaRex Grossman
Mike Williams2005-25.8USCMatt Leinart
Anthony Fasano2006-2.3Notre DameBrady Quinn
David Thomas2006-2.5TexasVince Young
Dominique Byrd2006-10.7USCMatt Leinart
Maurice Stovall2006-6.1Notre DameBrady Quinn
Craig Davis2007-15.1LSUJaMarcus Russell
Dwayne Bowe200713.4LSUJaMarcus Russell
Fred Davis2008-2.3USCMark Sanchez
Jordy Nelson200812.8Kansas St.Josh Freeman
Juaquin Iglesias2009-10.1OklahomaSam Bradford
Mohamed Massaquoi2009-2.9GeorgiaMatthew Stafford
Patrick Turner2009-10.4USCMark Sanchez
Percy Harvin200917FloridaTim Tebow
Jermaine Gresham20100OklahomaSam Bradford
Coby Fleener20120StanfordAndrew Luck
Justin Blackmon20120Oklahoma St.Brandon Weeden
Kendall Wright20120BaylorRobert Griffin

And at least one of the successes on this list is an exception that fits the broader idea. Percy Harvin played with a QB who just maybe was a slight reach as a first round pick. It’s hard to think that Tim Tebow made Percy Harvin look good. [10]I’d argue the same for Dwayne Bowe and JaMarcus Russell, but Russell at least was a legitimately excellent passer in 2006 At least based on these results, having a great college QB has caused wide receivers to be drafted much too highly over the last thirty years.

Conclusion

So it seems like Bucs fans might have more to worry about than Browns fans. The evidence is unclear on whether QBs such as Manziel generally become overvalued from playing with first-round receiver talent, although there might be something going on there. But the evidence is much clearer that WRs such as Evans become overvalued from playing with premier college QBs. Perhaps it’s not surprising from what we know about the NFL that there’s a pretty good chance that Manziel’s excellence helped inflate Evans’s value.

Of course, the last example of a 6’5 receiver drafted in the top ten who played with a first-round Heisman-winning QB doesn’t bode well for Evans, either. [11]The similarities don’t stop there. Mike Williams is listed at 229 lbs and ran a 4.56 40 at the combine. Evans is at 231 and ran a 4.53. And they’re both named Mike. And while Evans will likely still be in the NFL after six years unlike Mike Williams, it is likely that he would have gone lower in the draft if he played with a quarterback not quite so good as Johnny Football.

References

References
1 And he had a talented tight end go in the fourth round in 2010, too. Like Tebow, he is also no longer playing football. Let’s move on.
2 I did this by running a regression of a player’s value in the first five years on a fifth-order polynomial in draft position. This is pretty much the same thing as looking at the value a player generates compared to their expected value according to Chase’s chart, except I also control for whether a player went to a major football school.
3 The p-value is 0.70
4 All analysis in this post ignores the supplemental draft.
5 p = .20
6 All of those first-rounders were actually TEs (Irv Smith, Kyle Brady and Jermaine Gresham, respectively), although Collins also threw to a second-round WR in Bobby Engram.
7 Kordell Stewart is one of those three and he did play a little WR in his first few years, too, but almost all of his value was at QB
8 The p-value for this effect is .01
9 For wide receivers, I estimate 17.6 as being the expected value generated by about the 46th pick, with 11.2 the expected value generated by the 89th pick
10 I’d argue the same for Dwayne Bowe and JaMarcus Russell, but Russell at least was a legitimately excellent passer in 2006
11 The similarities don’t stop there. Mike Williams is listed at 229 lbs and ran a 4.56 40 at the combine. Evans is at 231 and ran a 4.53. And they’re both named Mike.
{ 37 comments }

The NFL Draft and the Wisdom of Crowds

[Chase note: Take a look at the name at the top of this post. Our good friend Andrew continues to desire to post here, and we thank him for that.]

Not the focus of Galton's experiment.

Not the focus of Galton's experiment.

In 1906, Sir Francis Galton probably wasn’t thinking about the NFL draft when he asked almost 800 fair goers to guess the weight of an ox. No one person accurately guessed its weight, and the guesses were all over the map, but the mean of all the guesses (1197 lbs) was within one pound of the actual weight of the ox. As I looked through endless mock drafts leading up to last Thursday night, I wondered if there was anything to be gained by looking at the wisdom of the crowds. Could we do a better job of predicting the NFL draft if we took all the knowledge and tried to put it together?

And the answer appears to be yes… to an extent. The NFL draft is not exactly a place where we’d expect the wisdom of crowds to be particularly strong. The power of the wisdom of crowds comes from lots of people bringing their own independent information to the table. For example, prediction markets appear to do a great job of predicting events like a president’s chances of being reelected. Sports prediction markets (a.k.a sportsbooks) similarly succeed in predicting game outcomes. And the stock market often reveals companies’ true values. In each case, every individual transaction represents a piece of information which gets reflected in the price.

Of course, the crowd is not always so wise. Stock markets can go haywire. Betting lines can be affected by people’s biases. The wisdom of crowds can break down when groupthink occurs and people stop having independent opinions. The NFL draft certainly looks like such a case. All the mock drafts are out there and the experts have the implicit pressure to not be too different. [1]In some cases, there may be incentives to stand out from the crowd with an original prediction, too. Overall, there are incentives that can make predictions depend on those made by others. In those circumstances, we could lose in a haze of groupthink much of the original information that people have. [continue reading…]

References

References
1 In some cases, there may be incentives to stand out from the crowd with an original prediction, too. Overall, there are incentives that can make predictions depend on those made by others.
{ 9 comments }