≡ Menu

Murray has been sacked 16 times in 3 games.

Arizona rookie Kyler Murray has some pretty strong counting stats so far this year: he’s averaging 276 passing yards per game, which would lead him to breaking the mark for passing yards by a rookie if he keeps this up for 16 games. He “only” has three interceptions, and he is completing a whopping 28 passes per game: only Drew Brees (5x), Peyton Manning (2x), and Ben Roethlisberger (2018) have ever done that in a season while playing in at least 8 games.

But Murray’s efficiency numbers have been, well, bad. He’s averaging just 4.42 ANY/A this year, thanks to an awful sack rate (10.5%) and a poor yards per completion average (9.9). But we don’t need an advanced stat like ANY/A to see Murray’s struggles: the most basic of stats will suffice.

Murray has thrown for only 37 first downs so far this year, despite having 153 passing plays (pass attempts plus sacks). That is an ugly 24.2% rate, while the league average is 32.6%. First down rate is one of the most basic stats to measure passing success, but it’s much better than completion percentage and is a handy way to quickly and easily check in on quarterback performance. The table below shows the passing stats for quarterbacks prior to today: [continue reading…]

{ 0 comments }

Penn State RB Saquon Barkley is your bronze champion. The star athlete ranked 3rd in the bench press after adjusting for weight and height, with his 29 reps tied for the most by any running back. And he ranked 3rd in the 40-yard dash after adjusting for weight; his 4.40 time was the second fastest among running backs, and the only player faster weighed 35 fewer pounds.

And today, you’ll see that Barkley ranked third in the vertical jump, too. The best-fit formula for projecting the vertical jump is as follows:

Projected VJ = 46.38 – 0.0597 * weight (pounds)

At 233 pounds, Barkley would be expected to have a 32.5 inch vertical jump. In reality, he jumped 41 inches, or 8.5 inches above expectation. That was the third-best mark at the combine, but only the 2nd best among Nittany Lions. That’s because Penn State TE Mike Gesicki jumped 41.5 inches at a whopping 247 pounds, or 9.9 inches above expectation.  The 40/240 club — jumping at least 40 inches while weighing at least 240 pounds — is a small one, and Gesicki stands out as being an elite athlete.

But it’s hard to compete with Barkley, who was dominant at the combine in the bench press, the 40, and the vertical jump. The full list, below: [continue reading…]

{ 1 comment }

Super Bowl Squares: How To Win During Super Bowl LII

Three years ago, I wrote a detailed breakdown about Super Bowl squares. Well, it’s that time of year again, so I’m going to repost that article here to help you cheat to win at your Super Bowl party.

Every Super Bowl squares pool is different, but this post is really aimed at readers who play in pools where you can trade or pick squares (surely no pool has a prohibition on this!) I looked at every regular season and postseason game from 2002 to 2013. [1]Yes, this means your author was too lazy to update things for the 2014, 2015, or 2016 seasons. I suppose the rule change moving back the extra point would probably change things ever so slightly, … Continue reading The table below shows the likelihood of each score after each quarter, along with three final columns that show the expected value of a $100 prize pool under three different payout systems. The “10/” column shows the payout in a pool where 10% of the prize money is given out after each of the first three quarters and 70% after the end of the game; the next column is for pools that give out 12.5% of the pool after the first and third quarters, 25% at halftime, and 50% for the score at the end of the game. The final column is for pools that give out 25% of the pot after each quarter — since I think that is the most common pool structure, I’ve sorted the table by that column, but you can sort by any column you like. To make the table fully sortable, I had to remove the percentage symbols, but “19, 6.7, 4.1, 2” should be read as 19.0%, 6.7%, 4.1%, and 2.0%. [continue reading…]

References

References
1 Yes, this means your author was too lazy to update things for the 2014, 2015, or 2016 seasons. I suppose the rule change moving back the extra point would probably change things ever so slightly, given the small increase in missed extra points.
{ 1 comment }

One of the very first trivia questions posted at Football Perspective was about the first quarterback to lose 100 games as a starter. You might have thought that the answer was Archie Manning (35-101-3 career record), but he only had the worst record of all-time; he wasn’t the first to get to 100 losses (answer in the original post). (Actually, that post now appears to have been wrong. At some point since 2012, PFR has updated the career record of Norm Snead from 52-99-7 to 52-100-7. The extra start came in 1965, specifically this game against the Browns; five years ago, PFR had King Hill starting that game; now it had Snead — who went 0/1 — as the starter.

Well, last night, Archie’s son set another record. With the Giants loss to the Redskins on Thanksgiving, Eli Manning became the first quarterback in NFL history to lose 100 starts with a single team. The table below shows all quarterbacks with at least 70 losses with one team, through November 24, 2017: [continue reading…]

{ 4 comments }

Young as a Yuck

Steve Young went 91-33 as a starting quarterback for the 49ers, a 0.734 winning percentage. He also went 3-16 as the quarterback of all other teams (which, in this case, is just the Bucs), for a 0.158 winning percentage. That’s remarkable, but is it as remarkable as say, what Jake Plummer did? With the Broncos, Plummer went 39-15 (0.722), but he was 30-52 (0.366) with all other teams (here, just the Cardinals).  Young has a larger differential, but he started just 19 games in Tampa Bay; Plummer started over 50 games with both teams.

One way to “deal” with this is to add X number of games of .500 play to both sides.  I’ve used 40 games before, which is probably within the range of reasonable.  This helps smooth out small sample sizes: Young would therefore be 111-53 with the 49ers (0.677) and 23-36 (.390) outside of San Francisco.  As you can see, his 49ers adjusted winning percentage only changes by about 6% by adding 40 games of .500 play, but his Tampa Bay adjusted winning percentage rises by 23% because of the small sample size.  That’s the point.   Now, Young has a 29% better adjusted winning percentage in San Francisco than outside of San Francisco.

Plummer? His Denver record would become 59-35 (.628), while his non-Broncos record would be 50-72 (.410), giving him a 22% better adjusted winning in Denver.

I did this for every quarterback in NFL history (prior to 2017) and checked to see which passers had the biggest differentials in terms of adjusted winning percentage as quarterback of one team (minimum 10 starts) versus the rest of their career. Young was in fact the leader by this metric, with Plummer coming in at #4. Steve DeBerg was 2nd: he was 21 games under .500 in Tampa Bay and 21 games under .500 in San Francisco, and he also went 7-9 in his starts in Denver, Miami, and Atlanta. On the other hand, he was 31-20-1 as the starter with Kansas City. As a result, his adjusted winning percentage was 23% higher with the Chiefs than it was outside of Kansas City.

Billy Kilmer went an impressive 50-23-1 later in his career as a Redskins starter, but just 11-28 with the Saints (and 0-1 with the 49ers) at the beginning of his career.  In other words, he was a 1970s Plummer. Here’s how to read the table below, using Jim Plunkett — who was 19 games above .500 with the Raiders, and 19 games under .500 when not with the Raiders as an example. Plunkett went 38-19 with the Raiders for a 0.667 winning percentage and a 0.598 adjusted winning percentage (after adding 40 games of .500 play). When not with the Raiders, Plunkett was 34-53 for a 0.391 winning percentage that jumps to 0.425 after adding 40 games of .500 play. Plunkett’s actual difference in winning percentage was 0.276, but just difference in adjusted winning percentage was 0.173, the 10th largest on the list. [continue reading…]

{ 4 comments }

Pythagenpat History, 1960-2016

Yesterday, I looked at Pythagenpat records in 2016. Today, let’s look at the Pythagenpat records for each team since 1960. [1]Note that since today’s dataset covers a much longer period, I used 0.255 as the best-fit exponent to determine what exponent used for each team. More explanation available here. The table below shows the following information for all 1,613 teams since 1960:

The top team by Pythagenpat winning percentage was the 1962 Green Bay Packers, who scored 415 points and allowed just 148 points. That translated to a 0.929 winning percentage, and an even better 0.934 Pythagenpat Winning Percentage. The Packers therefore “underachieved” by 0.005, which ranks as the 851st best difference since 1960. The team’s main passer (by attempts) and coach (by games) were Starr and Lombardi, of course.
[continue reading…]

References

References
1 Note that since today’s dataset covers a much longer period, I used 0.255 as the best-fit exponent to determine what exponent used for each team. More explanation available here.
{ 8 comments }

Are Division Games Being Scheduled Later Now?

The Atlanta Falcons play zero division games in September and October. Atlanta travels to Carolina in week 9, and doesn’t play another division game until hosting the Bucs in week 12. Atlanta’s schedule finishes with the Saints, Bucs, Saints, and Panthers in the final four weeks of the season. The six NFC South games for Atlanta occur in weeks 9, 12, 14, 15, 16, and 17, which produces an average of 13.8.

The Patriots have a similar story, with an average of 13.0. New England travels to MetLife Stadium in week 6, before matching Atlanta with five of the six division games coming in the final six weeks: the Patriots final six games are, in order, Miami, @Buffalo, @Miami, @Pittsburgh, Buffalo, New York. Tampa Bay isn’t far behind, with its six division games coming in an average of week 12.8.

On the other hand, you have the Jets. New York’s average division game last year was week 11.8, which was the latest in the NFL. This year, the Jets have the earliest slate, at 7.2. New York travels to Buffalo in week 1 and the team’s home opener comes in week 3 against the Dolphins. The Jets play New England in weeks 6 and 17, but gets Miami in week 7 and Buffalo in week 9 on Thursday night. That means from November 3rd through December 30th, the Jets don’t play a single division game.

Here’s that data for every week, showing which week their division games are played. The table is fully sortable, so you can see, for example, that three teams have their 4th division game in week 15, and therefore their final three games are against division opponents: [continue reading…]

{ 11 comments }

Running Back Receiving Data Since 1950

Yesterday, I looked at the amount of rushing yards generated by “quarterbacks” in each year since 1950. I put that term in quotes because what I did was calculated the amount of rushing yards by passers, weighted by the number of passing yards by each passer. So the amount of rushing yards by a passer with 5000 passing yards counts for 50 times as much (when determining how much rushing was generated by “quarterbacks” that season) as a passer with 100 passing yards.

What if we do the same thing but with receiving yards generated by “running backs”? The peak year was 2002, when there were a lot of players who both were their team’s workhorse back and were great receivers. Priest Holmes rushed for 1,615 yards and had 672 receiving yards, Charlie Garner was at 962/941, Tiki Barber had 1387/597, and LaDainian Tomlinson was at 1683/489. On average, the league “running backs” produced an average 292 receiving yards. That may not mean much in the abstract, but think of it this way: if each team gave all of its rushing yards to one player, that player would have averaged 292 receiving yards, too. Using the methodology from yesterday, here are the results if we replace passing yards with rushing yards, and rushing yards with receiving yards: [continue reading…]

{ 1 comment }

Net Interceptions and the Jets

The Jets threw 25 interceptions last year, which was bad because no other team threw more than 21. Also not good: the Jets defense forced just 8 interceptions last year, tied for second-fewest in the league behind the Jaguars (7).

That means New York was at -17 net interceptions last year, which is bad. But the Jets have generally been pretty bad in this category over the last decade, with -59 net interceptions from ’07 to ’16. Take a look at the yearly totals, with interceptions throwing by Jets passers in white, and interceptions forced by the Jets defense in green. [continue reading…]

{ 2 comments }

Two days ago, I looked at the median age of defensive players based on interceptions. And yesterday, I looked at the median age of players based on sack totals.

Today, we will do the same thing but by position, using AV as our tool of measurement.

First, let’s start with defensive linemen. On average, from 1970 to 2016, 50% of all AV came from players 27.0 years of age or younger as of September 1st of the season in question. That number rose to as high as 27.6 in 1999, dropped to just 26.1 in 2013, and has been around 26.5 over the last three seasons.

[continue reading…]

{ 0 comments }

Are The Dolphins the New Texans?

Fresh off of Miami’s largest win of the season — and only the team’s second win by more than 7 points — it might seem like an odd time to question the Dolphins. But Miami is now 9-5 and has now only outscored opponents by 1 point. That’s right: it took a 21-point win over the Jets to finally put Miami’s points differential in the black. Miami lost by 32 to Baltimore, which obviously stands out as a big outlier, but the team also lost by 15 to Cincinnati and 13 to Tennessee. And while it doesn’t impact the team’s points differential by much, another loss came by 7 to New England despite a Game Script of -15.6.

A few weeks ago, I asked if the Texans were the worst 6-3 team ever. We may be getting to that point now regarding the 9-5 Dolphins. According to Pro-Football-Reference.com, Miami has also faced the second easiest schedule in the league this year, behind only the Patriots. Miami gets to face the bad NFC West, the mediocre NFC North, and has had two games against the Jets already. Five of Miami’s nine wins came against the Jets, Browns, 49ers, and Rams, and three more came against below .500 teams. As a result, combine a weak SOS and an average MOV, and the Dolphins have a negative Simple Rating System grade.

The graph below shows each team’s winning percentage on the X-Axis, and SRS on the Y-Axis.  The farther south of the trend line, the more a team is “overachieving” in record relative to SRS (think Miami, Detroit, and the Giants), and the farther north of the trend line, the more a team is “underachieving” in record relative to SRS (think Philadelphia, San Diego, Atlanta). [continue reading…]

{ 3 comments }

Final 2016 NFL Division Odds

I never quite know what to post on the first Sunday of the season, so here are the final NFL 2016 Division Odds (as of prior to the Thursday night game). In each case, I’ll be showing the odds for each team to win its division as of May 23rd and as of September 8th, along with their vig-adjusted percentage based on those odds. Let’s start with one of three divisions with a clear favorite, and one of just two divisions with only one team having at least a 15% chance of winning the crown.

AFC East

The Patriots raw odds actually went up over the last few months, even with the Tom Brady suspension becoming official. But because the Jets and Bills have seen their percentage drop, New England’s odds of winning another AFC East crown have increased. Buffalo’s had a rough offseason due to injuries, but it’s a little harder to explain why the Jets odds have gone down. New York has a very difficult schedule, which may play a part in that.

AFC North

These odds have been pretty static, but a (very) small Cleveland hype train has emerged. Vegas sees the top 3 teams as very strong, but does have a clear 1-2-3 order, too. [continue reading…]

{ 0 comments }

Yes, The NFL Is Getting Younger

An interesting article from Kevin Clark at The Ringer this week, arguing that the NFL has an age problem. Let’s start by acknowledging that there are two claims in that statement: one, that the NFL is getting younger, and two, that this is a problem. I am only going to address the first one, but feel free to discuss either one in the comments.

The reason I’m not going to address the second point is that it is much tougher to analyze objectively. While Clark’s argument could be true, it’s no more convincing than Jason Lisk’s argument to the contrary: i.e., if a league is getting younger, that may be a sign that a league is getting stronger. A youth movement could be a signal that the prior generation of stars was unable to sustain their dominance as they aged because talented new blood was replacing them. Had a bunch of less-talented players entered the last few drafts, those aging stars would have held on, so a young league means a stronger league. Of course, that is just a theory, too. In reality, I feel very comfortable stating that the rookie wage scale is playing the dominant role in the youth movement in the NFL.

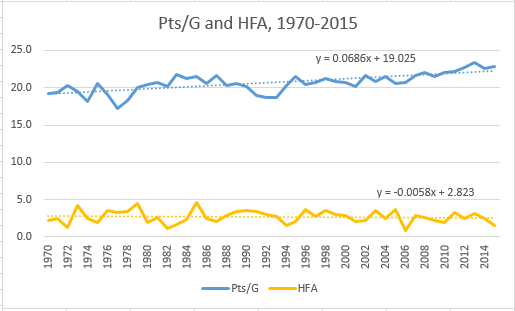
And yes, getting back to the first claim, there most certainly is a youth movement in the NFL. Here is a graph showing the weighted (by AV, naturally) age of the entire NFL for each year since 1970, with age being calculated as of 9/1 of each year.

age-nfl

As you can see, there has been a noticeable decline over the last five years, coinciding with the new CBA in 2011. In 2010, the average age was 27.5 years; last year it was down to 27.1, with nearly all of that decline happening in 2011, 2012, and 2013. [1]I’m not sure exactly what caused the spike in the early ’90s. My initial thought was free agency, but it’s really ’91 and ’92 that had the big jumps, which is just … Continue reading

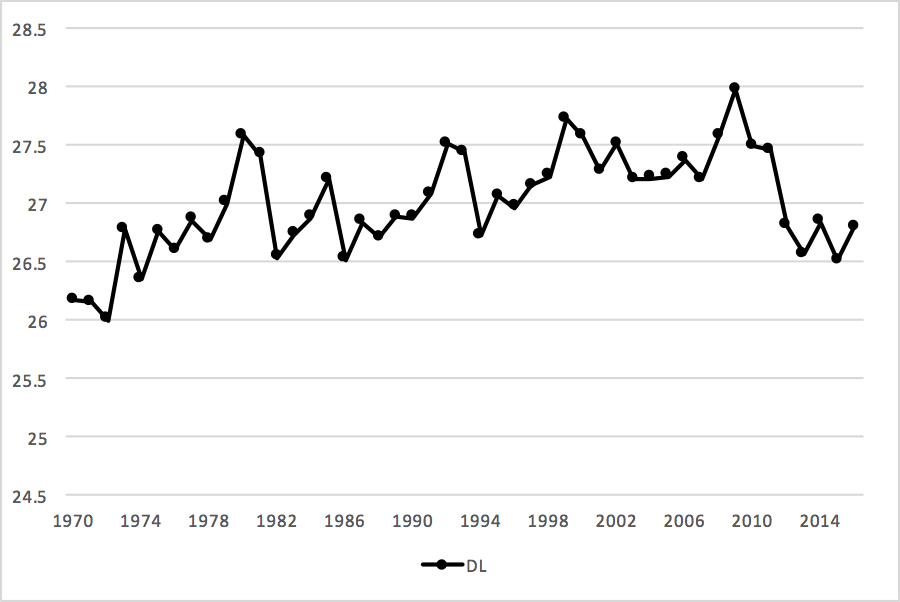
And, to further support some of the claims in Clark’s article, yes, offensive linemen are getting younger, too. Here’s the same graph again, but with two changes: one, the Y-Axis goes from 26 to 28 instead of 25 to 29, and two, I have included just the average AV-weighted age of offensive linemen in orange.

age-nfl-ol

So it does seem that offensive linemen are getting younger at a pretty dramatic rate. But again, I’m not so sure that’s a bad thing, or even whether a decrease in quality is something we can measure. Consider that Clark’s article argues that the quality of play at the position is going down, and that Packers coach Mike McCarthy “is particularly concerned about the end of veteran lines, which were staples of the league when he entered as an assistant in 1993.” In another part, John Harbaugh is quoted as bemoaning that offensive linemen don’t know where “blitzers are coming from.”

Okay, but then in a different section, Clark quotes longtime NFL executive Phil Savage bemoaning the decline of defenders in the front seven:

“Look at edge pass rushers, outside linebackers,” Savage said. “A lot of them are one-trick ponies in college. They rely on speed, then they go to the NFL and get locked up and they don’t have a counter move. They can’t get reps at full speed, you can’t replicate this stuff in practice, and then when it’s a real game it’s very difficult.”

If line play is worse on both sides of the ball, is that something really detectable? It seems odd to me to argue that both offensive line play and the quality of play in the front seven are both in decline. That would seem to wash itself out, and certainly be hard to see with the naked eye.

What do you think?

References

References
1 I’m not sure exactly what caused the spike in the early ’90s. My initial thought was free agency, but it’s really ’91 and ’92 that had the big jumps, which is just before the start of free agency.
{ 12 comments }

Today’s guest post/contest comes from Thomas McDermott, a licensed land surveyor in the State of California, a music theory instructor at Loyola Marymount University, and an NFL history enthusiast. As always, we thank him for his hard work. You can read all of his guest posts at Football Perspective at this link.


The following is a bunch of data I’ve gathered regarding home-field advantage; hopefully some of you will find it useful for analysis, or for picking winners against the spread in your pick’em games this year!

The general consensus is that the home team in a typical NFL game has an advantage of around 2.5 to 3 points, and this is right on: since 1970, the average team wins their regular season home games [1]The HFA number during the playoffs over that same period is 6.5, but that’s probably due to playoff seeding than fan/stadium involvement; it might be interesting to look into this further. by 2.7 points, [2]As far as what causes home teams to have an advantage at home, Brian Burke suggests in this article that it has more to do with environmental familiarity, and other factors, than the effect of … Continue reading with a high of 4.6 in 1985 and a low of 0.8 in 2006. If we do a linear regression, we can see that HFA appears to be in decline, but only slightly compared to points per game, which is obviously increasing:

pts hfa [continue reading…]

References

References
1 The HFA number during the playoffs over that same period is 6.5, but that’s probably due to playoff seeding than fan/stadium involvement; it might be interesting to look into this further.
2 As far as what causes home teams to have an advantage at home, Brian Burke suggests in this article that it has more to do with environmental familiarity, and other factors, than the effect of screaming fans.
{ 30 comments }

AFC SRS Ratings, 2002 to 2015

I thought it would be fun to look at the SRS ratings for each division in the AFC since realignment in 2002. SRS, of course, stands for Simple Rating System: at its core, it’s just points differential (per game) adjusted for strength of schedule. To derive division ratings, I simply took the average of the SRS ratings of each of the four teams in any given season.

Let’s start with the best division in the conference over the last 14 years, the AFC East. From 2002 to 2015, the average AFC East team season has produced an SRS of +2.0. That’s the best division in football, and by a pretty large margin, too (second is the AFC North at +0.9). That said, the AFC East is on a bit of a decline lately: the division was below-average in 2012 and 2013, and barely above-average last year. But in ’04, ’06, ’09, and ’10, the AFC East produced some outstanding seasons. Take a look:

afc east srs

The division hasn’t exactly had a lot of turnover at the top: the Patriots won the division every year but ’02 (Jets) and ’08 (Dolphins), and New England obviously is the driving force here. The Patriots are at +9.5, while the other three teams average a -0.6 rating. But the AFC East also doesn’t have a bottom-feeder, and that helps. The AFC doesn’t have a Raiders, Jaguars, or Browns dragging it down; the Bills SRS rating since ’02 is -1.4, which is easily the best of any 4th-place team in any division in the NFL. Having the best team in the NFL and the best worst team makes it pretty easy to see why the AFC East fares so well here. [continue reading…]

{ 4 comments }

The Ryan Index, Part 3

On December 12, 1965, the Eagles traveled to Pittsburgh and won, 47-13. That game was not necessarily all that notable: entering the game, the Steelers were 2-10 and the Eagles were 4-8. But that day, Philadelphia produced one of the greatest defensive efforts in NFL history. The Eagles defense had three pick sixes, recorded five sacks, forced five fumbles (recovering three), and — most remarkably — had nine interceptions. If a 12-turnover, 3-touchdown day sounds really good to you, that’s because it is.

The past two days, we have looked at the Ryan Index, my measure of defensive aggressiveness/effectiveness. The best game last year came by the Cardinals defense in week 16 against the Packers. Arizona allowed just 8 points (+8), recorded an interception (+4), forced five fumbles (+15), recovered three (+3), had 9 sacks (+18), and scored two defensive touchdowns (+12). That’s a total of 60 points, the most by any defense since those same Cardinals were blanked by the Seahawks, 58-0, back in 2012. [continue reading…]

{ 4 comments }

2015 Team AV and Draft Value

Did you know Wilson was a 3rd round pick?

Did you know Wilson was a 3rd round pick?

The Kansas City Chiefs and the Seattle Seahawks both had very good seasons in 2015, with each team ultimately losing in the division round of the playoffs. But they got there with very different rosters when it comes to the NFL Draft.

The Chiefs have Alex Smith at quarterback, and while he wasn’t drafted by Kansas City, he was the first overall pick in 2005. Eight years later, offensive tackle Eric Fisher went first overall, while safety Eric Berry gives the team a third top-five pick, tied with five other teams for most in the league. Dontari Poe, Derrick Johnson, Marcus Peters, Jeremy Maclin, and Tamba Hali were all top-20 picks, too. Thought of another way, all of the top 5 Chiefs in Approximate Value were drafted in the top 20; the team’s next three leaders in AV are Hali and two high third round picks (Travis Kelce and Justin Houston).

Smith had 16 points of AV last year, or 7% of the Chiefs total AV. Since he was the first pick, and the first pick is worth 34.6 points, that means 7% of the Chiefs weighted “average draft value” is 34.6 points. Kelce had 8 points of AV, or 4% of KC’s AV; as a result, 4% of the Chiefs weighted “average draft value” is equal to 8.2, the value of the 63rd pick in the draft. Do this for every player on the team, and Kansas City’s average draft value is equal to 11.5 points, or in between the 37th and 38th picks in the draft.  That maybe doesn’t mean much in the abstract, but it’s the most average draft value of any team in the NFL.

Now, let’s look at Seattle. Eight Seahawks had at least 10 points of AV last year: those players were Russell Wilson (3rd round), Bobby Wagner (2nd), Richard Sherman (5th), Michael Bennett (undrafted), Doug Baldwin (undrafted), Garry Gilliam (undrafted), K.J. Wright (4th round), and Earl Thomas (14th overall). It’s easy to forget, given how talented Seattle is, but only Russell Okung, Bruce Irvin, Marshawn Lynch, and Thomas were first round picks (and only Thomas returns for 2016). And only two of the team’s regular contributors — Wagner and Justin Britt — were second round picks. In fact, Seattle’s averaged draft value using the weighting formula described above was 5.15 points, equivalent to the 101st pick in the Draft. That’s two full rounds lower than Kansas City’s average. [continue reading…]

{ 7 comments }

A quick data dump today following up on yesterday’s post. The table below shows the percentage of receiving yards gained by 1st-year, 2nd-year, 3rd-year…. and 11th-year and more senior NFL players, in each year since 1950 (excluding 1987). [continue reading…]

{ 2 comments }

For a variety of reasons, I was curious to know what percentage of receiving yards was gained by each class of players. As it turns out, second-year players gain the most receiving yards of any class. Year two players have the advantage of added experience over rookies, and also are less likely to be out of the league even if they aren’t very good, relative to older players. Even bad players usually make it to the field in year two.

One reason to study this data is to analyze receiver production versus draft class. Because of passing inflation, you can’t simply compare the receiving yards gained by the 1973 class to the receiving yards gained by the 2003 class. But what you *could* do is measure the percentage of yards gained by each class, which should control for era. For example, the famed 2014 rookie class (with Odell Beckham, Sammy Watkins, Mike Evans, Allen Robinson, et al.) was responsible for 13% of NFL receiving yards in 2014 and then 19% of receiving yards last year. Those numbers are both really, really good. [continue reading…]

{ 4 comments }

The best player in the AFC South is in this photo.

The best player in the AFC South is in this photo.

Good article from Peter King this morning on J.J. Watt and the injury struggles he dealt with last year.  King also noted that Watt has 69 sacks over the last four seasons, the most in the NFL.  In fact, that’s the second most by any player in any four-year stretch over at least the last 31 years. FRom 1985 to 1988, Reggie White had 70 sacks, and he did it in seven fewer games (he missed the first three games of ’85 due to being a member of USFL, [1]The Eagles, after starting 0-2, paid a million dollars to Memphis to essentially buy White from the league. and then four games in ’87 due to the players’ strike.)  Of course, White did play in a friendlier era for sacks (2.63 sacks per game vs. 2.37 over the last four years), so cross-era comparisons always have their limitations.

But I thought it would be interesting, especially in light of Jared Allen retiring, to look at the leaders in sacks on a trailing four year basis: [continue reading…]

References

References
1 The Eagles, after starting 0-2, paid a million dollars to Memphis to essentially buy White from the league.
{ 12 comments }

Jim Brown, Bobby Boyd, and Retiring Early

The GOAT.

The GOAT.

Jim Brown is the standard bearer for athletes who retired too young, and for very good reason. Brown led the NFL in rushing yards, rushing touchdowns, yards from scrimmage, and total touchdowns in his final season in 1965, all while averaging 5.3 yards per run and 9.6 yards per reception. With D’Brickashaw Ferguson choosing to retire “early” yesterday, on the heels of Calvin Johnson doing the same thing, I decided to run a quick query on the players who were best in the final season of their career.

The table below shows all players who had at least 10 points of Approximate Value in the final season of their career (Megatron had 10 points of AV in 2015; Ferguson had 9) and whose last season came in 2014 or earlier. [1]Note that Patrick Willis had just 3 points of AV in his final year in the NFL.  As it turns out, Brown ranks tied for first on this list, next to Colts defensive back Bobby Boyd.

Here’s how to read the table below. Boyd’s last season came in 1968 with Baltimore.  Playing left cornerback, he accumulated 21 points of AV that year at the age of 31. He received a number of awards that season: he was 1st-team All-Conference (that’s what the + sign means) according to the Sporting News, and a 1st-team All-Pro choice by the AP, Pro Football Writers, NY Daily News, Pro Football Weekly, and the UPI. [continue reading…]

References

References
1 Note that Patrick Willis had just 3 points of AV in his final year in the NFL.
{ 7 comments }

Carson Wentz and Non-Division 1/FBS Top Ten Picks

North Dakota State quarterback Carson Wentz may be a top-five pick in the NFL Draft this year, although a number of mocks also have him falling outside of the top ten, too. It’s early in draft season, but I thought it would be fun to look at just how weird it would be to have someone from NDSU be selected in the top ten.

The table below shows all players drafted in the top ten since 1967 (the first year of the common draft) from non-Division 1 or FBS schools. The last? Steve McNair, who played at Alcorn State, back in 1995. [continue reading…]

{ 14 comments }

Data Dump: Defensive Points Allowed SRS

Today’s guest post/contest comes from Thomas McDermott, a licensed land surveyor in the State of California, a music theory instructor at Loyola Marymount University, and an NFL history enthusiast. As always, we thank him for his hard work.


In a previous post, I provided SRS-style ratings for all offenses since 1970, using only points scored by the actual offense (including field goals). Today, I’ll do the same thing for defenses – meaning, of course, our “metric” will be points allowed only by the actual defense. [1]To quickly recap: SRS ratings for offense (OSRS) and defense (DSRS) on PFR’s website include points scored by the defense and special teams. To get a more accurate points-based evaluation of … Continue reading

Here’s how to read the table below: in 1970, the Vikings allowed 10.2 points per game, 8.2 of which came from touchdowns and field goals allowed by the defense. This leaves 2.0 PPG scored by their opponent’s defense or special teams (i.e., due to Minnesota’s offense or special teams). [2]In this case, it was the result of three touchdowns off of offensive turnovers and one on special teams, as highlighted by Chase in this post on estimated points allowed per drive. Their 8.2 Def PA/G was 9.5 points better than league average; after adjusting for strength of opponent, their rating remains at 9.5. Their overall points allowed SRS rating (DSRS) is 9.2, meaning PFR’s defensive SRS rating undersells them by 0.3 points. [continue reading…]

References

References
1 To quickly recap: SRS ratings for offense (OSRS) and defense (DSRS) on PFR’s website include points scored by the defense and special teams. To get a more accurate points-based evaluation of offenses and defenses, I weeded these scores out and reran the iterations. I didn’t note this last time, but for those interested: the numbers used do not include any home field advantage adjustment or a cap on blowout point differentials.
2 In this case, it was the result of three touchdowns off of offensive turnovers and one on special teams, as highlighted by Chase in this post on estimated points allowed per drive.
{ 9 comments }

Today’s guest post/contest comes from Thomas McDermott, a licensed land surveyor in the State of California, a music theory instructor at Loyola Marymount University, and an NFL history enthusiast. As always, we thank him for his hard work.


When looking at teams’ offensive SRS ratings (OSRS) on PFR, we know that those number also include points scored by the defense and special teams – punt and kick return touchdowns, interception and fumble return touchdowns, return scores on blocked punts and field goals, and safeties. This makes OSRS not as accurate a point-based rating of the offense “proper” as it could be. But, considering those “non-offense” types of scores make up a small fraction of a team’s overall points scored in a season (the average is around 8% since 1970), we can generally ignore this “hiccup” in the system.

Well, most of us can ignore it; for some reason, I cannot! My curiosity has gotten the better of me, so I decided to run offensive and defensive SRS ratings for each team since the merger, using only points that we would normally credit the offense for scoring (or the defense for allowing) – passing and rushing touchdowns, and field goals. [1]I have to assume that at some point Chase or one of the guys at PFR has run the numbers for “SRS without special teams/defense scores”, but I have yet to find it.

As the title states, this is a data dump; I’m hoping that readers of this site will find the info useful for their own research or general interest. Today, we’ll just look at the offense, I’ll post the numbers for defense in a follow-up post. [continue reading…]

References

References
1 I have to assume that at some point Chase or one of the guys at PFR has run the numbers for “SRS without special teams/defense scores”, but I have yet to find it.
{ 3 comments }

The 2014 Cowboys had a lot of continuity on offense. Each of the team’s 11 main starters on offense started at least 11 games. Quarterback Tony Romo started 15 games, while running back DeMarco Murray, wide receivers Dez Bryant and Terrance Williams, and tight end Jason Witten each started 16 games. The sixth non-lineman starter was usually James Hanna who started 12 games, but even that sells the team short. Hanna played in all 16 games, but started only 12; in four other games, Dallas instead started off with either slot receiver Cole Beasley, third-string tight end Gavin Escobar, or fullback Tyler Clutts on the field over a healthy Hanna.

On the offensive line, Tyron Smith, Travis Frederick, and Zack Martin each started 16 games and made the Pro Bowl; left guard Ronald Leary started 15 games, with the most major injury hitting right tackle Doug Free, who missed three games in the middle of the year with a foot injury, and the final two games (and both playoff games) with an ankle injury.

Things were only slightly hairier on defense. In the secondary, safeties Barry Church and J.J. Wilcox started every game, while cornerback Brandon Carr also played the full slate. Orlando Scandrick started the final 14 games of the year at corner after being suspended for the first two games of the year.

On the defensive line, Jeremy Mincey and Nick Hayden started 16 games, Tyrone Crawford started 15, and George Selvie started 13 games (but played in all 16). The most serious injuries came at linebacker: Rolando McClain started 12 games, Anthony Hitchens started 11, and Bruce Carter started 8 games. Of course, Sean Lee also missed the entire season after tearing his ACL in May.

If you sort the Cowboys roster by number of starts, the top 22 players started 318 games, or 14.5 games per play. That, as you might have guessed, was the most of any team last season:

While Dallas looks pretty good in this analysis, it’s far from exceptional historically. [1]This, at least in part, is due to more specialization in today’s games, and teams being more likely to change the starting lineup (going with three receivers or a fullback instead of two tight … Continue reading Since 1978, 185 teams have had their top 22 starters average at least 14.5 starts.

The table below lists the top 56 teams (a 9-way tie at 48 enlarged a top-50 list) by this metric since 1978. I’ve also displayed each team’s winning percentage in Year N and in Year N+1, with Year N being the initial year in question.

As you might suspect, these teams tended to fare better in Year N than they did the following year. While some regression to the mean is expected, these 56 teams had an average winning percentage of 0.640 in Year N, and then 0.519 in Year N+1. This is too general a study from which to conclude much, if anything, about the 2015 Cowboys. It should go without saying that “starts” are not a perfect proxy for “team health” and even if it were, “team health” is not a good proxy for “amount by which a team was helped/harmed by injuries.” But I did find today’s results interesting enough to share.

References

References
1 This, at least in part, is due to more specialization in today’s games, and teams being more likely to change the starting lineup (going with three receivers or a fullback instead of two tight ends, starting in nickel rather than a traditional base defense, etc.
{ 8 comments }

A quick data dump today. Since 1960, players who record 20+ carries in a game were on the winning side of things 72.7% of the time. Steven Jackson, however, is just 30-31-1 in his 62 games where he has had at least 20 carries. Given that we would “expect” a player to win 45.1 games given 62 games with 20 carries, Jackson’s 30.5 wins falls 14.6 wins shy of expectation. That, perhaps not surprisingly to regular readers, is the worst record relative to expectation among all running backs since 1960.

The table below shows all running backs who had at least 20 games with 20+ carries over the last 55 years, including the postseason. Thurman Thomas is on top of the table because he had 71 games with 20+ carries, and his teams went 63-8 in those games for an incredible 0.887 winning percentage. That gave Thomas 11.4 wins over expectation, the most ever. If you want to sort by a different category (say, win%), you can: the table is fully sortable and searchable. [continue reading…]

{ 6 comments }

I previously looked at points per game by each quarterback in his starts and points per game allowed by each quarterback in his starts. Please check there for the fine print.

Today, we put it all together, for a list of points differential per game in games started by each quarterback.

Again, I’m short on time, so I will leave the commentary to you guys.

{ 9 comments }

Please see yesterday’s post for the fine print. The table below shows the average points per game allowed in games started by each quarterback, minimum 15 games (but the ranks only count for quarterbacks with 50 or more starts).

Again, I will leave the commentary to you guys.

{ 5 comments }

Aaron Rodgers has started 114 games (including playoffs) in his career. In those games, the Packers have averaged 28.5 points per game (including non-offensive scores), the highest average for any quarterback in his team’s starts in NFL history.

The table below shows the PPG average in each quarterback’s starts for all quarterbacks with at least 15 starts. However, since 15 is a pretty low cut-off, I only ranked players with 50 starts; if a player had fewer than 50 starts, I just gave him the same rank as the player above him in the table.

Here’s how to read the table below. Rodgers has started 114 games, his team has scored 28.5 points per game during those games, and he has produced a 76-38-0 record. That translates to a 0.667 winning percentage, and Rodgers is 38 games over 0.500.

I’m again short on time, so I will leave the commentary to you guys, and all the Rams fans out there.

{ 7 comments }

On Tuesday, I looked at quarterback records when their team allows 21 or more points.  Today, a look at records when scoring 21+ points.  I’m short on time, so today’s post will just be a quick data dump.  I leave the comments up to you!

Here’s how to read the table below. Tom Brady has played in 169 games (including playoffs) where his team has scored 21+ points, and he’s posted a 155-14-0 record in those games (translating to a 0.917 winning percentage). On average, teams win about 75% of their games when they score 21 or more points; as a result, we would have expected Brady to win 126.75 games, all else being equal. Since he’s won 155, this means he has won 28.25 more games than expected, the most in NFL history. In general, one might translate this to something like “this quarterback had a good defense.” Among active quarterbacks, Colin Kaepernick, Brady, Joe Flacco, Andy Dalton, and Jay Cutler have the best five winning percentages when scoring 21+ points. [continue reading…]

{ 21 comments }
Previous Posts