≡ Menu

Let’s Ride Away From The End Zone

In 1946, the Pittsburgh Steelers went 5-5-1. While the sum of the team’s parts may have been perfectly average, their components were far from it. The head coach was newly-hired Jock Sutherland, who had been a local hero after taking the Pitt Panthers to four Rose Bowls. After a stint in the Navy during World War II, he returned to the city and coached the Steelers for two seasons, beginning in 1946. In the 10-team NFL, Pittsburgh allowed the fewest points in the NFL at 10.6 per game, a mark that would not be matched again until the Lombardi Packers in 1962. The NFL average in 1946 was 18.9 points per game, and every other team allowed at least 14.4 points per game. Unfortunately, the Steelers offense was as bad as the defense was good: the black and gold finished last in the league in scoring at 12.4 points per game.

That 1946 team was led by Bill Dudley, an all-world star who won the league’s MVP award. In addition to leading the league in rushing yards… and punt return yards and average… Dudley intercepted 10 passes that season! That remarkable fact came despite the Steelers only facing 162 pass attempts that season, meaning Dudley intercepted one out of every 16.2 passes the Steelers defense saw that season. It remains arguably the greatest season of thievery in NFL history.

Those ’46 Steelers were otherwise an unremarkable team, notable for this one fact: Pittsburgh is the last team to finish as the league’s lowest scoring team and to also allow the fewest points in the league. But this year, the 2022 Denver Broncos are challenging that mark. Through 9 games and 10 weeks of the season, Denver ranks last in scoring and first in points allowed. The Broncos have 131 points scored through 9 games — a very bad number although not a particularly low mark for the league’s worst-scoring team. [1]Last year, Houston scored 128 points through 9 games, and this year, the Colts have just one more point than Denver And they have allowed 149 points despite facing 11.8 drives per game (thanks, offense), tied for the most in the NFL.

A few teams have come close to pulling off this rare achievement, but it’s remarkable to consider that no team has done this since Sutherland’s Steelers. [2]Only one team has gone in the other direction: the 2000 Rams led the league in scoring but also ranked last in points allowed. There have been just 31.1 points per game scored in Broncos games this season.  In the last 25 seasons, only two other times has that happened: the famed 2000 Ravens teams, and the 2005 Bears team that tried to replicate that approach, using Brian Urlacher as Ray Lewis and Kyle Orton as Trent Dilfer. [continue reading…]

References

References
1 Last year, Houston scored 128 points through 9 games, and this year, the Colts have just one more point than Denver
2 Only one team has gone in the other direction: the 2000 Rams led the league in scoring but also ranked last in points allowed.
{ 2 comments }

Adjusted Interceptions: Career Totals

Yesterday, I did a fairly simple analysis to compare interception numbers across eras. Because I covered the methodology in the previous post, I am not going to regurgitate that information here. Instead, I want to just get right into it. When I did the career adjusted sacks post, I went step-by-step in the same manner I did in the single season article. This time, however, I think we can skip past all that and look at the end results.

Career Adjusted Interception Totals

The first table is sorted by the last column, but you can re-sort by any header you like. Using Rod Woodson as an example, here’s how you read the table: Woodson intercepted 71 passes against 8401 attempts at a 0.85% rate. His passing environment modifier (Mod) is worth 142%, and the softened version of that (Soft) is worth 121%. Taking the average of his actual interceptions and interceptions per 500 attempts in order to account for volume gives us the Mid adjustment, which is 98% in Woodson’s case. Applying my homebrewed league strength multiplier (LSM) gives him a 99% adjustment.

If we multiply Woodson’s 71 interceptions by Mod, Mid, and LSM, we get a whopping 97.7 adjusted interceptions for his career. If we dampen it by multiplying those 71 picks by Soft, Mid, and LSM, Woodson’s career adjusted interceptions come to 83.2, good for the highest mark ever. [1]For the ModTot, that’s 71 * 142% * 98% * 99%. For the SoftTot, that’s 71 * 121% * 98% * 99%.

Using the actual historical average as a baseline appears to be a bit much, going by the numbers it produces. I think having Charles Woodson, Ed Reed, Rod Woodson, a serial rapist, and Aeneas Williams as the top five (by ModTot) is fine; giving Chuck credit for 101 interceptions is a bit much for me. Moving the all time leader in picks, Paul Krause, down to ninth also feels a tad harsh as well. Sure, I think he tends to be overrated by people who look at one number and base their entire evaluation on that single data point, but I also think having such a commanding lead over any modern player should count for something. For this reason, I think the SoftTot column produces results with greater face validity.

The last column gives us a top ten of seven Hall of Famers, one senior candidate who will likely get the necessary votes soon, possibly the best safety of the 1990s who would be in Canton already if he played for Dallas or San Francisco, and a a vile monster who was good at picking off passes and not really much else.

Let’s Be Reasonable

The wacky looking career totals form the table above convinced me to try using a new baseline. I decided to use the last 40 years of football, which incorporates nearly the entire period of open offense football. [2]I refer to football in the wake of the Mel Blount Rule and rules enabling offensive linemen to extend their hands to block in 1978, as well as the subsequent offensive revolution heralded by the … Continue reading When I looked at that timeframe, the historical baseline moved from 4.80% to 3.16%. because of that, I have dubbed the new baseline the Austin Percentage. Having a lower baseline means that fewer players will see their totals go up, and only the most recent players will their totals go up significantly.

The table below is sorted by the last column, but you can sort by any of the headings. Using Krause as our example, read the table thus: Krause picked off 81 passes against 5623 attempts at a 1.44% rate. His volume adjustment is worth 117%, and his league strength multiplier is worth 88%. His Austin figure is 60%, which comes to 80% when the effect is halved. [3]Recall from the first table that his Mod and Soft were 91% and 96% because of the highest baseline. If we apply the Mid, LSM, and Austin modifiers to Krause’s 81 actual interceptions, his total plummets to 49.9, which ranks tenth on the career list. If we replace the Austin modifier with the softened version, Krause’s number falls to just 66.4, which allows him to maintain his place atop the interception mountain. [4]To arrive at the numbers in the Austin column, we use: 81 * 117% * 88% * 60%. To find the results for the HalfTot column, we use: 81 * 117% * 88% * 80%. These figures are rounded and will produce … Continue reading

If you earnestly believe older players relied too much on archaic passing to glean their big interception totals, the Austin column might be for you. Before we find Krause at number ten, only Rod Woodson and Eugene Robinson had any action prior to 1990. Recent ball hawk Richard Sherman is in a fourteen-way tie for 104th place in career interceptions, with 37. However, when Austin 3.16 comes around, Sherman jumps to 18th, which does feel more appropriate for one of the premier turnover artists of recent vintage. In fact, his 8.4 interception boost is the highest number of any player, just beating out the bonuses of 8.3 and 8.1 for fellow playmakers Xavien Howard and Marcus Peters. Wandering mercenary Aqib Talib finds himself pretty high on the career list when looking at the Austin total.

While some recent players saw modest gains, older players saw their totals fall off a cliff with the lower baseline. Emlen Tunnell, a real life hero who picked off 79 passes—but did most of his damage in the 1950s—suffers a reduction of 43.6 from his total. He goes from ranking second on the official list to 54th on the Austin list. That seems a little steep, even to a noted old school player hater like I am. Night Train Lane and Johnny Robinson join Krause and Tunnell as the only other players to lose at least 30 from their totals. Turn-of-the-century players like Sam Madison and Patrick Surtain see almost no change in their career numbers.

I think the last column makes the most sense at first glace. Tunnell, Robinson, and Jim Norton all lose more than 20 from their real numbers, and no one gains more than 3.6. Krause loses 14.6, but because Tunnell lost 22 and his lead over anyone else was huge, he remains in first place. Rod Woodson loses 4.7 from his total, while Charles Woodson and Ed Reed each lose about half a pick, resulting in the three ending pretty clustered, and all close to Krause at the top. While Tunnell has a large reduction, his actual number of interceptions was so high to begin with that he still ranks sixth here.

I am often interested to see where Ken Riley and Dave Brown will fall, relative to one another. Riley has 65 interceptions to Brown’s 62. The Austin adjustment puts Brown ahead, while my preferred adjustment leaves the Bengals legend with a 54.6 to 53.4 lead. Riley never made a Pro Bowl, but he earned first team all pro honors once and second team honors twice. Brown made one Pro Bowl and one all pro second team. Given how close together these two are in terms of actual production, the gap in their public perception is pretty interesting to me. When you consider the fact that Brown was his team’s top corner, while Lemar Parrish was the top corner in Cincinnati until 1977, the issue is further muddled.

I will leave further commentary to the FP faithful, if any remain.


References

References
1 For the ModTot, that’s 71 * 142% * 98% * 99%. For the SoftTot, that’s 71 * 121% * 98% * 99%.
2 I refer to football in the wake of the Mel Blount Rule and rules enabling offensive linemen to extend their hands to block in 1978, as well as the subsequent offensive revolution heralded by the likes of Bill Walsh, Don Coryell, and Joe Gibbs.
3 Recall from the first table that his Mod and Soft were 91% and 96% because of the highest baseline.
4 To arrive at the numbers in the Austin column, we use: 81 * 117% * 88% * 60%. To find the results for the HalfTot column, we use: 81 * 117% * 88% * 80%. These figures are rounded and will produce slightly different results if you copy and paste to work with them yourself.
{ 2 comments }

Adjusted Interceptions: Single Seasons

I recently reopened a discussion about sacks Chase started years ago. Today, I’m going to rehash another topic our prolific host has covered time and again (and again): adjusting interceptions for era. Unlike sacks, which have official number dating back to 1982 and unofficial ones published as far back as 1960, interceptions have official records as far back as 1940. This gives us much more data to work with, but it also provides similar challenges that Sid Luckman presents when adjusting passing stats: the game is so different now from what it was in the 1940s that trying to compare the numbers side by side ends up killing newer players when adjusting for dropbacks or hurting older players when adjusting for passing environment. But getting it 85% right is better than not doing anything at all, so I’m going to do it anyway. As I did with the sack posts, I will go through my progressions of adjustments one step at a time, so that you can see how we arrived at the final numbers.

Normalizing for Volume

It stands to reason that intercepting ten passes against 300 attempts is more impressive than intercepting the same number of passes against 600 attempts—at least, as far as getting interceptions is at all impressive when divorced from other aspects of play. Because of this, it is necessary to put players on a more even playing field. Using Bill Dudley‘s frankly ridiculous 1946 season as an example, follow the table like so: Dudley, playing in 1946 for the Steelers, appeared in 11 games and snagged 10 interceptions against 162 opponent pass attempts. That comes to an outlandish 6.17% interception rate. If we adjust for volume by giving all players credit for their interception rate multiplied by 500 attempts, Dudley’s 1946 comes to 30.9 picks per 500 passes. If you look at that number and mutter “well, that’s just too high,” then we are in agreement. Thus, I took the average of their actual picks and their attempts per 500 passes to find the number in the last column, which I have labeled Mid. Using that adjustment instead, Dudley’s season was only good for 20.4 volume-adjusted interceptions.

If we stop here, it’s easy to see the glaring issue: the much higher interception rate in the days of yore leaves us with a list that doesn’t feature it’s first player after the year 2000 until the 210th spot. Even using the mid number, Ty Law‘s 2005 doesn’t show up until 115. Clearly, we need to keep going.

Incorporating League Environment

The next step is to incorporate the league average interception rate for each season. To do this, I used all seasons from 1940-2021 and found the three-year rolling average, with each given year in the middle (So 2017 would include the average of seasons 2016-2018). Then, I found three numbers: the cumulative interception rate from 1940-2021 (4.02%), the average of averages for each year in the sample (5.18%), and the median rate from the sample (5.21%). Then I took the average of those three numbers (4.80%) and used it as the historical baseline.

The next two tables use this step. The first of the two displays adjusted interception rates, while the latter of the two displays adjusted totals. Using Xavien Howard‘s 2020 as an example, read the table thus: Howard played 16 games and had 10 interceptions against 545 attempts, good for a 1.83% pick rate. The rolling average for 2020 is 2.28%, so Howard gets a boost of 210.5% (4.80/2.28) in the column labeled Mod. If you think that’s too higher, I included a softened version, which is the average of Mod and 100% (in this case, the Soft number is 155.2%). When using the Mod figure to adjust his interception rate, Howard gets credit for a rate of 3.86% (that’s 1.83% * 210.5%), the highest number on record. Using the softened version gives him 2.85% (1.83% * 155.2%), which ranks 18th.

This one is interesting to me, because the modified version seems too skewed in favor of modern players, while the softened version doesn’t feel harsh enough toward the old guys. We’ll go to the table below to see what that looks like in terms of interceptions rather just the more abstract percentages.

Incorporating League Environment (Again)

Let’s use J.C. Jackson as our example this time. In 2020, he played 16 games and hauled in 9 interceptions. We know his adjusted rates from the table above. Using the full modifier on his actual interceptions gives him 18.9 adjusted interceptions, while using the soft modifier gives him 14.0. Jackson is the rare current player who actually gets a boost from using per 500 attempt numbers, albeit a small one. Using the full modifier multiplied by his interceptions per 500 attempts (9.1 from the first table) leaves him with 19.2, while using the softened version gives him credit for 14.1. Note, I did not use the Mid figure from the first table, because too many columns makes these things unwieldy, in my opinion. Instead, I saved that for the last table.

Looking at the Mod and Soft multipliers applied to interceptions, without accounting for volume, just leaves us with a huge list of recent players. While I believe modern defenders to be both superior and in a more difficult position because of rules and schemes, I don’t think it makes sense to give them this much of a boost. Especially when the point of this whole exercise is not to measure the quality of a player, but rather use a variety of factors to more appropriately compare his interception totals to those of other defenders. One need only look at the career of Darrelle Revis to know that having a relatively low turnover total doesn’t preclude a player from greatness. And Ken Riley‘s career makes it evident that a player can find himself quite high on the career pick list without having been the best cornerback on his own team during his prime.

Putting it All Together

Below is the final table for today. Here, I have tried to strike a balance between adjusting for volume and adjusting for environment, but I kept battling with myself over whether I preferred full rate modifiers or soft ones. So I decided to just present both and let the reader decide. Using the controversial 2021 Trevon Diggs season, read the table thus: in 16 games, Diggs had 11 interceptions against 612 passes, good for a 1.80% rate. His Mid volume adjustment (from the first table) is worth 91%. That, combined with his 211.2%environmental modifier (Mod from the second table) gives him 21.1 adjusted interceptions in the Mod-Mid column. Using the Soft modifier instead gives him 15.5.

Instead of using the 4.80% historical baseline that I found, Chase most recently used 3.5%. Doing so doesn’t do much to the orders of the lists any, but it does have a significant impact on the totals by degree. So Diggs would still rank first in the Mod-Mid column and second in the Soft-Mid column, but he would have something closer to 15.4 and 12.7 as his adjusted interception total. While these numbers are more or less abstract and don’t really matter, I do think having the lower baseline Chase used produces results that look more realistic, even if the 3.5% figure was chosen at random (and I don’t know if it was or was not chosen at random). In fact, when I looked at career totals, I actually preferred to use an even lower baseline of 3.16%, which represents the last 40 years of football and covers basically the entire period of post-1978 rules changes that help permanently drop leaguewide interception rates below five percent.

When looking at the results above, the last column seems to produce the most even mix of old and new players. Oddly, however, I may prefer the Mod-Mid column when looking at career totals, which we will see later.  [1]How much later, I simply cannot say. Regardless, I think accounting for both volume and passing environment, in some form or fashion, helps put the numbers into more proper context. Even if it does take a little shine off my man Dick Lane.


References

References
1 How much later, I simply cannot say.
{ 2 comments }

Adjusted Sacks: Career Totals

Recently, I reintroduced the concept of adjusted sack numbers for individual player seasons. [1]I say recently because Chase published an article about the idea as early as 2015, and I recall reading articles that touched on the issue at the old PFR blog. The logical next step, to me, is to take a look at those stats in the context of full careers. I liked the idea of presenting career data in terms of per-500 dropback metrics and cumulative totals. On top of the methodologies we discussed in the last post, I also wanted to introduce two new ways to look at the information. I hope it proves interesting, and I apologize in advance for my spectacular inability to come up with better acronyms, initialisms, and abbreviations.

Normalized for Volume

The table below contains every player in history with at least 30 sacks (or 30 in the last column) since 1960. Read it thus: Deacon Jones played in 191 games and recorded 173.5 sacks against 5891 dropbacks. His 2.95% career sack rate means he was good for 14.7 sacks per 500 dropbacks over the course of his entire career. If we take his sacks per 500 dropbacks totals from each season and add them together, we get 203.3, which is easily the highest mark ever.

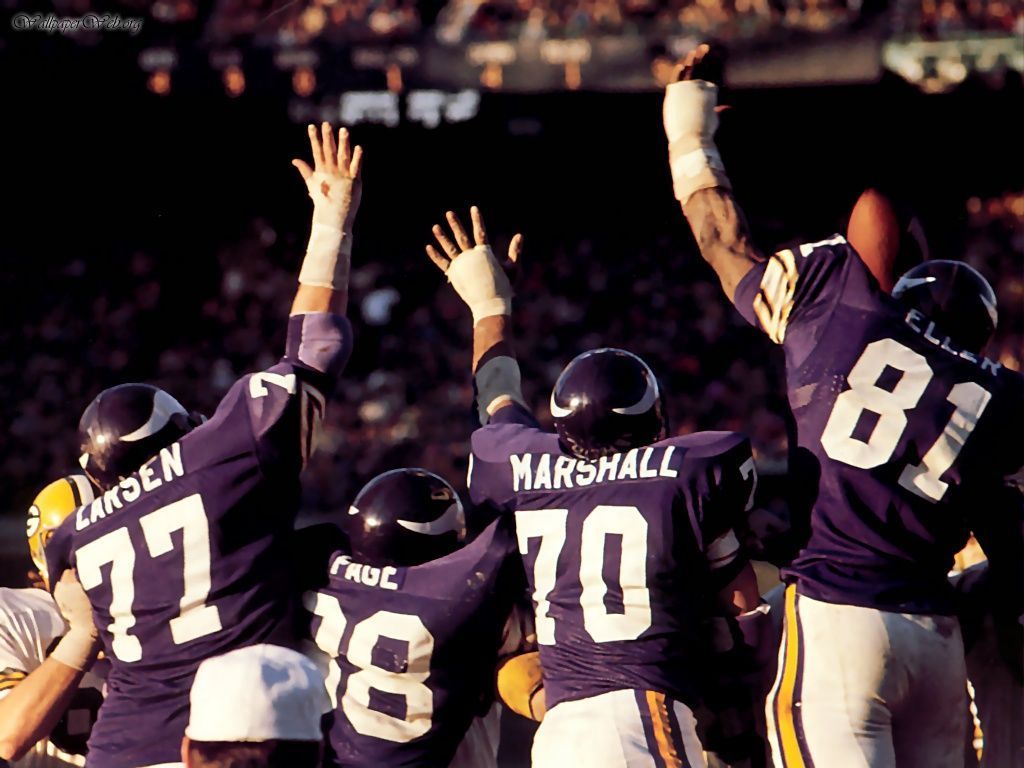
As you probably expected, older players and T.J. Watt dominate the S/500 column. Guys like Robustelli and Marchetti played against offensive linemen hamstrung by rules, while Watt is a quarterback killer still in his prime. When we look in the last column, we can see how much the small differences in each season add up to a big gap between Bruce Smith and Reggie White. Three members of the Purple People Eaters appear in the top eight, though one guy took an additional sixty-ish games to get there.

Also, is it possible that the Hall of Fame actually doesn’t like pass rushers as much as people think?

League Environment Incorporated

In order to account for the easier environment for getting into the backfield long ago, we will use the modified and soft-modified conversions we used in the last article. The table contains any pass rusher who recorded at least 30 actual sacks or reached 30 in either of the last two columns. Read it thus: Alan Page played 218 games and recorded 148.5 sacks against 6348 dropbacks, which is good for a rate of 2.34%. His modifier is worth 91.5%, which becomes 95.7% when softened. For his career, he had 10.7 modified sacks per 500 dropbacks and 11.2 soft-modified sacks per 500 dropbacks. If we take the cumulative totals of those two stats, Page had 160.7 and 169.9, respectively.

When we look at the Soft500 column, we get a fun mix of characters. The Deacon is on top, followed by the younger Watt. Then we get another legend followed by another guy with scant games under his belt. Marchetti and Robustelli have a significant chunk of their careers omitted from this study because Turney and Webster haven’t finished their work on pre-1960 sacks, but the fact that they rank so highly on a per season basis despite not having years prior to their mid-thirties demonstrates how apt they were at pass rushing.

Alex Karras probably would have been in the Hall of Fame earlier were it not for his gambling controversy, while Claude Humphrey likely belongs on more lists of greatest pass rushers. Watch his tape, and you’ll see a guy whose athleticism stands out in the same way that Len Ford‘s did earlier or Julius Peppers‘s did later. Coy Bacon ranks tenth in the SoftTot column. He is a mere 4.3 below Jim Marshall, despite appearing in over one hundred fewer games.

Concentration Accounted For

Now it’s time to take pass rushing depth into consideration by applying a league concentration adjustment to each player. Here’s how to read the table, using Reggie White as an example: White’s career concentration adjustment is worth 1.036, meaning he gets a 3.6% boost to his stats from previous steps. For comparison’s sake, he had 198 actual sacks. When applying the concentration adjustment to his sacks per 500 dropbacks, his number comes to 11.7. If we include the modifier for league sack environment, that number jumps to 12.1. Softening that modifier brings his number down a bit, this time to 11.9. When we add all of White’s single-season figures in concentration-adjusted sacks per 500 dropbacks, his career total is 177.7. The cumulative number for the modified version of that comes to 181.1, and the softened iteration totals 179.4.

The thing that stands out to me is the placement of John Abraham. He is tied for eighteenth on the official sack list but jumps to thirteenth when sorting by the penultimate column. Abraham made five Pro Bowls and three all pro first teams, which doesn’t scream “Hall of Fame,” but he had eight seasons with double digit sacks and two more seasons in which he missed games but still notched 9.5 sacks. In 2003, he played in just seven games but managed 6 sacks. Had he stayed healthy in 2003-04, he likely would have had five consecutive seasons with 10+ sacks after becoming a starter. Abraham was a few injuries away from retiring with eleven seasons in the double digits. I remember watching footage of the highly celebrated Robustelli and thinking his postseasons honors indicate a Reggie White level of play but the tape suggested he was more akin to John Abraham. The per-season numbers in this table support that notion. If the second best Bengals cornerback of the 1970s can make it to Canton, maybe Abraham has a chance at a senior nod one day. [2]Note, I wouldn’t put him in, but with the bar being set at the Sprinkle and Riley level, I don’t think I know what a HOFer is anymore.

Dominance Exalted

The table below displays what I think is a more accurate representation of what we think about when we think about great pass rushers. Instead of career compilation, we’re looking at career value over a given baseline. [3]Refer to the previous article for the methodology. Read the table thus: Jack Youngblood played in 202 games and recorded 151.5 sacks. For his career, his sack rate was 1.04% better than the league baseline, giving him 5.2 extra sacks per 500 dropbacks. When summing his individual seasons in that metric, he was worth 74.3 sacks above baseline. If we apply the concentration adjustment to his career numbers, he was worth 69.8 added sacks. When we get rid of all seasons that are below average and look only at what might be considered peak production, Youngblood’s value jumps to 72.4.

This table is a numeric representation of why Jim Marshall can rank 23rd in career sacks and not make it to the Hall of Fame. For his career, he was barely above the baseline, meaning he was ultimately worth about 19 extra sacks. Compare that with Bacon, who shares a ranking on the unofficial career list. Because his sack performances were more dominant, his career sack value is 54.7, which puts him in elite company. Cedrick Hardman, Simeon Rice, Harvey Martin, and Jack Gregory are a few other players who stand out as dominant sack artists who may be underrated now.

Something New

I figured I would throw in a few new concepts just to round out the discussion. I have long been a fan of Pro Football Reference’s passing index scores, and I have created my own versions of them for several different stats. This time, I applied the methodology to defensive sack rates. Also, because the results of the single season and career numbers still seem to favor older players, despite the entire purpose of this exercise being to translate across eras, I wanted to incorporate the league strength modifiers I have been working on for the past several years. [4]These take into account things like integration vs segregation, positional specialization, league attractiveness vs other sports, pay, the existence of rival leagues, U.S. population of NFL-aged men, … Continue reading People who lament that football today isn’t like the football idealized by marvelous NFL Films creations may not like this.

The below chart shows every player with at least 3000 dropbacks faced. Using Jared Allen as an example, read the table thus: Allen had 134 sacks against 6426 dropbacks for a 2.09% sack rate. His sack rate was nearly a full standard deviation above the median, giving him a sack rate+ of 113.5. [5]Highest on record, min 3000 dropbacks faced. T.J. Watt will take over the top spot soon. He currently has a rate+ of 117.2. Nick Bosa and Micah Parsons are also higher than Allen, though they are … Continue reading His concentration-adjusted career sack value, after accounting for league strength, is 61.1. When we look at only his positive value seasons, it raises slightly to 61.7.

I believe the top ten, as ranked by the last column, is a great list of stellar sacksmiths. A decent era range shows up, and there doesn’t seem to be too much skew toward older or newer players. However, this may be because it more closely lines up with my subjective view of these players, and we love to have our priors confirmed.

The lowest ranked players on the list are linebackers who had a decent number of sacks but played in coverage too often to reasonably compete with edge rushers, as well as interior linemen who played a ton of snaps but weren’t primarily pass rushers.

What stands out to you?


References

References
1 I say recently because Chase published an article about the idea as early as 2015, and I recall reading articles that touched on the issue at the old PFR blog.
2 Note, I wouldn’t put him in, but with the bar being set at the Sprinkle and Riley level, I don’t think I know what a HOFer is anymore.
3 Refer to the previous article for the methodology.
4 These take into account things like integration vs segregation, positional specialization, league attractiveness vs other sports, pay, the existence of rival leagues, U.S. population of NFL-aged men, number of players playing high school and college football in preceding years, etc.
5 Highest on record, min 3000 dropbacks faced. T.J. Watt will take over the top spot soon. He currently has a rate+ of 117.2. Nick Bosa and Micah Parsons are also higher than Allen, though they are much further from reaching the 3000 dropback threshold.
{ 1 comment }

Adjusted Sacks: Single Seasons

In 2015 (and, again, in 2018), Chase published his methodology for comparing individual sack seasons across eras. At the time, we had only the official numbers available, so the comparisons didn’t capture any performances prior to 1982. Now, thanks to the work of dedicated researchers John Turney and Nick Webster, we have reliable sack data dating back to 1960 (with more likely to come in the future). [1]Thanks to Webster, specifically, we also have the numbers for Len Ford‘s outlandish 1951 campaign. Although I don’t have the same context for that season, I will be including it with … Continue reading With all the new information available, I was excited to pick up where Chase left off and include the additional 22 years of preceding data. Because of the new seasons included, the results of this post will differ from Chase’s, even among players included in the original article, so this should offer some new insight beyond adding names to the list.

Normalizing for Volume

The first step is to account for the fact that teams throw the ball more frequently today than they did in the sixties, eighties, or even the aughts. To do this, I am going to do what Chase did, because it seemed like a reasonable first step to me. That first step is to find the number of dropbacks a player’s team faced that season and calculate the percentage of those plays on which he sacked the quarterback. [2]There is a case to be made that one should only include dropbacks in games which players participated. So Jared Allen would only count as having played 14 games in 2007, rather than 16 games. … Continue reading Next, we multiply that number by 500 in order to put pass rushers on a more even playing field.

Take Cleveland Elam‘s 1977, for example. He dropped opposing quarterbacks 17.5 times while the 49ers faced just 312 dropbacks. That gives him an incredible 5.61% sack rate, which translates to 28.0 sacks against 500 dropbacks. [continue reading…]

References

References
1 Thanks to Webster, specifically, we also have the numbers for Len Ford‘s outlandish 1951 campaign. Although I don’t have the same context for that season, I will be including it with those from 1960 onward.
2 There is a case to be made that one should only include dropbacks in games which players participated. So Jared Allen would only count as having played 14 games in 2007, rather than 16 games. However, I think availability is important and don’t wish to further bolster a player for missing time during the season.
{ 4 comments }

There have been 13 games this season where a team has allowed 100 or fewer passing yards. The San Francisco 49ers have caused 5 of those games.

Through 11 games, San Francisco has allowed just 1,506 passing yards. That’s the fewest by any team through 11 games since the 1989 Minnesota Vikings, and it’s the second lowest amount for any team after 11 games since 1980.

This year, the average team is gaining 235 passing yards per game, which is of course net of sack yards lost. The 49ers are allowing just 137 passing yards per game to opponents, for well, a variety of reasons:

  • The 49ers have caused opponents to lose 348 yards due to sacks this year, the most in the NFL.
  • The 49ers are allowing just 9.4 yards per completion, the lowest rate in the NFL.
  • The 49ers have sacked opponents on 11.8% of dropbacks, the best rate in the NFL.
  • The 49ers are allowing a 60.0% completion percentage, tied for the 2nd-best rate in the NFL. That’s why San Francisco is allowing just 4.0 net yards per pass attempt, the lowest in the NFL.
  • Despite the 49ers usually playing with a lead, opponents appear afraid of throwing on San Francisco, probably because it is so hopeless.
  • And yes, they’ve had some help: a driving rainstorm in a game against Washington, and a run defense that is actually quite porous. Teams have actually been more efficient running against San Francisco than throwing against that defense.

So how good is this pass defense through 11 games once you account for era — at least, in terms of preventing passing yards? Well, maybe the best ever? San Francisco is allowing 98.5 fewer passing yards per game than league average through 11 games, which is the best performance by any pass defense since 1950. The table below shows the top 100 pass defenses by this metric:
[continue reading…]

{ 1 comment }

The Patriots Pass Defense Is Impossible

We are never going to see this level of statistical dominance by a pass defense again.

That’s a pretty bold statement from a pretty conservative blog focused on football history. But 1 passing TD allowed and 18 interceptions in a 7-game stretch?

That will never happen again, and frankly, we may not ever see anything all that close to it happen again. In 2018, the NFL finally exceeded a 2-to-1 ratio of passing touchdowns to interceptions, and the long-term trend is clear: more touchdown passes, fewer interceptions. This season, the 31 pass defenses in the NFL outside of Foxboro have allowed 319 passing touchdowns and forced 155 interceptions, a 2.06-to-1.00 ratio. But the Patriots have forced opposing passers into a 1-to-18 ratio. Include New England’s pass defense, and the NFL’s TD/INT ratio drops to 1.85-to-1.00.

That. Is. Absurd.

Yes, the quarterbacks have been bad. Really bad in some cases (Luke Falk, Josh Rosen), but it also includes games from Ben Roethlisberger, Sam Darnold (coming off a dominant performance), and occasionally competent passers like Case Keenum, Josh Allen, Daniel Jones, and Ryan Fitzpatrick. But it doesn’t matter: if you would have asked me could the best defense in the NFL produce a 1-to-18 ratio against the worst quarterbacks in the NFL for a 7-game span, I would have said no.

This is obviously unsustainable but it is so far to the right tail of comprehensible that you just have to look at the stat line in awe. And know that something like this will never happen again. New England’s defense has posted a passer rating of 35.6; if you throw an incomplete pass on every plat, that’s a 39.6 passer rating! New England is allowing less than 1.0 ANY/A over 7 games! If a running back had 1,000 yards on his first 100 carries of the season, that would be unsustainable, too, but it wouldn’t make it any less remarkable. It might make it more remarkable, because this transcends any notion of what we would think possible.

The graph below shows the TD% (on the X-Axis) and INT% (on the Y-Axis) for each pass defense this year. To make “up and to the right” the good part of the graph, I have plotted the TD% in reverse order. As you can see, the Patriots pass defense stands alone. [continue reading…]

{ 0 comments }

The 2018 Bucs led the NFL in passing first downs and passing first down percentage for the second straight year. For the most part, passing first down percentage tells the story of how successful a team will be.

Passing first down percentage is defined as passing first downs divided by total team pass attempts (which includes sacks). The Bucs led the NFL at 39.8%, and were followed closely by four 12+ wins teams: the Rams (39.3%), Chiefs (39.2%), Chargers (39.0%), and Saints (39.0%). The bottom 8 teams in passing first down percentage all lost at least 9 games, with the Cardinals (25.0%), Bills (25.4%), Jaguars (27.8%), Jets (28.0%), and Redskins (28.2%) in the bottom five.

But Tampa Bay still went 5-11, because despite being outstanding at picking up first downs through the air, the Bucs had three problems:

  • Tampa Bay had 35 turnovers, the most in the NFL.
  • The Bucs running backs were very bad: they had 296 carries for just 1,049 yards (3.5 YPC) and picked up only 50 first downs. The 1,049 yards and 50 first downs were the fewest in the NFL by any set of running backs.
  • Tampa Bay’s pass defense was also atrocious, which is the point of today’s post.

The Bucs pass defense allowed first downs on 36.5% of all passing plays, which was the worst rate in the NFL. And like most of the teams at the bottom of the list that didn’t have an MVP caliber quarterback, they were unsuccessful last year. [continue reading…]

{ 0 comments }

The Chicago Bears have the best pass defense in the NFL this year. The Bears held (i) Aaron Rodgers and the Packers to 4.04 ANY/A in week 15, the worst performance by Green Bay this year, (ii) Jared Goff and the Rams to an ANY/A average of -0.38, the worst performance by Los Angeles all season, and (iii) the high-powered Tampa Bay offense to 3.24 ANY/A, the worst game by the Bucs all year. Chicago also held Kirk Cousins and the Vikings to their 2nd-worst game of the year.

On the other hand, Brock Osweiler — yes, that’s right — had the best performance by any quarterback this year against the Bears, averaging 7.95 ANY/A. I went ahead and calculated how each team fared in ANY/A in each game this year, and then ranked each team’s performance in each game.  Then, I looked to see how each defense did relative to those numbers: did they hold the opponent to their worst game of the year, second worst, third worst, and so on.

Here’s how to read the table below: on average, Bears opponents had their 5th worst game of the season against Chicago. That gives the Bears the top pass defense in the league. The individual ranks and games are listed: Green Bay, the Rams, and Tampa Bay had their worst games against Chicago, Minnesota their second worst, Buffalo, Detroit, and Seattle their third worst, and so on.

This is a fun table to examine: for example, the Jaguars are having a down year, but you can easily see that they had outstanding performances against three of the top QBs in the AFC.  The Colts, Steelers, and Chiefs all had their worst passing games of the year against Jacksonville. [continue reading…]

{ 0 comments }

It looks like Raiders All-Pro edge rusher Khalil Mack is being traded to the Chicago Bears.

Yesterday, Aaron Donald signed a record-setting contract at $22.5M per year with nearly $87M guaranteed. We can be sure that the Bears are about to give Mack something very similar, and likely slightly more rich, than what the Rams paid to Mack. After trading two first round picks plus something else (we should hear soon), Chicago is not going to fight with Mack over a few million dollars.

What are the Bears getting in Mack?
[continue reading…]

{ 0 comments }

Four years ago, I wrote an article about the — at the time — young and improving Seattle pass defense. It’s hard to compare modern defenses to what we saw in the ’70s, as the game has changed significantly in the favor of more impressive passing numbers.

But what we can do is compare each pass defense in each season to each other pass defense. In 2013, the Seahawks allowed 3.19 Adjusted Net Yards per Attempt, while the league average was 5.98. That’s a difference of 2.79 ANY/A, and the standard deviation among the 32 pass defenses was 0.95 ANY/A. In other words, the Seahawks were 2.93 standard deviations better than average (2.79 divided by 0.95).

This year, the Jaguars are allowing 3.52 ANY/A, and the league average is an almost identical 6.01. So Jacksonville is 2.49 ANY/A better than average, and given the standard deviation of 0.94, it means the Jaguars pass defense has a Z-Score of 2.65.

That would rank as the 6th best since 1950, behind the ’02 Bucs, ’88 Vikings, ’70 VIkings, ’13 Seahawks, and ’82 Dolphins. The 3.52 ANY/A average is the lowest since the 2013 Seahawks, and the second lowest since the 2009 Jets (who played in a less friendly passing environment; the league average was 5.74 ANY/A).

If you look at the NFL passing statistics through 13 games (well, 12 for the Dolphins and Patriots), it’s easy to see why the Jaguars pass defense is so good. It’s because they’re great at literally everything. The table below shows the team’s rank in every major category: top-5 finishes are in pink, and #1 finishes are in red with white font. [continue reading…]

{ 6 comments }

Over the first two weeks of the season, the Saints had the worst pass defense in the NFL. New Orleans was torched by Sam Bradford and then Tom Brady — which admittedly looks less embarrassing in hindsight — as those two quarterbacks produced arguably the best two performances of the NFL those weeks.

Since then? New Orleans has had the best pass defense in the NFL by a considerable margin. The table below shows passing stats for each defense from weeks 3 through 10. Here’s how to read the Saints line. New Orleans has the best pass defense over that time period, and has won 100% of the team’s games. Opponents have completed only 121 of 226 pass attempts for a 53.5% completion rate, and are averaging only 9.8 yards per completion. The Saints have allowed just 1,036 passing yards (this is net of sacks), 5 TDs, and 10 INTs, while producing 22 sacks. Opponents have a 57.4 passer rating and have thrown for just 54 first downs. Finally, opponents are averaging just 2.77 ANY/A, and 4.54 Adj YPA (which includes a bonus for first downs), and have allowed a whopping 1,005 fewer adjusted yards than average, easily the best in the league. [continue reading…]

{ 5 comments }

The Purple People Eaters

Last Monday, I provided some initial thoughts on the relative values of completion and passing first down percentage. The next day, I looked at how teams with disparate performances in those two metrics. And last Wednesday, I looked at the best passing offenses in NFL history in first down rate on passing plays.

Today? A look at the best pass defenses at preventing first downs.  This time, I am also going to era adjust these ratings. In 1969, the Vikings faced 459 pass plays (410 pass attempts, 49 sacks) but allowed only 88 passing first downs. That’s a remarkable rate of just 19.2%, the best since World War II.   It’s also the best rate on an era-adjusted basis.  The league average in the NFL in 1969 was 29.0%, which means this iteration of the Purple People Eaters was 9.8% better than league average, the highest differential ever. [continue reading…]

{ 7 comments }

When it comes to the AP Defensive Rookie of the Year award, one thing is clear: being a high draft pick really, really helps. On average, the last 15 players were drafted with the 11th overall pick, and all but one was a top-18 pick! This award is extremely skewed in favor of early draft picks. Take a look:

[continue reading…]

{ 5 comments }

Today’s guest post/contest comes from Thomas McDermott, a licensed land surveyor in the State of California, a music theory instructor at Loyola Marymount University, and an NFL history enthusiast. As always, we thank him for his hard work. You can view all of his work at Football Perspective here.


If you can get five people in a room to agree on what a sports dynasty is, you’ll probably have achieved the most miraculous agreement in history since the Congress of Vienna. We know a sports dynasty when we see one (the current Patriots, the New York Yankees, 1990s Bulls, etc.), but it becomes less clear once we attempt to actually define it:,When does the dynasty start? How long must it last? What are the requirements?

In this article on NFL dynasties, FiveThirtyEight does a nice job of negotiating the quagmire by just listing the “best team over any number of years”. [1]Their definition of “best” being their ELO ratings. I’m going to do the same thing here, but focusing solely on NFL defenses since the merger (regular season only). The metric is points allowed by the defense (meaning: fumble, interception, kick and punt return touchdowns, and safeties aren’t included), adjusted for era and strength of schedule (basically, SRS ratings). Regular readers may recall that I published these results back in August 2015. To differentiate this stat from Pro-Football-Reference’s DSRS, I’ll call it “DfSRS”.

Below is a table of defensive dynasties, ranging from 1 to 15 years: [continue reading…]

References

References
1 Their definition of “best” being their ELO ratings.
{ 15 comments }

In general, sack data for team defenses is not super consistent from year to year. Since 1990, the correlation coefficient between sack rate (for defenses) in Year N and sack rate in Year N+1 is 0.27. The best-fit formula (using a linear regression cover the years from ’90 to ’16) to predict sack rate for next year would be to use a constant of 4.8%, and then add 26% of the defense’s sack rate from the prior season.

That’s not too surprising of a result, but I was curious whether adding  each team’s concentration index would help make sacks more predictive. As it turns out, the answer is a little complicated. I ran the same regression as above, but used each defense’s concentration index as a second variable.  The change didn’t improve the correlation at all, and the p-value on the concentration index variable is 0.65, making it essentially meaningless.  But it may be a little more complicated than that.

The team with the biggest decline since 1990 in sack rate, year over year, is the 2008 Chiefs. In ’07, Kansas City had a sack rate of 7%, the 8th-highest in the NFL. In 2008, it dropped to just 2%, the lowest in modern NFL history. And in 2007, Kansas City had the second most concentrated pass rush in the NFL, largely based on Jared Allen and his 15.5 sacks.  In ’08, Allen was in Minnesota, and the Chiefs didn’t have a single player more than three sacks.  This makes perfect sense: KC’s pass rush was very good in ’07 but centered around a superstar defender; without him the next year, the pass rush fell apart.

Sounds simple, right? Except that’s just one example.  In 2000, the Titans had the 2nd best pass rush but just the 28th most concentrated: six Tennessee defenders had at least four sacks, and another six had at least two sacks, while Jevon Kearse and his 11.5 sacks made up just 21% of the team’s sacks.  This sounds like a diverse pass rush that should be more sustainable from year to year, but in ’01, the team’s sack rate basically fell in half.

Analyzing sack data is very complicated: you have to factor in regression to the mean, Game Scripts, and also the randomness involved with something that only happens once every 15 or so passing plays. That said, the table below shows the 50 teams with the most concentrated pass rushes since 1982. In other words, these were the teams that were built around just one or a handful of elite pass rushers: [continue reading…]

{ 2 comments }

Two days ago, I looked at the median age of defensive players based on interceptions. And yesterday, I looked at the median age of players based on sack totals.

Today, we will do the same thing but by position, using AV as our tool of measurement.

First, let’s start with defensive linemen. On average, from 1970 to 2016, 50% of all AV came from players 27.0 years of age or younger as of September 1st of the season in question. That number rose to as high as 27.6 in 1999, dropped to just 26.1 in 2013, and has been around 26.5 over the last three seasons.

[continue reading…]

{ 0 comments }

Median Age of Defensive Interceptions

Good instagram post by Tony Khan yesterday: Since 2001, there have been more interceptions made by defensive players aged 26 than by players of any other age.

That was true for this past season, too, where 70 of the interceptions came from players that were 26 years old in 2016. Perhaps more interesting: the median age for interceptions, by defenders, was 26 years. What do I mean by that?

Well, 2% of all interceptions in 2016 came from players 21 years of younger; 7% came from players 22 or younger, 14% from 23 years or younger, 28% from 24 or younger, 39% from age 25 or younger, and 56% from age 26 or younger. So if you sort all interceptions by the (ascending) age of the defender, you need to go up to age 26 to cross the 50% mark.

I looked at the September 1st age of every player who recorded an interception in each year from 1940 to 2015 (I haven’t updated by database for 2016 just yet). The graph below charts the median 9/1 age in each season (i.e., what is the youngest 9/1 age you need to use to make sure you capture at least 50% of all interceptions from player that age and younger): [continue reading…]

{ 2 comments }

Yes.

Take a look at the Broncos pass defense this year, compared to the Broncos pass defense last year:

Year Tm G Cmp Att Cmp% Yds TD TD% Int Int% Y/A AY/A Y/C Y/G Rate Sk Yds NY/A ANY/A
Sk% EXP
2016 DEN 14 260 483 53.8 2562 10 2.1 12 2.5 5.8 5.1 10.7 183.0 67.5 40 221 4.9 4.2 7.6 72.16
Year Tm G Cmp Att Cmp% Yds TD TD% Int Int% Y/A AY/A Y/C Y/G Rate Sk Yds NY/A ANY/A
Sk% EXP
2015 DEN 16 344 573 60.0 3193 19 3.3 14 2.4 6.2 5.7 10.3 199.6 78.8 52 351 5.1 4.7 8.3 59.89

Three years ago, I looked at the Seattle pass defense and calculate how many standard deviations above average the Seahawks were. At the time, I compared them to an average of the other 31 defenses rather than an average of all 32 defenses, including themselves. I don’t know if there’s a right or wrong answer there, but I’m going to use the latter methodology today, which will explain why the numbers are slightly different.

Anyway, Seattle was 2.80 standard deviations above average in ANY/A allowed in 2013. That’s because Seattle’s pass defense allowed 3.19 ANY/A, while the league average was 5.89 ANY/A. That’s a difference of 2.70 ANY/A, and the standard deviation among the 32 pass defenses that year was 0.97. Divide 2.70 by 0.97, and you see that Seattle was 2.80 standard deviations above average.

The 2016 Broncos? They are allowing just 4.25 ANY/A. That is over a full yard “worse” than Seattle, but worse needs to be put in quotes. For starters, the league average is 6.25 ANY/A this year; in addition, the rest of the league is bunched together. The standard deviation for the 32 pass defenses is 0.74 ANY/A. That means the Broncos have a Z-Score of 2.69 standard deviations better than average (here, negative is better).

That puts Denver as the 5th best pass defense, by this metric, since 1970: [continue reading…]

{ 11 comments }
For the 49ers, run defense is more of a suggestion

For the 49ers, run defense is an aspirational thing.

In 2013, the Bears allowed 100-yard rushers in six straight games: those players were Eddie Lacy, Reggie Bush, Ray Rice, Benny Cunningham, Adrian Peterson, and DeMarco Murray. Chicago was the 5th team since 1960 to allow such a streak.

In 2007, the Browns began the season by allowing 100-yard games to Willie Parker, Rudi Johnson, LaMont Jordan, Willis McGahee, Sammy Morris, and Ronnie Brown.

In 2006, the Rams had their own six-game stretch of allowing opposing running backs to hit the century mark: those backs were LaDainian Tomlinson, Larry Johnson, Maurice Morris, DeAngelo Williams, Frank Gore, and Edgerrin James.

In 1998, the Bengals allowed an opposing runner to hit the 100-yard mark in six straight games: Priest Holmes, Kordell Stewart, Eddie George, Napoleon Kaufman, Terrell Davis, and Fred Taylor were the stars there.

The first time, since at least 1960, that a team allowed a player to rush for at least 100 yards in six straight games came in 1979, against the Raiders.  Oakland only allowed six 100-yard rushers all season, but it happened in consecutive weeks  by Paul Hofer, Earl Campbell, the 7th best player named Mike Williams in NFL history, Rob Lytle, Chuck Muncie, and Mike Pruitt.

But now, for the first time in NFL history, the San Francisco 49ers have allowed a 100-yard rusher in seven straight games. Fozzy Whittaker went 16-100 in week 2, Christine Michael had 20-106 in week 3, Ezekiel Elliott had 23-138 the next week, David Johnson went off for 27-157 in week 5, LeSean McCoy ran roughshod 19-140-3 the following week, and Jacquizz Rodgers had 26-154 last week.

Today? Mark Ingram had 15 carries for 158 yards.  Up next week? A rematch against David Johnson and the Cards.

{ 4 comments }

The Jets defense was pretty good last year. New York allowed 29 touchdowns in 2015, tied with the Broncos for the fourth fewest in the NFL. But the Jets allowed a ton of long touchdowns: on average, those 29 touchdowns scored by opposing offenses came from 23 yards away.

That may not mean much to you in the abstract, but only three other defenses (Ravens, Vikings, Rams) saw allowed touchdowns from, on average, at least 20 yards away; by contract, the other 31 teams allowed touchdowns that gained, on average, 16.22 yards. One reason I initially thought the Jets defense fared poorly in this statistic is because of the team’s historically great run defense, and that’s partially true. The Jets allowed only four rushing touchdowns last year, and they came from 1, 1, 2, and 18 yards away.

But if you look at only passing touchdowns, the Jets defense still allowed the longest average touchdown at 26 yards (even worse than the Saints!), compared to an NFL average of 19 yards. The Jets allowed 15 touchdown passes of 20+ yards last year, tied with New York’s other team for the most in the NFL.

What was the reason for those long touchdowns? I went back and re-watched all 15 touchdowns, and tried to assign blame.  In most cases, it was pretty easy. [continue reading…]

{ 1 comment }

The Ryan Index, Part 3

On December 12, 1965, the Eagles traveled to Pittsburgh and won, 47-13. That game was not necessarily all that notable: entering the game, the Steelers were 2-10 and the Eagles were 4-8. But that day, Philadelphia produced one of the greatest defensive efforts in NFL history. The Eagles defense had three pick sixes, recorded five sacks, forced five fumbles (recovering three), and — most remarkably — had nine interceptions. If a 12-turnover, 3-touchdown day sounds really good to you, that’s because it is.

The past two days, we have looked at the Ryan Index, my measure of defensive aggressiveness/effectiveness. The best game last year came by the Cardinals defense in week 16 against the Packers. Arizona allowed just 8 points (+8), recorded an interception (+4), forced five fumbles (+15), recovered three (+3), had 9 sacks (+18), and scored two defensive touchdowns (+12). That’s a total of 60 points, the most by any defense since those same Cardinals were blanked by the Seahawks, 58-0, back in 2012. [continue reading…]

{ 4 comments }

The Ryan Index

White and Ryan helped lead a dominant Eagles pass rush

White and Ryan helped lead a dominant Eagles pass rush

The football community is in mourning this week, after the passing of Buddy Ryan. Remembered as one of the most celebrated and color defensive coaches in history, Ryan’s most famous accomplishment was guiding the ’85 Bears to a Super Bowl — on the backs of one of the greatest defenses in NFL history.  But Ryan’s defenses weren’t just known for being great: they were known for being great at attacking the opposition.  Some defenses, like the 2009 Jets, were great defenses but were not all that aggressive: those Jets ranked 1st in points, yards, first downs, and yards per attempt, but were 11th in interception rate and below-average in sack rate.

Ryan’s defenses were known for their big plays — sacks, fumbles, interceptions, and scoring plays.  So I decided to create a formula using some gut and fuzzy math to create a Ryan Index of aggressiveness. Here’s the formula: [continue reading…]

{ 22 comments }

Munir Mohamed, a reader of Football Perspective, is back for another guest post. And I thank him for it. You can read all of Munir’s posts here.


How do the Broncos stack up with the best playoff defenses?

The Broncos just capped off a run that saw the defense carry Peyton Manning and a below-average offense to a Super Bowl title. Denver held the highest scoring team in the league to just 10 points in the Super Bowl. As a result, debate ensued as to where the Broncos ranked among other great Super Bowl winning defenses. And just last week, Chase looked at the net points allowed by each Super Bowl champion. [continue reading…]

{ 30 comments }

A quick checkdown today, looking at the net points allowed in the playoffs by each of the 50 teams that won the Super Bowl. What do I mean by net points? It’s pretty simple:

(Touchdowns allowed to opposing offenses) * 7 + (Field Goals allowed) * 3 – (Touchdowns scored by the defense) * 7 – (Safeties scored by the defense) * 2

I have decided to ignore special teams touchdowns — both for and against that team — as this is just a look at defenses. And obviously this is a very basic look: it doesn’t incorporate number of drives faced, average starting field position, missed field goal attempts, or quality of opposing offense (or era). But hey, I said it was a quick checkdown!

Here’s how to read the table below. Let’s use the 1985 Bears as an example. You may know that Chicago shut out both NFC opponents en route to the Super Bowl, where the Bears allowed 10 points. But that’s a bit misleading, because Chicago’s defense was better than that. The 1985 Bears played in three playoff games, and the defense scored two touchdowns and recorded a safety (total of 16 points). The defense did allow 10 points, via a touchdown and a field goal, but that means the Bears defense allowed -6 net points in the playoffs, or -2 NP/G. [continue reading…]

{ 32 comments }

Nobody wants to watch this Saints defense with their eyes open

Nobody wants to watch this Saints defense with their eyes open

In short, maybe.

New Orleans has allowed 4,217 passing yards this year (which includes yards lost by the opposing team on sacks) on 538 dropbacks, which is already pretty bad.  That translates to a 7.84 Net Yards per Attempt allowed average, which is the worst in the NFL by half a yard per attempt.  But where things get really bad is in touchdowns and interceptions.  New Orleans has allowed an unbelievable 43 passing touchdowns through 15 games, the most in NFL history. In addition, the Saints have intercepted just 8 passes, tied for third fewest in the league this year.

That translates to an 8.77 Adjusted Net Yards per Attempt average, after giving 20 yards for each touchdown pass and subtracting 45 yards for each interception.  That is, by a decent measure, the worst rate in NFL history.  The current record belongs to the 0-16 Detroit Lions, who allowed 8.53 ANY/A.  Only three other teams — the ’81 Colts, the ’69 Saints, and the ’63 Broncos — have even allowed 8.00 ANY/A over a full season. [continue reading…]

{ 4 comments }

2014 Defensive Adjusted Yards per Carry Data

A couple of weeks ago, I looked at the Adjusted Yards per Carry data for 2014 offenses; today, the same information but for the other side of the ball. As a reminder, here’s the formula for calculating Adjusted Yards per Carry:

Adjusted Rushing Yards per Carry = (Rush Yards + 11 * Rush TDs + 9 * Rush First Downs – Kneel Yards Lost ) / (Rushes – Kneels)

Let’s use the Detroit Lions defense as an example. The Lions faced 350 rush attempts last year and allowed 1,109 rushing yards and eight touchdowns. However, seven of those rushing attempts were actually kneels by the opponent (for -7 “rushing yards”), so we need to back those out of the data. The Lions also allowed 59 rushing first downs, or a first down on 17.2% of all carries. As a result, Detroit allowed 5.06 Adjusted Rushing Yards per Carry last year, the best rate in the NFL. The league average last year was 6.63, which means the Lions were over a yard and a half above average per carry. Multiply that difference by the 343 non-kneel runs that Detroit faced, and the Lions rush defense was 541 Adjusted Rushing Yards above average (here, negative is better), the top value-producing rush defense in the NFL in 2014. [continue reading…]

{ 1 comment }

Yesterday, I looked at the best defenses in football history in terms of (estimated) points allowed on an (estimated) per drive basis. Today, the reverse: the worst defenses in history, at least, without adjusting for era, in terms of points allowed per drive.

The 1981 Colts take the top spot, and that’s not going to be a surprise to any fan of NFL history. Those Colts teams were terrible, particularly on defense. In ’81, Baltimore beat New England 29-28 in week 1, beat New England 23-21 in the last game of the season, and lost every game in between. In ’82, Baltimore finished 0-8-1. In fact, beginning in December 1980, over the team’s next 31 games, the Colts went 3-1 against the Patriots and 0-26-1 against the rest of the NFL! And beginning in ’81, the Colts went 24 straight games without being favored.

The ’81 Colts finished last in just about every defensive category, including points, yards, turnovers, first downs, passing touchdowns, rushing touchdowns, and net yards per attempt. Baltimore’s defense ranked in the bottom three in both rushing yards and passing yards, too. Baltimore allowed 533 points, which remains the most in a single season in NFL history, undisturbed by the modern era. [continue reading…]

{ 2 comments }

Which Defenses Are The Best At Recording Sacks?

In 2014, there were 17,879 pass attempts in the NFL, and another 1,212 dropbacks that ended up as quarterback sacks. Therefore, the 2014 NFL sack rate was 6.35%, as quarterbacks were sacked 1,212 times on 19,091 dropbacks.

The Buffalo Bills defense was fantastic in general last year, and even moreso with regards to sacks. Buffalo faced 613 opponent dropbacks last season; given the league average, we would “expect” the Bills to have recorded 38.9 sacks. [1]This is simply the product of 613 and 6.35%. In reality, Buffalo sacked opposing quarterbacks 54 times, or 15.1 more than “expected” last season. Only one other team, the Giants at +10.9, reached double digits in sacks over expectation.

The worst team, by a good measure, was Cincinnati. The Bengals faced 628 opponent dropbacks but recorded only 20 sacks! Using the league average as our guide, we would have expected Cincinnati to take down opposing passers about 39.9 times, which means the Bengals fell 19.9 sacks shy of expectation. Only Atlanta at -15.3 and Oakland at -13.6 were within shouting distance of the Bengals when it came to anemic pass rushing. [continue reading…]

References

References
1 This is simply the product of 613 and 6.35%.
{ 13 comments }

Quite the clickbait title, I know. But given where this post is going, I thought precision was more important than anything else.

Over the last three seasons, Seattle has allowed 15.2 points per game. That’s really, really good. How good?

pa2012

There are flaws with using points allowed as a measure of defensive play, of course. Seattle is known for its long drives on offense, which limits the number of possessions an opponent might have. And the Seahawks offense generally puts the team’s defense in pretty good situations. Using points allowed per drive might be preferable, or using DVOA, or EPA per drive, or a host of other metrics. And adjusting these results for strength of schedule (or, at least, removing non-offensive scores) would make sense, too.

But hey, it’s Friday, and I wanted to keep things relatively simple. [1]In about ten minutes, we can all have a good laugh at this line. Points allowed is a number we can all understand. Given our era of inflating offenses, it’s quite possible that Seattle’s 15.2 points per game average doesn’t stand out as particularly impressive to you. After all, the ’76 Steelers once allowed 28 points over a nine-game stretch! But consider that since 2012, the NFL average has been 22.6 points per game, which means the Seahawks have allowed 7.4 fewer points per game than the average defense.

How good is that? [continue reading…]

References

References
1 In about ten minutes, we can all have a good laugh at this line.
{ 11 comments }
Previous Posts