≡ Menu

On Friday, I examined the trades from Round 1 of the 2013 NFL Draft; yesterday, I looked at the trades from rounds two and three. Let’s take a look at what happened on Saturday:

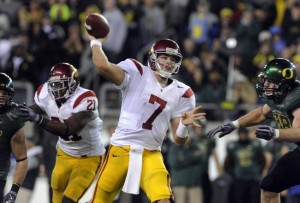
Chip Kelly saw enough out of Barkley to trade for him.

Chip Kelly saw enough out of Barkley to trade for him.

1) Jacksonville traded #98 to Philadelphia for the 101st and 210th picks

With Kansas City reportedly interested in drafting USC quarterback Matt Barkley, Philadelphia jumped the Chiefs to give Chip Kelly another quarterback.  The Jaguars then selected Ace Sanders, the South Carolina slot receiver that they presumably wanted at 98, anyway.  If nothing else, he can do this.

Jacksonville team received 107 cents on the dollar according to the Football Perspective chart and 96 cents on the dollar according to the Jimmy Johnson chart.

Winner: Win-Win.  Kelly now has Michael Vick, Nick Foles, and Matt Barkley: we’ll see who emerges from that competition.  Meanwhile, I really like the idea of having Justin Blackmon and Cecil Shorts on the outside and Sanders in the slot.  If Maurice Jones-Drew is healthy, Blaine Gabbert will be out of excuses in 2013. Jacksonville also added Denard Robinson — who looks to be playing running back in the NFL — later in the draft, giving them one of the more interesting drafts of the weekend.

Chart Used: Combination of the two charts. As you’ll soon see, teams didn’t strictly adhere to the Jimmy Johnson chart often in the later rounds.
[continue reading…]

{ 3 comments }

Yesterday, I examined the trades from Round 1 of the 2013 NFL Draft. Let’s take a look at what happened on Friday:

1) San Francisco traded #34 to Tennessee for the 40th and 216th picks plus a 2014 3rd rounder

The Titans traded up to draft Justin Hunter, the wide receiver from the University of Tennessee. It’s always difficult to value future draft picks, as every team has their own discount rate. So in addition having to figure out the value to be able to pick right now, we also don’t know whether that future pick will be in the beginning, middle, or end of the round. In this particular instance, it doesn’t matter, as the 49ers made out like bandits. For purposes of the calculator, I made the 2014 3rd rounder equal to the 97th pick in this draft. In that case…

The 49ers received 140 cents on the dollar according to the Football Perspective chart and 110 cents on the dollar according to the Jimmy Johnson chart.

On the bright side, with Hunter, Kenny Britt, and now Kendall Wright in the slot, Jake Locker has a lot of weapons this year. Throw in the additions of Andy Levitre and Chance Warmack, and the Titans have done everything they can to make the offense a strength in 2013. Still, it’s hard not to love what the 49ers did.

Winner: San Francisco, significantly. Not only did they get fantastic value, they then selected Tank Carradine, a top-20 talent at defensive end, with the 40th pick. Unreal. A day after the Vikings overpaid to draft one Volunteer receiver, the Titans do the same for the other.

Chart Used: The Jimmy Johnson chart with a dash of coach/GM on the hot seat

[continue reading…]

{ 5 comments }

Analyzing the Trades in Day 1 of the 2013 Draft

There were five trades in the first round of the NFL Draft.  Who were the winners and losers?  Which draft chart was used — the traditional Jimmy Johnson chart or something closer to my chart?  I’ve never argued that teams use my chart when making trades (rather, I’ve argued simply that they should), but it’s worthwhile to see the trade market has shifted under the new CBA.

1) Oakland traded the #3 pick for Miami’s #12 and #42 picks

At the time, most thought the Dolphins were trading to select the last of the three left tackles, Oklahoma’s Lane Johnson.  Instead, Miami drafted Dion Jordan, the DE/OLB out of Oregon.  Jordan will team with Cameron Wake to give Miami an incredible set of pass rushers, although the left tackle situation remains unresolved.

My draft pick value calculator says the Raiders received 107% of the value they gave up, making it slightly in their favor.  On the other hand, the Jimmy Johnson chart says the Raiders only received 76% of the value of the third pick back.

Winner: Oakland.  The Raiders were able to select the player they really wanted (D.J. Hayden), so they essentially received the #42 pick for free.  Meanwhile, the Dolphins gave up a high second round pick, a risky move in a draft that is flat on talent.  Miami fans will be happy with Jordan now, and the team could still send their other second round pick to Kansas City for Branden Albert, but strictly on trade value, the Raiders won this one.
[continue reading…]

{ 19 comments }

A recap of every #1 pick in NFL and AFL Draft History, along with their conference affiliations:

YearDraftPlayerTeamPosSchoolConf (Then)Conf (Now)
2013NFLEric FisherKANTCentral MichiganMACMAC
2012NFLAndrew LuckINDQBStanfordPac-12Pac-12
2011NFLCam NewtonCARQBAuburnSECSEC
2010NFLSam BradfordSTLQBOklahomaBig 12Big 12
2009NFLMatthew StaffordDETQBGeorgiaSECSEC
2008NFLJake LongMIATMichiganBig TenBig Ten
2007NFLJaMarcus RussellOAKQBLSUSECSEC
2006NFLMario WilliamsHOUDENorth Carolina St.ACCACC
2005NFLAlex SmithSFOQBUtahMWCPac-12
2004NFLEli ManningSDGQBMississippiSECSEC
2003NFLCarson PalmerCINQBUSCPac-10Pac-12
2002NFLDavid CarrHOUQBFresno St.WACWAC
2001NFLMichael VickATLQBVirginia TechBig EastACC
2000NFLCourtney BrownCLEDEPenn St.Big TenBig Ten
1999NFLTim CouchCLEQBKentuckySECSEC
1998NFLPeyton ManningINDQBTennesseeSECSEC
1997NFLOrlando PaceSTLTOhio St.Big TenBig Ten
1996NFLKeyshawn JohnsonNYJWRUSCPac-10Pac-12
1995NFLKi-Jana CarterCINRBPenn St.Big TenBig Ten
1994NFLDan WilkinsonCINDTOhio St.Big TenBig Ten
1993NFLDrew BledsoeNWEQBWashington St.Pac-10Pac-12
1992NFLSteve EmtmanINDDEWashingtonPac-10Pac-12
1991NFLRussell MarylandDALDTMiami (FL)IndependentACC
1990NFLJeff GeorgeINDQBIllinoisBig TenBig Ten
1989NFLTroy AikmanDALQBUCLAPac-10Pac-12
1988NFLAundray BruceATLLBAuburnSECSEC
1987NFLVinny TestaverdeTAMQBMiami (FL)IndependentACC
1986NFLBo JacksonTAMRBAuburnSECSEC
1985NFLBruce SmithBUFDEVirginia TechIndependentACC
1984NFLIrving FryarNWEWRNebraskaBig 8Big Ten
1983NFLJohn ElwayBALQBStanfordPac-10Pac-12
1982NFLKenneth SimsNWEDETexasSWCBig 12
1981NFLGeorge RogersNORRBSouth CarolinaIndependentSEC
1980NFLBilly SimsDETRBOklahomaBig 8Big 12
1979NFLTom CousineauBUFLBOhio St.Big TenBig Ten
1978NFLEarl CampbellHOURBTexasSWCBig 12
1977NFLRicky BellTAMRBUSCPac-8Pac-12
1976NFLLee Roy SelmonTAMDEOklahomaBig 8Big 12
1975NFLSteve BartkowskiATLQBCaliforniaPac-8Pac-12
1974NFLToo Tall JonesDALDETennessee St.----
1973NFLJohn MatuszakHOUDETampaIndependent--
1972NFLWalt PatulskiBUFDENotre DameIndependentIndependent
1971NFLJim PlunkettNWEQBStanfordPac-8Pac-12
1970NFLTerry BradshawPITQBLouisiana Tech--WAC
1969NFLO.J. SimpsonBUFRBUSCPac-8Pac-12
1968NFLRon YaryMINTUSCAAWUPac-12
1967NFLBubba SmithBALDEMichigan St.Big TenBig Ten
1966NFLTommy NobisATLLBTexasSWCBig 12
1966AFLJim GrabowskiMIARBIllinoisBig TenBig Ten
1965NFLTucker FredericksonNYGRBAuburnSECSEC
1965AFLJoe NamathNYJQBAlabamaSECSEC
1964AFLJack ConcannonBOSQBBoston Col.IndependentACC
1964NFLDave ParksSFOWRTexas TechSWCBig 12
1963AFLBuck BuchananKANDTGrambling St.----
1963NFLTerry BakerRAMQBOregon St.IndependentPac-12
1962AFLRoman GabrielOAKQBNorth Carolina St.ACCACC
1962NFLErnie DavisWASRBSyracuseIndependentBig East
1961NFLTommy MasonMINRBTulaneSECCUSA
1961AFLBob GaitersDENRBNew Mexico St.BorderWAC
1960NFLBilly CannonRAMTELSUSECSEC
1959NFLRandy DuncanGNBQBIowaBig TenBig Ten
1958NFLKing HillCRDQBRiceSWCCUSA
1957NFLPaul HornungGNBRBNotre DameIndependentIndependent
1956NFLGary GlickPITDBColorado St.SkylineMWC
1955NFLGeorge ShawBALQBOregonPCCPac-12
1954NFLBobby GarrettCLEQBStanfordPCCPac-12
1953NFLHarry BabcockSFOWRGeorgiaSECSEC
1952NFLBilly WadeRAMQBVanderbiltSECSEC
1951NFLKyle RoteNYGWRSMUSWCCUSA
1950NFLLeon HartDETWRNotre DameIndependentIndependent
1949NFLChuck BednarikPHILBPennsylvaniaIndependent--
1948NFLHarry GilmerWASQBAlabamaSECSEC
1947NFLBob FenimoreCHIRBOklahoma St.MVCBig 12
1946NFLBoley DancewiczBOSQBNotre DameIndependentIndependent
1945NFLCharlie TrippiCRDRBGeorgiaSECSEC
1944NFLAngelo BertelliBOSQBNotre DameIndependentIndependent
1943NFLFrankie SinkwichDETRBGeorgiaSECSEC
1942NFLBill DudleyPITRBVirginiaIndependentACC
1941NFLTom HarmonCHIRBMichiganWesternBig Ten
1940NFLGeorge CafegoCRDFBTennesseeSECSEC
1939NFLKi AldrichCRDCTCUSWCBig 12
1938NFLCorby DavisRAMRBIndianaWesternBig Ten
1937NFLSam FrancisPHIFBNebraskaBig 6Big Ten
1936NFLJay BerwangerPHIRBChicagoWestern--
{ 0 comments }

Football Perspective Mock Draft

Before we get to my mock draft, here’s a recap of some of my previous articles on the NFL draft:

Draft Pick Value Calculators – Don’t Watch the Draft Without Them

I’ve created Draft Pick Value Calculators based on both my Draft Value Chart and the Jimmy Johnson Draft Value Chart.  As trades unfold tonight, you can use both calculators to see who won the trade.  I’ll be providing draft commentary on twitter, and you can follow me @fbgchase.

The 2013 Football Perspective Mock Draft

1. Chiefs – LT Eric Fisher, Central Michigan
Eric Fisher has more upside than Luke Joeckel and is a more physical player, which is why we’re now seeing more people mock Fisher to the Chiefs. The Chiefs aren’t in need of a left tackle, but Fisher is the top prospect in the draft at an elite position. Kansas City will try to trade the pick (and/or Branden Albert), but will ultimately end up selecting Fisher.

2. Dolphins (From Jaguars in Draft Night Trade) – LT Luke Joeckel, Texas A&M
Miami didn’t go all-in on Ryan Tannehill and Mike Wallace to leave a hole at left tackle. Jeff Ireland is on the hot seat, and is happy to send his 2014 1st rounder to Jacksonville for a premier left tackle, especially one who has played with Tannehill and under OC Mike Sherman. New GM Dave Caldwell wants more for the #2 pick, but knows having an additional first rounder in 2014 could help in finding a franchise quarterback.

3. Raiders – DT Sharrif Floyd, Florida
Oakland wants to trade down, but can’t find a willing suitor. The Raiders are desperate for bodies on the defensive line, and Floyd is a penetrating one-gap tackle who will instantly make the Raiders defense better.

4. Eagles – DE Dion Jordan, Oregon
Chip Kelly can’t resist taking the most exciting defensive prospect in the draft. Jordan is capable of playing in both the 3-4 and 4-3, making him a good fit for Kelly’s hybrid defense. An elite pass rusher who can help his new Eagles teammates get used to life under Kelly is a dream scenario Philadelphia fans, who will still boo the pick.

5. Chargers (From Lions in Draft Night Trade) – LT Lane Johnson, Oklahoma
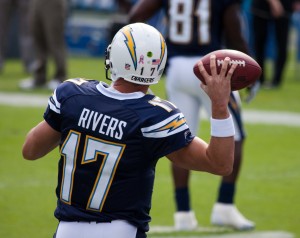
Mike McCoy needs to resurrect Philip Rivers’ career, and the addition of King Dunlap (Philadelphia) and now Johnson will help shore up the edges of the San Diego line. Johnson is already one of the most athletic tackles in NFL history with off-the-chart measurables, making him the type of player a team is willing to move up to take. The Lions are willing to take any of the top corners, so Detroit accepts San Diego’s offer of the 11th, 76th, and 111th picks for the 5th pick.

[continue reading…]

{ 10 comments }

We already know what the average draft pick is worth, thanks to the Football Perspective Draft Value Chart. If we assign the draft value associated with each pick to the college of that player, then we can determine which school had the most draft value in any given year. As it turns out, the best single draft since 1967 came courtesy of USC in 1968. Look at this pretty incredible draft for the Trojans, with five players in the top 24:

Pk   Team  Player               Pos  School
1    MIN   Ron  Yary             T    USC
10   PIT   Mike  Taylor          T    USC
14   PHI   Tim  Rossovich        LB   USC
16   CHI   Mike  Hull            RB   USC
24   DET   Earl  McCullouch      WR   USC
68   PHI   Adrian  Young         LB   USC
94   WAS   Dennis  Crane         DT   USC
101  NYJ   Gary Magner          DT   USC
298  OAK   Chip  Oliver          LB   USC
438  DEN   Steve Grady          RB   USC
439  NOR   James  Ferguson       C    USC

In modern times, the best draft class (in terms of draft pick value) by a single school came in 2004, when the Miami Hurricanes sent this impressive haul to the NFL:

Rk   Team  Player               Pos  School
5    WAS   Sean  Taylor	        DB   Miami (FL)
6    CLE   Kellen  Winslow  Jr.	TE   Miami (FL)
12   NYJ   Jonathan  Vilma	LB   Miami (FL)
17   DEN   D.J.  Williams	LB   Miami (FL)
19   MIA   Vernon  Carey        T    Miami (FL)
21   NWE   Vince  Wilfork	NT   Miami (FL)
213  NYJ   Darrell  McClover	LB   Miami (FL)
215  CHI   Alfonso  Marshall	DB   Miami (FL)
254  SDG   Carlos  Joseph	T    Miami (FL)

[continue reading…]

{ 2 comments }

Are some positions safer than others in the draft? Conventional wisdom tells us that quarterbacks are risky, while offensive linemen are safe. But is that true? Jason Lisk wrote a great article on bust rates three years ago at the old PFR Blog, and I’ve decided to update that article based on more recent data.

I looked at the first rounds of all drafts from 1990 to 2009. Over that time period, 46 quarterbacks were selected in the first round, and those quarterbacks were selected, on average, with the 9th or 10th pick. The table below breaks down each position, the number of players selected in the twenty-year period, and their average draft slot:

PosCountAvg Pk
QB469.6
DE7414.1
OLB5114.6
T7014.9
DT5615
WR7315.9
RB6415.9
ILB1917.7
S2917.9
CB7418
TE2420.5
G1620.8
C922.4

[continue reading…]

{ 9 comments }

Are certain teams better at drafting than others?

A.J. Smith knows a perfect throwing motion when he sees one.

A.J. Smith knows a perfect throwing motion when he sees one.

On the surface, this seems like an obvious question. Yes, certain teams are good at drafting and certain teams are bad at drafting. It’s easy to think of the Matt Millen Lions or the Raiders at the end of the Al Davis era as terrible drafting teams. With the benefit of hindsight, they were terrible at making draft selections. But is it easy to identify going forward which teams will be good or bad in the draft?

Think back to April 2007. A.J. Smith and Bill Polian were widely considered the two best draft minds in the NFL. At the time, Smith’s last three draft classes had been outstanding. He added Philip Rivers (via the Eli Manning trade), Igor Olshansky, Nick Hardwick, Shaun Phillips, Michael Turner, and Nate Kaeding in 2004, and followed that up with Shawne Merriman, Luis Castillo, Vincent Jackson, and Darren Sproles in 2005 and another strong class (Antonio Cromartie, Marcus McNeill, and Jeromey Clary) in 2006.

The defending Super Bowl champions were the Indianapolis Colts, a team that Polian had built from scratch. From 1996 to 2003, Polian’s eight first round picks were spent on Marvin Harrison, Tarik Glenn, Peyton Manning, Edgerrin James, Rob Morris, Reggie Wayne, Dwight Freeney, and Dallas Clark. His most recent first round pick was Joseph Addai, who had 1400 yards from scrimmage as a rookie and 143 yards in the Super Bowl victory over Chicago.

[continue reading…]

{ 38 comments }

[In case you missed it, earlier this week, I created an NFL Draft Pick Value Calculator and provided wallet-sized and iPhone-style copies of the 2013 NFL Schedule.]

I find old newspaper articles very entertaining, so I decided to see how the Boston Globe documented the selection of Tom Brady in the sixth round of the 2000 Draft.

On April 17th, the day after the draft concluded, the Globe provided a full summary of each player. Here’s how they described the 199th pick:

6, 199 – Tom Brady, QB, Michigan

A pocket passer who will compete for a practice squad spot with the Patriots . . . Drafted as a catcher by the Montreal Expos in 1995 out of Serra (San Mateo, Calif.) HS . . . Completed 62.8 percent of his passes with 20 TDs and six interceptions. Only Elvis Grbac had more TD tosses in a season for the Wolverines . . . Throws a great slant . . . At almost 6-4, 214 pounds, has some mobility . . . Platooned with sophomore Drew Henson . . . Was projected to go in the third round, but dropped quickly.

[continue reading…]

{ 1 comment }

I’ve received a couple of questions asking about what the discount rate should be when trading future draft picks. For example, two years ago, Atlanta traded the 27th, 59th, and 124th picks in the 2011 draft, along with their first and fourth round picks in the 2012 draft, to the Browns to acquire the 6th pick and select Julio Jones. In making that trade, the Falcons were implying that the future picks were worth less than current selections. Can we quantify exactly what discount rate they used?

The Falcons went 13-3 in 2010, so they probably expected that they’d be picking pretty late in the first round of the 2012 draft, especially after adding Jones. No doubt part of the reason we see teams trading future picks is because teams expect those to be late future picks. Atlanta went 10-6 in 2011 (and lost their first playoff game), earning the 22nd pick in the 2012 draft. But let’s give Atlanta the biggest benefit of the doubt possible and say that we should assume that they were going to win the Super Bowl.

If you place picks 27, 59, and 124 into the Draft Pick Value Calculator, you see that they are worth 26.1 points. Unfortunately for Atlanta, that haul alone — without adding the future picks — is worth more than the value of the 6 pick (23.3 points). The Football Perspective chart is based on actual NFL production of drafted players, but I don’t argue that teams use my chart: just that they should. In reality, we know what chart they do use (at least as a starting point).
[continue reading…]

{ 14 comments }

Will Geno Smith fall in the draft?

Would you risk your job on this man?

Would you risk your job on this man?

I have no inside information and I’m not a draftnik, but that won’t stop me from trying to read the tea leaves. I’m of the opinion that Geno Smith will fall to the late first round of the draft next week. I’m not a huge Smith fan — a passer-friendly system boosted his admittedly impressive numbers — but I wouldn’t label myself a Smith hater, either. So why do I think he’ll slide? Part of the reason is that Smith simply isn’t a slam dunk pick, much to the chagrin of several teams in the top five. Another factor is that following the delusional quarterback carousel last month, no team has a pressing need for a quarterback to start in week 1, a stark contrast to where the Redskins and Colts were this time last year. Finally, while Smith may be the top quarterback prospect on most boards, I’m sure some teams think selecting Matt Barkley, E.J. Manuel, Ryan Nassib, Tyler Wilson, Mike Glennon, Tyler Bray, or Landry Jones in rounds two, three, or four, is preferable to spending a high first round pick on Smith. If those picks miss, the cost is lower, and team won’t feel the immediate need to thrust them into the lineup like they would with Smith.

Looking at the teams drafting in the top ten, and I don’t see any landing spot that is particularly likely for Smith. Consider:
[continue reading…]

{ 7 comments }

Introducing the NFL Draft Pick Value Calculator

I first created a draft value chart five years ago. While the famous Jimmy Johnson chart was designed to facilitate trades, my chart was designed to measure the actual expected value from each draft pick. I fine-tuned my chart last November, and the graph below shows how much marginal Approximate Value you can expect from each draft pick over the course of the first five years of his career:

draft value chart 2

You can see all the values for each draft pick here, but today, I’m introducing the Draft Pick Value Calculator. It’s pretty simple to use: just type in the draft picks that Team A is trading and the draft picks that Team B is trading, and the calculator will let you know which team is winning the deal.
[continue reading…]

{ 62 comments }

A poor man's Matt Stafford?

Tyler Bray is this year's youngest quarterback prospect.

For the most part, age is rarely discussed when talking about college quarterbacks. Outside of the Brandon Weedens and Chris Weinkes of the world, you generally don’t hear much from the draft community about the age of a prospect. But we do know that age matters, and that all other things being equal, being younger is better (or a sign that the player has a higher ceiling).

In this year’s draft, Tyler Bray is the neophyte, as he’ll be 21 years and 8 months old at the start of the season. He’s just weeks older than Matt Stafford and Josh Freeman were this time four years ago. It also means he’s 10 months younger than Geno Smith, the second youngest of the top prospects. On the other hand, Tyler Wilson will be 24 when the season starters, Landry Jones just turned 24, and Jordan “did you know Aaron is my brother” Rodgers will be 25 on August 30th. Do NFL teams generally ignore age — i.e., fail to measure younger quarterbacks against a lower bar? Or perhaps do they overemphasize age, thinking a young player has such high upside and can be taught anything that they ignore red flags? That’s what this post seeks to answer.
[continue reading…]

{ 7 comments }

Yet another draft value chart

Last November, I provided an updated version of my own draft value chart where I measured the value provided by each draft pick to his Approximate Value over the course of his first five years. A week later I decided another change was needed. While AV measures the value provided by a player, the marginal value provided by a player is a better measure of the value of a draft pick. As a result, I re-did the chart and only gave players credit for their AV above 2 points of AV.

You can view the values for both of those charts and the Jimmy Johnson chart here. This week, I spoke with Peter Keating of ESPN the Magazine, who is working on an article regarding how teams should value draft picks. Keating asked if I could make two changes to the chart, and I was happy to do so (and thought you guys might be interested). First, I increased the measure of replacement-level AV from 2 to 3 points. Theoretically, this change would reward the best players, as the higher the value used for replacement level, the fewer players that will meet that threshold. The other change was to reduce the number of years measured from five to four, since that matches the length of the typical rookie contract under the new CBA. The chart below shows the raw data and a smoothed curve depicting the marginal AV (over 3) produced by draft picks in the first four years of their career over a 28-year period.
[continue reading…]

{ 8 comments }

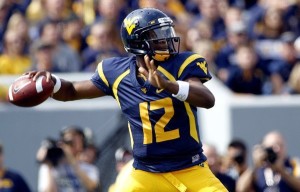
Quarterbacks wearing #12 have won 14 Super Bowls

Quarterbacks wearing #12 have won 14 Super Bowls.

What does it mean that Geno Smith comes from a long line of Mike Leach/Dana Holgorsen star quarterbacks? I don’t know. At a minimum, it means he’s part of a very interesting and distinguished set of college quarterbacks. Because few players have dominated college football over the last 15 years like quarterbacks under Mike Leach and Dana Holgorsen.

Leach is one of the most fascinating characters in recent college football history, and he’s been one of the most influential coaches in the modern passing game. That’s what tends to happen when your quarterbacks produce video game numbers practically every season. Leach was the offensive coordinator under Hal Mumme at Kentucky in 1997 and 1998, which is when the Air Raid offense arrived on the national radar. At the time, there hadn’t been any Wildcats drafted in the first round since running back George Adams in 1985. Twenty-six months after Leach and Mumme arrived in Lexington, Tim Couch was the first pick in the NFL draft.

Leach then spent a year as the offensive coordinator for the Oklahoma Sooners with Josh Heupel at quarterback. Heupel led the conference with 3,460 passing yards and 30 touchdowns, and also sported the highest completion percentage (62.0%) in the conference. Those were big numbers in a conference where only four players threw for even 1900 yards, and was enough to land Leach the head coaching job at Texas Tech after only a season in Norman. When Leach moved to Lubbock, Texas in 2000, the quarterback cupboard appeared bare. He took unheralded sophomore quarterback Kliff Kingsbury and shaped him into the player that led the NCAA in pass attempts in 2000, 2001, and 2002. Klingsbury led the Big 12 in passing yards in both 2000 and 2001, and then as a senior, became just the third player in college football history to pass for 5,000 yards in a season (after Ty Detmer and David Klingler). Klingsbury went on to have an unremarkable career in the NFL before excelling as an assistant coach with the Houston Cougars. He followed then-head coach Mike Sumlin to Texas A&M after the 2011 season, and after turning Johnny Manziel into a Heisman Trophy winner, Kingsbury is now the new head coach at his alma mater.
[continue reading…]

{ 4 comments }

The best drafting teams from 2000 to 2007

In this post I derived the expected value of the contribution of each draft slot based on Pro-Football-Reference.com’s Approximate Value system. You can see the full draft chart here. Once you know what the expected value is for a draft pick, the next step to grading a draft pick is to measure how much actual value was provided. As before, I used the marginal Approximate Value generated by each player in each of his first five years, with the caveat that a player is only credited for his AV after his first two points of AV. Using that formula, Patrick Willis, LaDainian Tomlinson, and Maurice Jones-Drew come in as the three most valuable picks over that time period.

Since 2000, the team with the most amount of draft value in terms of picks was the 2002 Texans. Houston not only received the first pick in each round that year, but the expansion Texans were given several supplemental draft picks as well. The 2007 Raiders and 2000 Browns tied for the second mount amount of value in terms of raw draft picks, but both of those teams wound up with many more whiffs than hits.

The table below lists the best drafting teams from 2000 to 2007. I’ve also broken out each team’s AV above expectation for each year. If you click on any of the values in the columns from 2000 to 2007, you can see the players drafted by the team that year (one side effect of including this information: the columns do not sort correctly).

[continue reading…]

{ 34 comments }

The Time Value of Draft Picks

How do you compare the value of a draft pick this year compared to a draft pick next year? NFL teams have often used a “one round a year” formula, meaning a team would trade a 2nd, 3rd, or 4th round pick this year for a 1st, 2nd, or 3rd rounder next year. But to my knowledge, such analysis hasn’t evolved into anything more sophisticated than that.

So I decided to come up with a way to measure the time value of draft picks. First, I calculated how much Approximate Value each draft pick provided from 1970 to 2007 during their rookie season. Then, to calculate each player’s marginal AV, I only awarded each player credit for his AV over two points in each year. As it turns out, the player selected first will provide, on average, about 4 points of marginal AV during his rookie year. During his second season, his marginal value shoots up to about 5.5 points of AV, and he provides close to 6 points of marginal AV during his third and fourth seasons. In year five, the decline phase begins, and the first pick provides about 4.7 points of AV. You can read some more fine print here. [1]The charts in this post are “smoothed” charts using polynomial trend lines of the actual data. I have only given draft picks credit for the AV they produced for the teams that drafted … Continue reading

Here’s another way to think of it. The 1st pick provides 4.0 points of marginal AV as a rookie, the same amount the 15th pick provides during his second year, the 17th pick produces during his third year, the 16th pick during his fourth year, and the 8th pick during his fifth year. So the 15th pick this year should provide, on average, about the same value next year as the 1st pick in the 2014 draft (of course, that player might have something to say about that, too).

The graph below shows the marginal AV (on the Y-axis) provided by each draft selection (on the X-axis) in each of their first five years. The graphs get increasingly lighter in color, from black (as rookies) to purple, red, pink, and gray (in year five):
[continue reading…]

References

References
1 The charts in this post are “smoothed” charts using polynomial trend lines of the actual data. I have only given draft picks credit for the AV they produced for the teams that drafted them – that’s why the values are flatter (i.e., top picks are less valuable) than they were in this post. Finally, astute readers will note that the draft looks linear in the second half; that’s because if I kept a polynomial trend line all the way through pick 224, some later picks would have more value than some early picks
{ 5 comments }

[Special thanks goes out to my Footballguys.com co-writer Maurile Tremblay for his help in co-authoring this piece with me. Any points with which you may disagree are almost certainly due to my error, and not Maurile’s.]

The new NFL collective bargaining agreement that ended the 2011 lockout instituted some pretty big changes to the salary cap. When it comes to roster management, here are three ways the post-2011 NFL differs from how things were under the old CBA:

  • Rookies are now super cheap relative to their production, especially high first-round players (relative to their old cost)
  • Rookie contracts can not be renegotiated until three years after the player is drafted.
  • Over a four-year period, each team must spend 89% of the cap dollars available to them, and the league must spend 99% of the cap dollars available to the 32 teams.

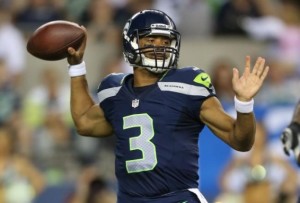
Under the old system, contrary to popular belief, most (if not all) rookies were underpaid relative to their free market value. Then in 2011, the owners and NFLPA decided to rob the rookies to pay veterans even more money under the new CBA. Russell Wilson has three years remaining on his contract and will have an average cap figure of just $817,000 over those three years. Andrew Luck and Robert Griffin III will only cost their teams about 6 million cap dollars each per year from 2013 to 2015. The salary cap in the NFL in 2013 is $123M, making Luck and Griffin fantastic values, and Wilson perhaps the most valuable player in the league.

Wilson's paid in direct proportion to his height

Wilson's paid in direct proportion to his height.

What makes this especially juicy from the perspective of their general managers is that all three players are locked into their deals until 2015. Luck and Griffin actually are struck through 2016, as teams get club-options for a fifth year for the top picks. In Wilson’s case, after the 2014 season, he’ll be facing a contract that would pay him less than a million dollars in 2015 and then a possible franchise tag in 2016, meaning a maximum payout of probably 20 million dollars over two years (the tag in 2012 for quarterbacks was just under $15 million). That puts Wilson in a pretty poor position to bargain for a market deal: he’s going to sacrifice money in exchange for security. This means Seattle will get him for absurdly below-market rates in 2012, 2013, and 2014, and then will still have him on a very generous contract for the next few years after that.

In the case of Luck or Griffin, the Colts and Redskins essentially get a chance to use the tag twice; teams can turn the four-year rookie deals into a five-year deal by paying top-ten picks the average salary of the ten highest-paid players at their position; then the next year the franchise tag would be the average of the top five quarterbacks or a 20% increase on the salary from the previous year. So when they are up for renegotiation after year three, they’re looking at the team “forcing” them to stay for three years at roughly $42 million, with year one bringing just over three million. Luck and Griffin will have a little more bargaining power than Wilson, but not much. There’s no chance either player is going to play for $3 million in 2015 (remember, their cap hit will be a bit higher, but their base salaries will be around $3M in that season), so both will likely give up their freedom (which would be three years away, potentially) for security.
[continue reading…]

{ 26 comments }

Update: Miss on a first round QB, get fired

Tim Tebow prays for not Josh McDaniels' job security.

Tim Tebow prays for not Josh McDaniels' job security.

In October, I examined the data supporting the intuitive notion that when an organization misses on a first round quarterback, the axe must fall on someone. From 1998 to 2010, there were 35 quarterbacks selected in the first round of the draft. I labeled 14 [1]Ryan Leaf, Akili Smith, Cade McNown, Tim Couch, Joey Harrington, Patrick Ramsey, David Carr, Kyle Boller, Rex Grossman, J.P. Losman, Matt Leinart, Brady Quinn, JaMarcus Russell, and Tim Tebow. as clear busts, and in 10 of those situations, the head coach and offensive coordinator were both gone within two years. The outcome wasn’t much rosier in the other four instances. In Chicago and Baltimore, a Coach of the Year award and Super Bowl title helped insulate Dick Jauron and Brian Billick, but their offensive coordinators were fired within two years of their teams drafting Cade McNown and Kyle Boller, respectively. In Denver, head coach Josh McDaniels lasted only one year after drafting Tim Tebow, although his offensive coordinator has managed to rebound nicely. Only in expansion Houston was the axe delayed, although OC Chris Palmer was fired after year 3 and HC Dom Capers after year 4 following the David Carr pick.

With 2012 in the books, I wanted to provide a quick update. While Cam Newton is not a bust and the jury is still out on Christian Ponder (although some are calling for OC Bill Musgrave to be fired), it’s worth noting the situation of the other two first round quarterbacks. In Tennessee, OC Chris Palmer was fired in part for yet again failing to develop a rookie quarterback, this time with Jake Locker as the prized pupil. And in Jacksonville, a year after HC Jack Del Rio and OC Dirk Koetter were shown the door for largely non-Gabbert-based reasons, the GM who selected Blaine Gabbert — Gene Smith — has been fired, along with the 2012 HC (Mike Mularkey).
[continue reading…]

{ 9 comments }

Yesterday, I ranked every quarterback in college football last season. Today, I’ll do the same for every quarterback since 2005. If you read yesterday’s article, you can skip the next three paragraphs, which explain the system I used.

These guys were great in college.

These guys were great in college.

I start by calculating each quarterback’s Adjusted Net Yards per Attempt, done by starting with passing yards per attempt, adding 20 yards for each touchdown and subtracting 45 yards for each interception, and subtracting sack yards lost from the numerator and adding sacks to the denominator. Because the NCAA treats sack stats as rushing data, and because the game logs I have (courtesy of cfbstats.com) only show separate sack data on the team level, some estimation is involved in coming up with player sacks. Each quarterback is assigned X% of the sacks his team’s offense suffered in each game, with X equaling the number of pass attempts thrown by that player divided by his team’s total number of pass attempts.

Once I have calculate the ANY/A for each player, I then adjusted their ratings for strength of schedule. This involves an iterative process I described here and is virtually identical to how I calculate SRS ratings in college football on the team level. You adjust each quarterback’s ANY/A (weighted by number of pass attempts) for the qualify of the defense, which is adjusted by the quality of the quarterbacks it faced, which is adjusted by the quality of all the defenses all of those quarterbacks faced, and so on. After awhile, the ratings converge, and you come up with final, SOS-adjusted ANY/A ratings.
[continue reading…]

{ 4 comments }

The Chiefs play the Baylor game on an endless loop for the other 31 teams.

The Chiefs play the Baylor game on an endless loop for the other 31 teams.

A few weeks ago, I discovered cfbstats.com, which has made available for download an incredible amount of college football statistics from the last eight seasons. Thanks to them, I plan to apply some of the same techniques I’ve used on NFL numbers over the years to college statistics. If you’re a fan of college football, you’re probably already reading talented writers like Bill Connelly and Brian Fremeau, but hopefully I can bring something new to the table for you to enjoy.

There are many differences between college and professional football, but many of the same stats still matter. For quarterbacks, Adjusted Net Yards per Attempt is still the king of the basic stats [1]For the uninitiated, ANY/A is calculated by starting with passing yards per attempt, adding 20 yards for each touchdown and subtracting 45 yards for each interception, and subtracting sack yards lost … Continue reading, and it is arguably even more important in college where teams play at varying different paces.

There’s a small problem, however, if you want to calculate ANY/A at the college level: the NCAA counts sacks as rush attempts and sack yards lost as negative rushing yards. I manually overrode [2]Unfortunately, some estimation was involved. The player game logs at cfbstats do not identify quarterback sacks, but the team game logs do. So for each quarterback, we know how many passes he threw … Continue reading that decision in my data set, so going forward, all rushing and passing data will include sack data in the preferred manner (keep this in mind when you compare the statistics I present to the “official” ones).
[continue reading…]

References

References
1 For the uninitiated, ANY/A is calculated by starting with passing yards per attempt, adding 20 yards for each touchdown and subtracting 45 yards for each interception, and subtracting sack yards lost from the numerator and adding sacks to the denominator.
2 Unfortunately, some estimation was involved. The player game logs at cfbstats do not identify quarterback sacks, but the team game logs do. So for each quarterback, we know how many passes he threw in the game and how many times his team was sacked. For quarterbacks who threw 100% of their team’s passes in a game, this is easy. However, for quarterbacks who threw fewer than 100% of their team’s passes, they were assigned a pro-rata number of their team’s sacks.
{ 10 comments }

All your NFL draft needs

All your NFL draft needs will not by satisfied by Football Perspective. I’ll be writing some meta draft articles, discussing draft pick value, historical expectations, and the like, but I won’t delve too deeply into the current crop of prospects for the 2013 draft. Fortunately, there are many excellent resources out there. I asked Sigmund Bloom and Matt Waldman for their thoughts on some of the best writers covering the 2013 draft. Listed below are their excellent recommendations (along with a few of my own) that should serve your draft needs well; I have also provided links to the twitter accounts of each writer (click on the person’s name for their twitter feed) for the more social media-friendly readers out there:

[continue reading…]

{ 0 comments }

Creating a Draft Value Chart, Part II

Last week, I took another stab at creating a draft value chart. The biggest modification I made was looking at just the value provided by a player in his first five years to a team. As a result, the graph flattened, compressing the difference between the value provided by the top and bottom picks.

I’m not sure if there’s a right answer, or even what the “market” is. Almost no one thinks the high values assigned by the Jimmy Johnson draft chart are “correct.” Still, I think advanced analysts can sometimes get carried away with the idea of trading down. You may not need a dozen superstars to win, but you probably need a few, especially on offense.

Last time, I stated that we needed to take the marginal value of a player compared to that of an undrafted pick. That’s true, but after thinking it over some more, we need to do this on a yearly basis. A player providing 1 or 2 points of AV in a season obviously isn’t doing much. Therefore, I reconstructed the draft value chart by giving a player credit only for the AV he produced after 2 points of AV in each season. So if a player had an AV of 10 in each of his first 5 seasons, he gets credit for 40 points of value. Using these values produces the following chart, along with a logarithmic trendline:

After again removing the marginal value for the draft slots on the “career” level — even undrafted players, on average, will have some seasons with AV over two in their first five years — we can finalize this draft value chart. You can view all the values here. We can also compare this (in blue) to the Jimmy Johnson draft chart (in red):
[continue reading…]

{ 37 comments }

Creating a NFL draft value chart, Part I

Nearly five years ago, I came out with my own draft value chart to replace the “Jimmy Johnson” draft chart commonly cited by draftniks. What I did then was assign the career approximate value grade to each slot for each player drafted over a 30-year period, smoothed the data, and came up with a chart that actually represented career production.

The chart was due for an update in any event, but I’m going to make a key change. Using each player’s career AV makes sense on some level, as the drafting team gets the chance to have a player for his entire career. But the real value in the draft –especially now thanks to the new collective bargaining agreement — is the ability to get a player for cheap on his rookie contract, which expires after (at most) five years. The Jets got a great deal with Darrelle Revis early in his career, but now that he’s the highest paid cornerback in the NFL, much of his value (even pre-injury) is gone.

There’s also another consideration. Of the 100 top-ten draft picks between 1998 and 2007, only 48 players [1]counting Eli Manning and Philip Rivers as staying with the teams that drafted them were still on the same team entering their sixth season. From the perspective of the head coach, things look even bleaker. In only eleven instances were the head coach and the top-ten pick still on the same team after five years (i.e., in year six): Chris McAlister and Jamal Lewis with Brian Bilick in Baltimore, Donovan McNabb with Andy Reid in Philadelphia, Richard Seymour with Bill Belichick in New England, Julius Peppers and Jordan Gross with John Fox in Carolina, Carson Palmer with Marvin Lewis in Cincinnati, Eli Manning with Tom Coughlin in New York, A.J. Hawk with Mike McCarty in Green Bay, Mario Williams with Gary Kubiak in Houston, and Levi Brown with Ken Whisenhunt in Arizona.

If you’re a head coach — or a general manager — I’m not sure it makes sense to project any more than five years down the line. Therefore, I’m going to construct my draft value chart based on the amount of Approximate Value provided by that player in his first five years after being drafted. [2]Note: I am giving the player credit for all of the AV he earned, regardless of whether or not it was accumulated with the team that selected him. Using PFR’s AV as my guide, I graded each player drafted from 1980 to 2007 and counted how much AV they accumulated in each of their first five years. Below is a chart plotting the data along with a smoothed line:


[continue reading…]

References

References
1 counting Eli Manning and Philip Rivers as staying with the teams that drafted them
2 Note: I am giving the player credit for all of the AV he earned, regardless of whether or not it was accumulated with the team that selected him.
{ 11 comments }

Like everything else, the rules disappear when Ogden is involved.

The game is won in the trenches, I know.

As we hit the halfway mark of the season, some teams are already thinking about next year, and in particular, the 2013 draft. If I was in charge of a bad team, and specifically, a bad passing team, I would try to avoid spending a lot of money or a high first round pick on a left tackle. This philosophy is more guideline than rule — if there is a can’t miss prospect there and/or you are underwhelmed with the other top prospects, then draft the tackle — but spending a high pick on an offensive lineman would be my move of last resort.

Let’s pretend for a few minutes that a top-five pick on a left tackle is going to give you Jake Long or Joe Thomas or Jonathan Ogden, and not Jason Smith or Levi Brown or Robert Gallery or Mike Williams. Now, why is having a star left tackle so valuable? The traditional theory goes that since the left tackle is response for protecting the quarterback’s blind side, he’s the most important member of your offensive line. The other corollary is that most star pass rushers play on the defense’s right side (and the offense’s left), amplifying the value of the left tackle.

When it comes to the running game, the left tackle is no more valuable than the right tackle, or (in some systems) any other members of the offensive line, for that matter. To make this a more straightforward analysis, let’s just stick to the passing game, even though obviously most elite left tackles are also very good at run blocking, which of course adds value.

On most passing plays, offensive linemen are basically the equivalent of fences, designed to prevent the opposition from getting to the quarterback. How useful is a fence that’s totally impenetrable on the left side but has a human-sized hole on the right? This isn’t just a snarky comment; an offensive line is often only as valuable as its weakest link. Which defense will get to the quarterback first: one facing five average linemen or one facing three average linemen, an All-Pro left tackle and the worst starting right tackle in the league? If you were a defensive coordinator, which group would you rather scheme against? To me, it’s a pretty simple question: you want to attack your opponent’s weakness, and an offensive line, like a fence or a chain, is only as strong as its weakest link.

Let’s put it another way. In what circumstances does an All-Pro left tackle add value over say, the 25th best starting left tackle in the league? I think those circumstances are basically limited to those plays where:

The All-Pro left tackle does his job, and the other four, five or six blockers do their job, and the quarterback makes the right read and an accurate throw, and the receiver makes the catch, and on this particularly play, the player(s) that was (were) blocked by the All-Pro left tackle would have gotten to the quarterback in time to prevent him from throwing and completing said pass had he (they) been blocked by a replacement-level tackle.

If you think there are a lot of ‘ands’ in that sentence, you’re right. If the other lineman don’t do their job, the star left tackle is meaningless. If the quarterback can’t make the right read or is inaccurate, the left tackle that blocks DeMarcus Ware doesn’t help his team (other than an incomplete pass being better than a sack or a rushed throw that turns into an interception). If the receiver drops the ball, the left tackle doesn’t provide any value. And if we’re talking about a player where the left tackle didn’t do anything that a replacement level linemen wouldn’t have done, then our star tackle has added no value, either.
[continue reading…]

{ 10 comments }

Wins with quarterbacks drafted by that team

Good stat today by ESPN’s Adam Schefter, who notes that Kansas City has gone 25 years without winning a game with a quarterback drafted by the Chiefs. This Todd Blackledge-led victory over the Chargers in 1987 was the last time a quarterback drafted by the Chiefs won a game in red and gold.

That’s remarkable, but as always, we need context. The table below looks at all team wins from 1988 to 2012 and shows how many games were won by a quarterback drafted by that team. Note: For purposes of this post, I’m considering John Elway, Jim Everett, Kelly Stouffer, Eli Manning, and Philip Rivers as having been drafted by the Broncos, Rams, Seahawks, Giants, and Chargers, respectively. Additionally, quarterbacks drafted before 1988 count, but only their wins starting in 1988 count for purposes of the table below. The last two columns show, for each, the quarterback with the most wins among those quarterbacks drafted and not drafted by that team.

TmWinsWbDQBPercMWbDQBMWbnDQB
NWE22521294.2%Tom Brady (128)Doug Flutie (7)
IND21318185.0%Peyton Manning (141)Jim Harbaugh (20)
PIT23719883.5%Ben Roethlisberger (83)Tommy Maddox (15)
NYG21717781.6%Eli Manning (74)Kerry Collins (35)
PHI22515970.7%Donovan McNabb (92)Michael Vick (18)
DEN22115570.1%John Elway (102)Jake Plummer (39)
TAM17311767.6%Trent Dilfer (38)Brad Johnson (26)
CIN15610466.7%Carson Palmer (46)Jeff Blake (25)
BUF20312662.1%Jim Kelly (91)Drew Bledsoe (23)
SDG19111861.8%Philip Rivers (66)Stan Humphries (47)
ATL18411361.4%Matt Ryan (49)Chris Chandler (34)
MIA20411857.8%Dan Marino (99)Jay Fiedler (36)
WAS18010457.8%Mark Rypien (45)Brad Johnson (17)
DAL20411556.4%Troy Aikman (94)Tony Romo (50)
NYJ1799955.3%Chad Pennington (32)Vinny Testaverde (35)
TEN21611955.1%Steve McNair (76)Warren Moon (51)
CLE1276853.5%Bernie Kosar (29)Derek Anderson (16)
DET1508053.3%Rodney Peete (21)Scott Mitchell (27)
MIN21410850.5%Daunte Culpepper (38)Warren Moon (21)
JAX1397050.4%David Garrard (39)Mark Brunell (63)
BAL1457350.3%Joe Flacco (49)Steve McNair (15)
ARI1497147.7%Jake Plummer (30)Kurt Warner (27)
CHI1968844.9%Jim Harbaugh (35)Jay Cutler (29)
STL1626540.1%Jim Everett (38)Marc Bulger (41)
SFO2298336.2%Alex Smith (37)Steve Young (89)
HOU712433.8%David Carr (22)Matt Schaub (38)
GNB2316929.9%Aaron Rodgers (45)Brett Favre (160)
CAR1263225.4%Kerry Collins (22)Jake Delhomme (53)
SEA1863619.4%Rick Mirer (20)Matt Hasselbeck (69)
OAK1772011.3%Steve Beuerlein (8)Rich Gannon (45)
NOR19921.00%Danny Wuerffel (2)Drew Brees (64)
KAN20200.00%--Trent Green (48)

As bad as the Chiefs record has been, the Saints record isn’t any better. In fact, since Archie Manning’s last game for the Saints, New Orleans has only drafted two quarterbacks – Dave Wilson and Danny Wuerffel – who have started and won a game for the team. JaMarcus Russell couldn’t even break the Raiders list, ending his career with seven wins. Two other interesting notes. Tony Romo is the only undrafted quarterback in the league currently starting. And of the 32 starting quarterbacks, three of them — Michael Vick, Matt Schaub, and Matt Ryan — were drafted by the Falcons.

{ 7 comments }

In yesterday’s post, I argued that teams were overly hesitant to move on from bad investments. There’s a reason for that: miss on a first-round quarterback, and there are serious ramifications. Sometimes the offensive coordinator gets the axe first — we saw the Jets move on from Brian Schottenheimer this past offseason — but usually the coach and offensive coordinator are a package deal. And the quarterback usually gets at least one more chance with a new staff.

The 2007 draft provides two examples of this. The Oakland Raiders drafted JaMarcus Russell with the first overall pick, and we know how that went. This was part of a regime change, as Lane Kiffin and Greg Knapp replaced Art Shell and John Shoop. But by the end of 2008, both Kiffin and Knapp were gone, as Russell lasted for one more year under Tom Cable. With the 22nd pick, Cleveland selected Brady Quinn. Romeo Crennel and the Browns went 10-6 that season, but the team regressed to 4-12 in 2008. With Brady Quinn barely making an impact in two years and the team struggling, Crennel and offensive coordinator Rob Chudzinski were shown the door; a year later, Quinn was done in Cleveland, too.

Lest anyone forget, Blaine Gabbert is already on his second staff. Jack Del Rio and Dirk Koetter were shown the door for largely non-Gabbert-based reasons, although both have landed well in Denver and Atlanta as coordinators. But let’s take a step back and look at history. From 1998 to 2010, there were 35 quarterbacks selected in the first round of the draft. The table below shows each quarterback, his last year as the main starter for that team, how many years he “survived” there (simply his last year starting minus his draft year plus one); I’ve also listed the team’s offensive coordinator and head coach during the quarterback’s rookie season, and how long each of those two men survived in their positions individually and collectively. Finally, the last column is my subjective “bust/not bust” column, with me grading each quarterback on a scale from 1 to 3 on the “was this player a terrible, average, or good pick.” Again, in all of these cases I’m looking at the success with that team, not with any other team (and for Philip Rivers and Eli Manning, I’m considering them as having been drafted by the Chargers and Giants, respectively.)

YearPickTmQBLast Yr StYrs SurvOCLast YrYrs SurvHCLast YrYrs SurvCombinedbust?
19982SDGRyan Leaf20003Mike Sheppard19981June Jones1998121
19981INDPeyton Manning201013Tom Moore200912Jim Mora20014163
19992PHIDonovan McNabb200911Rod Dowhower20013Andy Reid201214173
19993CINAkili Smith20002Ken Anderson20002Bruce Coslet2000241
199911MINDaunte Culpepper20046Ray Sherman19991Dennis Green2001343
199912CHICade McNown20002Gary Crowton20002Dick Jauron2003571
19991CLETim Couch20024Chris Palmer20002Chris Palmer2000241
200018NYJChad Pennington20067Dan Henning20001Al Groh2000123
20011ATLMichael Vick20066George Sefcik20011Dan Reeves2003343
20023DETJoey Harrington20054Maurice Carthon20021Marty Mornhinweg2002121
200232WASPatrick Ramsey20032Steve Spurrier20032Steve Spurrier2003241
20021HOUDavid Carr20065Chris Palmer20043Dom Capers2005471
20031CINCarson Palmer20108Bob Bratkowski20108Marvin Lewis201210183
20037JAXByron Leftwich20053Bill Musgrave20042Jack Del Rio20119112
200319BALKyle Boller20075Matt Cavanaugh20042Brian Billick2007571
200322CHIRex Grossman20075John Shoop20031Dick Jauron2003121
200422BUFJ.P. Losman20063Tom Clements20052Mike Mularkey2005241
20044SDGPhilip Rivers20118Cam Cameron20063Marty Schottenheimer2006363
20041NYGEli Manning20118John Hufnagel20063Tom Coughlin20129123
200411PITBen Roethlisberger20118Ken Whisenhunt20063Bill Cowher2006363
200525WASJason Campbell20095Don Breaux20051Joe Gibbs2007342
20051SFOAlex Smith20117Mike McCarthy20051Mike Nolan2008452
200524GNBAaron Rodgers20117Tom Rossley20051Mike Sherman2005123
20063TENVince Young20105Norm Chow20072Jeff Fisher2010572
200610ARIMatt Leinart20061Keith Rowen20061Dennis Green2006121
200611DENJay Cutler20083Rick Dennison20083Mike Shanahan2008362
200722CLEBrady Quinn20093Rob Chudzinski20082Romeo Crennel2008241
20071OAKJaMarcus Russell20093Greg Knapp20082Lane Kiffin2008241
200818BALJoe Flacco20114Cam Cameron20125John Harbaugh20125103
20083ATLMatt Ryan20114Mike Mularkey20114Mike Smith2012593
20091DETMatthew Stafford20113Scott Linehan20124Jim Schwartz2012483
200917TAMJosh Freeman20113Greg Olson20113Raheem Morris2011362
20095NYJMark Sanchez20113Brian Schottenheimer20113Rex Ryan2012472
20101STLSam Bradford20112Pat Shurmur20101Steve Spagnuolo2011232
201025DENTim Tebow20112Mike McCoy20123Josh McDaniels2010141

[continue reading…]

{ 7 comments }
Next Posts