≡ Menu

What a spicy hot take of a headline, I know.  Continuing on yesterday’s theme, let’s talk more about at Joe Flacco’s career with the Ravens. He has a career Adjusted Net Yards per Attempt average of 5.64, which is not very good. In fact, it’s pretty bad: the average ANY/A over the last 10 years was 5.94, when you weight the average in each season by the percentage of Flacco’s career attempts that came in that season.  Flacco, therefore, has a career Relative ANY/A of -0.29 (difference due to rounding), which you can see below:

Here’s the other interesting thing about this: Flacco has 5,608 pass attempts/sacks with the Ravens, the 12th-most dropbacks of any quarterback with one team since 1970. And as you can probably guess, Flacco is the only one with a negative RANY/A. You have to go to Drew Bledsoe with the Patriots (4780 dropbacks, -0.02 RANY/A) to find the next quarterback with a negative RANY/A with one team and a lot of playing time. And after Bledsoe — who barely qualifies — you have to go down to Randall Cunningham with the Eagles, who had 3784 dropbacks and a -0.37 RANY/A. [continue reading…]

{ 0 comments }

We don’t spend a lot of time looking at the bottom of leaderboard. When it comes to efficiency stats, you need to have a minimum threshold of quantity to qualify for such title. When it comes to passer rating, that minimum is 14 attempts per team game. Last year, DeShone Kizer had the worst passer rating in the NFL. In the last 11 years, the Jets have had three different quarterbacks with the worst passer rating in the NFL (Ryan Fitzpatrick, Geno Smith, and Kellen Clemens), while the entire NFC has just one (Jimmy Clausen).

The table below shows the quarterback with the worst passer rating in every year since the merger (along with their era-adjusted passer ratings), an update of this post from three years ago.

YearQuarterbackTeamEra-Adj PRAct PR
2017DeShone KizerCLE40.260.5
2016Ryan FitzpatrickNYJ47.069.6
2015Peyton ManningDEN44.467.9
2014Blake BortlesJAX47.369.5
2013Geno SmithNYJ47.166.5
2012Matt CasselKAN47.866.7
2011Blaine GabbertJAX47.765.4
2010Jimmy ClausenCAR41.058.4
2009JaMarcus RussellOAK33.750.0
2008Derek AndersonCLE50.066.5
2007Kellen ClemensNYJ44.960.9
2006Andrew WalterOAK42.155.8
2005Kyle OrtonCHI46.259.7
2004A.J. FeeleyMIA45.561.7
2003Kordell StewartCHI45.156.8
2002Joey HarringtonDET46.159.9
2001Jon KitnaCIN49.361.1
2000Akili SmithCIN41.452.8
1999Jake PlummerARI40.450.8
1998Ryan LeafSDG27.439.0
1997Kerry CollinsCAR45.255.7
1996Rick MirerSEA46.456.6
1995Trent DilferTAM47.560.1
1994Heath ShulerWAS47.859.6
1993Mark RypienWAS46.456.3
1992Stan GelbaughSEA44.352.9
1991Jeff Kemp2TM46.155.7
1990Marc WilsonNWE50.961.6
1989Troy AikmanDAL46.755.7
1988Vinny TestaverdeTAM42.548.8
1987Mark MalonePIT38.246.7
1986Jack TrudeauIND46.053.5
1985Vince FerragamoBUF43.950.8
1984Todd BlackledgeKAN49.759.2
1983Scott BrunnerNYG45.154.3
1982Joe FergusonBUF49.656.3
1981Vince EvansCHI44.951.1
1980Phil SimmsNYG51.858.9
1979Doug WilliamsTAM48.852.5
1978Steve DeBergSFO41.740.0
1977Joe PisarcikNYG47.842.3
1976Gary MarangiBUF30.430.8
1975Archie ManningNOR45.144.3
1974Mike PhippsCLE49.246.7
1973Norm SneadNYG47.745.8
1972Jim PlunkettNWE46.045.7
1971Bobby DouglassCHI41.537.0
1970Terry BradshawPIT32.730.4

What you might notice in addition to a few Super Bowl winning quarterbacks on the list, is that Vinny Testaverde is the only one on there twice. [Editor’s note: Jeff Kemp actually finished with the worst passer rating of any QB in 1991.] Testaverde has 38 points of bad Gray Ink — i.e., if you assign 10 points to a last-place finish, 9 points to a second-to-last place finish, 8 points to a third-from-the-bottom spot, and so on. He ranked last in ’88 (10 points), second-to-last in ’91 (9 points), 5th-from-the-bottom in ’89 (+6), 7th from last in ’00 (+4), 8th from the bottom in ’04 and ’94 (+6), 9th from the bottom in ’92 (+2), and 10th from last in ’01 (+1), for a total of 39 points.

That’s the most of any quarterback since 1970, narrowly edging out well, a few other names that I doubt will surprise you.

QuarterbackGray Ink
Vinny Testaverde38
Jake Plummer33
Dan Pastorini32
Archie Manning32
Marc Wilson31
Mike Phipps31
Kerry Collins29
Jim Hart28
Joey Harrington28
Mark Malone27
Joe Ferguson27
Jay Schroeder26
Troy Aikman26
Richard Todd25
Rick Mirer25
Jim Everett25
Ryan Fitzpatrick24
Kordell Stewart24
Kyle Boller22
Billy Joe Tolliver22
Matt Hasselbeck21
Mark Sanchez21
Randy Wright21
Jim Zorn21
Bobby Douglass21
Boomer Esiason20
Jim Plunkett20
Drew Bledsoe19
Trent Dilfer19
Derek Anderson19
Ryan Leaf19
Joe Pisarcik19
Joe Flacco18
Brett Favre18
Tony Banks17
Warren Moon17
Chad Henne17
Marc Bulger17
Steve DeBerg17
Terry Bradshaw17
Bob Avellini17
Craig Whelihan17
Joe Namath17
Eli Manning16
Gus Frerotte16
Blaine Gabbert16
Rex Grossman16
Blake Bortles16
Geno Smith16
Vince Evans16
Josh McCown15
Lynn Dickey15
Paul McDonald15

What stands out to you?

{ 0 comments }

Yesterday, I noted that the rate of passing touchdowns has been relatively stable throughout NFL history. But that doesn’t mean the type of passing touchdown hasn’t changed.

In the post-World War II era, the average length of touchdown pass was occasionally over 30 yards! Today, the average length of each touchdown pass is below 20 yards, and it’s been
for every season since 2006. Most of the change came in the ’60s and early ’70s, as opposed to the many changes in passing statistics that are the result of the west coast offense.

The graph below shows the average length of touchdown passes in each professional football season (combining the AFL, AAFC, and NFL) since 1940. [continue reading…]

{ 0 comments }

Adam Steele is back for another guest post. You can view all of Adam’s posts here. As always, we thank him for contributing.


Surplus Yards 2017

In response to the Jared Goff post from earlier this month, I wanted to delve into the yardage a QB picks up on long plays. I theorized that Goff’s historical ANY/A leap in 2017 was in part fueled by an unsustainable number of long completions. To measure this, I created a stat called Surplus Passing Yards. Its calculation is quite simple – on any given completion, yardage in excess of 40 is deemed to be surplus. So a 67 yard pass play yields 27 surplus yards. I then add up the surplus yards for all applicable plays during a season. [1]You may be wondering why I choose 40 yards as the cutoff for a “normal” play. After digging through years of play-by-play and running some correlations, 40 yards seems to be the inflection point … Continue reading

Having established in the above footnote that surplus yards are random and not indicative of QB skill, let’s take a look at the qualifying quarterbacks from 2017. The chart below shows every  40+ yard completion from each QB along with his total surplus yardage. For example, Alex Smith had 13 long passes of 40+ yards; his longest pass went for 79 yards, his second-longest pass for 78 yards, his third-longest for 75 yards, etc. That means his longest pass had 39 Surplus Yards, his second-longest completion had 38 Surplus Yards, and so on; all told, he had 236 Surplus Yards last season, the most in the NFL. [continue reading…]

References

References
1 You may be wondering why I choose 40 yards as the cutoff for a “normal” play. After digging through years of play-by-play and running some correlations, 40 yards seems to be the inflection point where randomness takes over. The ability to complete passes in the 30-40 yard range is a repeatable skill, and is often the determining factor that separates the great QB’s from the average ones. But beyond 40 yards, the yardage picked up very long pass plays is almost entirely random from season to season. I calculated the surplus yards for all qualifying QB’s from 1994-2017, then compared all cases where a QB attempted 224+ passes in consecutive seasons. To avoid biasing the results by playing time, I converted the data into Surplus %, or the percentage of passing yards that came via surplus yards. Over a sample of 513 season pairs, the correlation of Year N to Year N+1 surplus % was a miniscule .04 with an R^2 of .002!
{ 1 comment }

Single-Season Era-Adjusted Passer Ratings

On Monday, I published updated (through 2017) career passer ratings that are adjusted for era. Last year, I published the single-season ratings, so I wanted to update that post today.

Passer rating is a bad stat, and era-adjusted passer ratings have all of those same flaws, too. But EA-PR is without question better than passer rating, and since passer rating is such a ubiquitous stat, I wanted to post all of the EA-PRs so you could have them at your disposal (the table below has over 7,700 rows!).

Below are the era-adjusted passer ratings for every player in every season since 1932.  Here’s how to read the table below, which is fully sortable and searchable.  Sid Luckman has the best single season, playing in the NFL for Chicago in 1943.  That season counted for 11.58% of his career pass attempts (useful if you want to calculate a player’s career passer rating), as he threw 202 passes, completed 110 of them for 2,194 yards with 28 TDs and 12 INTs.  That was enough attempts to qualify for the passer rating crown; his actual passer rating was 107.5, and his Era Adjusted Passer Rating was 135.0, the best ever. [continue reading…]

{ 0 comments }

Best Passing Teams At Picking Up First Downs

Yesterday, I looked at passing first down data, with an emphasis on percentage of passing plays (including sacks) that went for first downs.

The 2016 Atlanta Falcons had an incredible offense.  Like, a really, really good offense that had lots of eye-popping statistics. Here’s another one: the Falcons picked up 239 passing first downs on 537 pass attempts plus 37 sacks. That means Matt Ryan and company picked up a first down on 41.6% of all passing plays.  That’s the fourth best rate in NFL history.

The best rate belongs to the 2004 Colts, at 44.0%.
The second-best rate belongs to the 2013 Broncos, at 42.2%.
The third-best rate belongs to the 2006 Colts, at 42.1%.

Any guesses what those three teams have in common?

The 2004 Colts had Peyton Manning and Marvin Harrison, Reggie Wayne, Dallas Clark, and Brandon Stokley.

The 2006 Colts had Manning, Harrison, Wayne, and Clark, too.

The 2013 Broncos? They had Manning, Demaryius Thomas, Eric Decker, Wes Welker, and Julius Thomas (Stokley was on the 2012 Broncos).

So maybe it was the quarterback.  The table below shows the top 100 teams in percentage of team passing plays that went for a first down. [continue reading…]

{ 0 comments }

Completion Percentage and First Downs

In the middle of the 2017 season, I wrote a bit about completion percentage and first downs. Here’s one of my favorite charts to explain the evolution of the passing game in the NFL: the blue line shows completion percentage for each season in the NFL since 1960, a number that is steadily rising. The orange line shows first downs gained on completed passes in the NFL since 1960, which has been steadily declining:

How about first downs per pass play (including sacks)? That’s a number that’s been pretty consistent: it’s been between 28% and 33% every year, and while it’s showing a slight increase over time, it’s pretty slight. [continue reading…]

{ 1 comment }

Additional Thoughts on Average Sack Yards Lost

Yesterday, I discussed the average amount of yards lost on sacks over NFL history.  The average has been stable at around 6.5 since 1993, although it was much higher (for reasons still to be determined) in older periods.  Today, though, I want to look at the relationship between sack yards lost per sack and other variables for individual quarterbacks.

I looked at all quarterbacks with at least 224 pass attempts since 2002. The graph below shows those 522 quarterbacks and how they fared in both sack rate (X-Axis) and yards per sack lost (Y-Axis):

As you can see, there is not much of a correlation there (-0.10), although there is a slight relationship that as sack rate increases, sack yards lost per sack goes down.

What about running quarterbacks — do they have longer average yards lost due to sacks? Anecdotally, it feels like no: Michael Vick was at 5.9, Randall Cunningham 7.3, Cam Newton is at 7.6, Steve Young 5.7, Steve McNair 6.2, Donovan McNabb 6.4, Russell Wilson 6.4, and Tyrod Taylor is at 5.4.  What about over a larger sample?

Here is the same graph again, but instead of sack rate on the Y-Axis, I’ve plotted a measure of rushing prowess.  What measure? I used rushing yards per pass attempt, which should give some measure of running quarterbacks.  For example, last year, the top three players by that metric were Newton (1.53), Wilson (1.06), and Taylor (1.02). The top two years go to Vick — 2.81 in ’04, and 2.68 in ’06.

The correlation coefficient here is -0.20, indicating a weak negative relationship: as rushing prowess goes up, yards per sack lost goes down ever so slightly.

How about sack yards lost and completion percentage? Well, there is no correlation there at all.

What would you like to see in Part III?

{ 0 comments }

Byron Leftwich and Average Length of Sack

Let me tell you something I bet you didn’t know about Byron Leftwich: he was sacked 92 times in his career. There were 44 quarterbacks from 2003 to 2012 with 1500+ passes; of that group, Leftwich ranked 17th in sack rate at 5.4%.  But here’s something I bet you didn’t know about Leftwich: on his sacks, he lost just 452 yards, and averaged just 4.91 yards lost per sack. That is the lowest average in NFL history (well, at least since the merger, but likely in history; see graph below) among quarterbacks with 1500+ attempts. [1]Note: From 2003 to 2012, Jeff Garcia averaged just 4.86 average sack yards lost, so Leftwich ranked second during this time. Leftwich’s career spanned this decade, but Garcia entered the league … Continue reading

We don’t spend much time looking at yards lost per sack, and perhaps with good reason.  Here are the 10 players with the lowest average yards lost per sack since 1970 among passers with 1500+ attempts, all of whom lost under 5.7 yards per sack:

That’s not exactly a who’s who list of the best quarterbacks in NFL history.  I’d like to spend more time looking at average sack yards lost and see what is there, so I’m going to open this up to the smart readers in the comments.  So let’s start with an interesting graph: here is the average yards lost per sack for each year in NFL history beginning in 1960: [continue reading…]

References

References
1 Note: From 2003 to 2012, Jeff Garcia averaged just 4.86 average sack yards lost, so Leftwich ranked second during this time. Leftwich’s career spanned this decade, but Garcia entered the league in 1999 and his average sack was 5.23 yards for his career.
{ 0 comments }

Background reading (Part I, Part II, Part III, Part IV, Part V: Career Era-Adjusted Passer Ratings Through 2016, 2017 Era-Adjusted Passer Ratings). You can also view the single-season era-adjusted passer ratings here.

The NFL’s passer rating formula can be broken down into the following.

A = (Cmp% – .30) * 5
B = (Y/A – 3.0) * .25
C = TD% * 20
D = 2.375 – Int% * 25

Passer Rating = 100 * (A + B + C + D) / 6

Let’s use Tom Brady as an example.  He has a completion percentage of 63.93 (making A = 1.696), a yards per attempt average of 7.514 (making B = 1.128), a TD percentage of 5.54% (making C = 1.108), and an INT percentage of 1.82% (making D = 1.921).  If you sum A, B, C, and D, multiply by 100, and divide by 6, you get 97.6, which is Brady’s career passer rating.

Last year, I derived the formula to create era-adjusted passer ratings.  This is necessary because the league averages in these variables — particularly completion percentage and interception rate — have changed dramatically over the last 50 years.  For example, when passer rating was created in the early 1970s, the average completion percentage was 50%.  So instead of taking each passer’s completion percentage and subtracting 0.30 (before multiplying by 5), we take each passer’s completion percentage and subtract from that the league average in a given season minus 0.20.  This makes a completion percentage of 60% in the 1970s equivalent to a completion percentage of 70% when the league average completion rate is 60%.

We can do that for all the four variables, and keep the same formula/structure largely in place.

Here are the new formulas for each of the four variables:

A = (Cmp% – (League_Avg_Cmp% – 0.20) ) * 5
B = ( Y/A – (League_Avg_Y/A – 4.0) ) * .25
C = TD% * 20 + (1 – 20 * LgAvgTD_Rate)
D = 2.375 – (Int% * 25 + (1.375 – 25 * LgAvgINT_Rate) )

Then we sum A through D, multiply by 100, and divide by 6.  The table below shows the career era-adjusted passer ratings for the 186 passers with at least 1,500 attempts. Here is how to read the table below. Otto Graham is the career leader in era adjusted passer rating (this analysis includes AAFC and AFL data — we are only adjusting for era in this analysis, not strength of league). He threw 2,626 passes in his career, began in 1946 and finished in 1955, had an actual passer rating of 86.6, and an era adjusted passer rating is 95.2. Graham, of course, is in the Hall of Fame. [continue reading…]

{ 0 comments }

2017 Era-Adjusted Passer Ratings

Last year, I wrote a six-part series on adjusting passer ratings for era.

Background reading:

Part I

Part II

Part III

Part IV

Part V (Career Passer Ratings)

Part VI (Single Season Ratings)

Passer rating is made up of four variables: completion percentage, yards per attempt, touchdown percentage, and interception percentage.  The reason passer rating needs to be adjusted for era? When it was derived, in order to get an average rating in each of the four variables, a passer needed to complete 50% of his passes, average 7.0 yards per pass, have a touchdown rate of 5%, and have an interception rate of 5.5% (yes, INT rates used to be higher than TD rates).  But those numbers — 50%, 7.0, 5%, 5.5% — were pegged in the 1970s and are not dynamic.  However, I came up with a formula that matches the intent of passer rating but just ties the variables to the league average in any given season. You can get the formulas and read more background in the linked posts.

Now, in 2017, the four averages were 62.1%, 7.02, 4.24%, and 2.46%.  One thing to keep in mind: these adjustments will not change the order of passer ratings in a given season.  So Alex Smith, Drew Brees, Tom Brady, Carson Wentz, and Jared Goff remain the top five; the way the formula works, it just subtracts a fixed amount from each passer’s actual passer rating.  In 2017, that amount was 20.26 during a poor passing season; it was 22.59 lower than actual in 2016. [continue reading…]

{ 0 comments }

All football historians know about the 1978 rules changes. Here’s an except I wrote about how those changes changed the NFL forever:

There were two key rules changes enacted in 1978. The first prohibited bumping, chucking, or otherwise making anything other than incidental contact with a receiver beyond five yards from the line of scrimmage. The second allowed offensive lineman to be able to extend their arms, and push with open hands, allowing for better blocking and fewer holding penalties. With those rules in place, quarterbacks needed fewer blockers and receivers needed to be less skilled to get open. As a result, three and four wide receiver sets become more common, and the fullback was phased out…. From 1970 to 1977, non-starting wide receivers consistently produced just under 10% of the team’s total receiving yards; by 1990, that number had doubled, and has shown no signs of subsiding.

So what was the impetus for those changes? The 1977 season, which was a passing nightmare. In 1976, teams averaged 4.07 Adjusted Net Yards per Attempt, defined as (Gross Passing Yards + 20 * TDs – 45 * INTs) divided by (Pass Attempts – Sack Yards Lost). Now a 4.07 league average ANY/A wasn’t high – the ’60s NFL saw an average ANY/A of 4.59 — but it wasn’t notably low, either. In fact, 1976 was a slightly better passing environment than the trailing five year average of 4.01. Then, 1977 happened: teams averaged just 3.55 ANY/A, the lowest mark in the NFL since 1953. This was a dramatic decline in passing production of 0.52 Adjusted Net Yards per Attempt.

Fast forward 40 years. In 2016, the league-wide ANY/A average was 6.22, a shade off of the 6.26 ANY/A average in 2015. In fact, 2014 (6.14 ANY/A), 2015 (6.26), and 2016 (6.22) are the three best passing seasons in NFL history. There was little reason to expect 2017 to be any different, but it was: the NFL average ANY/A dropped to 5.91 last season, a decline of 0.31 ANY/A. That was the single largest year-over-year decline since 1976-1977. [continue reading…]

{ 1 comment }

Former 49ers and Chiefs quarterback Alex Smith has a well-earned reputation for being overly conservative. Smith was known as a low-risk, low-reward passer for years: he avoided interceptions but took a ton of sacks and threw a lot of short, safe passes. In 2011 with the 49ers, he ranked 30th in average pass length; he didn’t have enough passes in 2012 to qualify, but in 2013 with the Chiefs, he ranked 36th in how far his average pass traveled. In 2014, he ranked 33rd, and he repeated that ranking in 2015. In 2016 he ranked 29th, before vaulting to 22nd last year.

From 2011 to 2017, Smith threw 43 interceptions but took an incredible 260 sacks! That means over the last seven seasons, Smith has been sacked over 6 times as often as he’d thrown an interception (6.05 to be precise). Among the 32 quarterbacks who have thrown the most passes since 2011, only three others have even a 4:1 sack:interception ratio. Two of them are two of the best quarterbacks in the NFL in Russell Wilson (4.4 to 1) and Aaron Rodgers (5.20 to 1).  And there are some extenuating circumstances in both cases.

Wilson has played behind terrible offensive lines and scrambles often, which inflates his sack rate. Rodgers has been arguably the best quarterback in the NFL over the last seven years and has a tiny interception rate, although taking too many sacks is a legitimate criticism of his game. But neither passer is a dink-and-dunk type: both rank in the top 8 in yards per completion since 2011 (Rodgers averaged 12.0 yards per completion, Wilson 12.2) while Smith ranked in the bottom 8 with an 11.2 average.

The fourth quarterback is Smith’s old teammate, Colin Kaepernick (5.70 to 1). Even as a young player, Kaepernick always took a lot of sacks, and like Wilson, his scrambling inflated his sack rate a bit. Kaepernick averaged 5.3 sacks for every interception in 2012, then 4.9 in 2013, 5.2 in 2014, 5.6 in 2015, before catapulting to 9.0 in 2016, a year that may have been influenced by his political stance. But even still, Kaepernick wasn’t really a great match for Smith because he averaged 12.1 yards per completion, the 6th-highest rate since 2012.

So over the last 7 years, it’s pretty clear that no quarterback embodied the risk-averse style of player quite like Smith. With a ton of sacks, not many interceptions, and a low yards per completion average, Smith was the most conservative passer in football.

But over the last three years, Tyrod Taylor has taken the crown. In fact, Taylor is more Alex Smith than even Alex Smith! I looked at the 32 quarterbacks with the most pass attempts since the start of the 2015 season. Among that group, Taylor ranks 2nd in interception rate at just 1.29%, but he also ranks last in sack rate at 9.1%! The scramble factor is an issue here — by scrambling when a play breaks down instead of throwing it away, Taylor’s sack rate isn’t quite as bad as it appears — but only two of the other 32 quarterbacks have a sack rate within even two percent of Taylor’s. [continue reading…]

{ 1 comment }

Jared Goff Is The Exception

Whether it’s Mitchell Trubisky or Deshone Kizer or well, any rookie quarterback in the foreseeable future that underwhelms, the new theory for optimism is “Well look at how lost Jared Goff was as a rookie!” There is no doubt that Goff was terrible as a rookie and it’s equally true that he was excellent as a sophomore. Goff pulled off a remarkable worst-to-first campaign, ranking last in ANY/A in 2016 and then first in ANY/A in 2017. He increased his ANY/A average by 4.90, the greatest year-over-year increase in NFL history. That is why he is the exception.

I looked at all quarterbacks who (1) were 24 or younger during their rookie season, (2) threw at least 150 passes as a rookie, (3) threw at least 150 passes in their second year, and (4) entered the league in 1969 (when we first have sack data) or later. This naturally biases results in favor of second-year passers who improve, as quarterbacks who struggle as a rookie and then struggle in year two may not hit the 150-pass attempt threshold. Regardless, Goff’s improvement was truly remarkable. He finished 3.39 below league average in ANY/A in 2016 and then 1.82 above ANY/A in 2017. The graph below shows all passers who met the four criteria above. On the X-Axis, their Relative ANY/A as a rookies; on the Y-Axis, their Relative ANY/A as second-year players. A quarterback who is bad as a rookie and good as a sophomore would therefore be on the upper left quadrant of the chart, which is precisely where Goff (shaded in red) sits: [continue reading…]

{ 1 comment }

Why Great Passing Isn’t Becoming More Important

Yesterday is one of my favorite posts — with just one picture, you can see why NFL teams have become more pass-heavy over the last 70 years. It is not debatable that the NFL is more pass-happy now than it used to be: teams really are throwing more often than ever before.

However, what is debatable is whether or not the increase in quantity makes passing more important than ever before. The correlation between ANY/A and winning percentage doesn’t show that passing matters more now than it did in the ’70s. This is because passing efficiency is more compressed now than it used to be, which arguably makes having a great quarterback less important now than ever before.

Lest you think that claim is crazy, note that the starting quarterback for every Super Bowl champion in the ’70s is now in the Hall of Fame: Johnny Unitas (with a hat tip to Earl Morrall), Roger Staubach, Bob Griese (with a hat tip to Earl Morrall), Griese, Terry Bradshaw, Bradshaw, Ken Stabler, Staubach, Bradshaw, and Bradshaw. Heck, 6 of the 10 losing quarterbacks in those games are Hall of Famers: Fran Tarkenton three times, Staubach twice, and Griese, with Craig Morton appearing twice, too.

The graph below shows the standard deviation among all teams in Adjusted Net Yards per Attempt (the single best measure of passing efficiency) for each team since the merger.  As you can see, the variance is declining, which means the best passing teams aren’t standing out quite as far from average as they used to: [continue reading…]

{ 1 comment }

In 2017, NFL teams completed 10,856 passes. They also threw 17,488 passes and took 1,195 sacks (totaling 18,683 dropbacks). That means NFL teams completed passes on 58% of all dropbacks — let’s call this adjusted completion percentage, since unlike regular completion percentage, it includes sacks in the denominator.

NFL teams also rushed 13,755 times relative to those 18,683 dropbacks. That means NFL teams passed (including sacks) on 58% of all plays. Let’s call this number the league pass ratio.

The fact that the adjusted completion percentage and pass ratio were the same in 2017 was not a coincidence. In 1981, the league-wide adjusted completion percentage was a lot lower at 51%.  That year, the league-wide pass ratio was also 51%.

In 1971, the adjusted completion percentage was 47 percent, while the pass ratio was 46 percent.

In 1962, the adjusted completion percentage was 49% and the pass ratio was 49%.

In other words, the adjusted completion percentage — which measures how often a pass play results in a completion — and the frequency with which teams pass are highly correlated and also nearly identical.  The graph below shows, in dark blue, the league average adjusted completion percentage, and in red, the league average pass ratio, for each year since 1950. [continue reading…]

{ 1 comment }

In 2017, there were seven former number one overall picks who were their team’s main quarterback: Eli Manning, Matthew Stafford, Alex Smith, Cam Newton, Jared Goff, Jameis Winston, and Carson Palmer. An eighth, Sam Bradford, was going to be the Vikings starter, but he was injured early in the season.

Three more starting QBs were second overall picks: Marcus Mariota, Carson Wentz, and Mitch Trubisky. And another three were top five picks (Matt Ryan, Blake Bortles, and Philip Rivers).

Had former 24th overall pick Aaron Rodgers played a full season, it’s likely that half of all passes thrown in 2017 would have come from players drafted 24th overall or earlier. With the Rodgers injury, the next passer (in terms of draft status) was Paxton Lynch (26th pick), who only threw 45 passes. Players drafted 26th or earlier were responsible for 49% of all passes in 2017. To cross the 50% mark, you need to drop down to 32nd overall, which brings in Drew Brees. Players drafted 32nd overall or earlier were responsible for 52% of all passes in 2017.

That number is down slightly from 2016, in large part because Sam Bradford and Andrew Luck combined for over 1,000 attempts in 2016 and just 43 last year. The NFL also lost over 500 combined attempts from Robert Griffin and Ryan Tannehill — as a result, in 2016, quarterbacks drafted 18th overall (Joe Flacco) or earlier were responsible for 52% of all passing attempts.

The Flacco line was also the line of demarcation in 2015, which was boosted by having Peyton Manning, Luck, Bradford, and Tannehill as starters relative to 2017. Depending on how this year’s draft goes and how early those quarterbacks start, there’s a good chance that the Flacco line is once again the median mark.

In fact, 2018 could have the 12th overall pick as the median mark, assuming good health (which, of course, is a terrible thing to assume).  But let’s assume that three out of Sam Darnold, Josh Rosen, Josh Allen, and Baker Mayfield wind up as top 12 picks and starting quarterbacks, and let’s place them on the Browns, Jets, and Bills.   That would mean 18 of 32 starters would be top 12 picks.  We would also see 22 of the league’s 32 starters be top-18 draft picks, up from 16 a year ago.

How do we get there? [continue reading…]

{ 1 comment }

Analyzing Third Down Passes From 1997 to 2017

How has the NFL evolved when it comes to third down passing? Using the PFR Play Index, I looked at all passes on third downs in each season from 1997 to 2017 that met the following criteria:

  • The play came during the regular season.
  • The pass happened in the first three quarters of the game to minimize the effects of game situation, as 4th quarter passes may be different than passes earlier in the game (although that’s worth investigating, too!).
  • The team on offense was down by no more than 14 points or up by no more than 14 points, to again minimize the effects of game situation.
  • The distance was between 5 and 10 yards to go, to isolate obvious passing situations but not hopeless ones.

What were the results? What do you *think* the results would be? [continue reading…]

{ 12 comments }

Nick Foles is no stranger to great games. He has the greatest passing game in Eagles history, recorded on November 3rd, 2013 against the Raiders. Foles completed 22 of 28 passes for 406 yards and 7 touchdowns, with just one sack for one yard and zero interceptions. That translates to a whopping 18.79 Adjusted Net Yards per Attempt.

We can adjust that result for both era and quality of defense: Oakland’s pass defense was bad that season, allowing 7.41 ANY/A to opposing passers, but even still, that means Foles still averaged well over 11 more ANY/A against the Raiders than the average passer that season. Over the course of his 29 dropbacks, Foles provided 330 ANY above expectation, easily the best game in Eagles history. In fact, it’s one of just eight games since 2002 with over 300 ANY over expectation, joining three Peyton Manning games (against the Broncos in both the ’03 and ’04 playoffs, and with the Broncos against the Ravens in the 2013 Kickoff Classic), two Ben Roethlisberger games (Packers 2009, Colts 2014), and performances by Drew Brees (Patriots, 2009) and Kurt Warner (Packers, 2009 playoffs).

But then, against the Vikings, Foles had another masterpiece. And what made this one particularly special was that it came against a really good Minnesota defense. During the regular season, the Vikings allowed just 4.57 ANY/A, second best in the NFL. But in the NFC Championship Game, Foles was 26 for 33 for 352 yards with 3 TDs and no interceptions, with one sack for six yards. That translates to 406 Adjusted Net Yards on 34 dropbacks, or 11.94 ANY/A. That is 7.37 ANY/A above what the average opposing QB produced against the Vikings during the regular season; over the course of 34 dropbacks, that translates to 250 Adjusted Net Yards of added value.
[continue reading…]

{ 27 comments }

The Jets had an ugly 15-10 loss to the Bucs today, and quarterback Josh McCown was as responsible for it as anyone. Prior to some garbage yard throws, he had passed for just 157 net yards on 41 dropbacks with an interception, and the Jets first 11 drives (before a meaningless touchdown) ended with 7 punts, 2 turnovers, 1 FG attempt, and 1 turnover on downs.

But in the final seconds of the game, McCown managed to throw his 14th touchdown pass of the season. That set a new single-season career high for McCown, which is notable: that’s the oldest age any player set their single-season career high in passing touchdowns.

As I wrote earlier, McCown has turned into one of the great late bloomers in quarterback history. Of McCown’s 70 career starts, half of them have come with him at 34.4 years of age or older, giving him the fifth oldest median age of start in league history. But now he has another record all to his own.

Warren Moon set a career high with 33 touchdown passes at age 34 in 1990; 5 years later, Moon tied that mark at the age of 39. But he didn’t set a new career high at age 39, so the tie goes to McCown.

Similarly, Craig Morton originally set a career high in passing touchdowns in 1969 at the age of 26 with 21 scoring strikes; at age 38, in 1981, he again threw 21 touchdown passes.

Five player — Y.A. Tittle, Roger Staubach, John Elway, Steve Young, and Peyton Manning — set a new career high in touchdown passes at the age of 37. Those are the men McCown pushed aside it he record books today.

There are 301 quarterbacks in NFL history who threw for at least 10 touchdown passes in one season and are at least 35 years old in 2017. The graph below shows for each age, the number of QBs who set their career high at that age (and quarterbacks who tie that number later in their career get a 0.5 for each year; so age 26 and age 38 each get 0.5 for Morton). [continue reading…]

{ 1 comment }

Jameis Winston‘s average pass completion has traveled 8.24 yards in the air, the longest distance in the league.

On Carson Wentz‘s average completion, the ball traveled 8.11 air yards.

And Marcus Mariota? His average completion picked up 7.61 air yards before being caught.

Those are the three most vertical passers in the NFL this season by that metric.

Last year, Winston and Mariota ranked 2nd and 3rd in this category: Winston’s average gain was 7.89 yards before being caught, Mariota’s 7.86. Cam Newton led all passers at 8.14 air yards on completed passes. But Wentz? He ranked 27th out of 30 qualifying passers, at 5.34 yards.

In 2015 — the rookie years for Winston and Mariota — Winston ranked 2nd behind Carson Palmer with an 8.13 average; Mariota was in the top 10 at 7.24.

Wentz is having a remarkable season: he ranks 4th in yards per pass attempt, and ranks 1st in yards per completion. Winston ranks only 4th in yards per completion, while Mariota is down at 11th in yards per completion. That’s because those two — and especially Mariota — aren’t getting much yards after the catch from their receivers. Mariota and Winston are both getitng just 4.2 yards of YAC per completed pass, ranking them both in the bottom six of that metric. Wentz ranks 19th with 4.8 YAC per completion.

The graph below shows Air Yards per completed passes for each quarterback in the 2017 season on the X-Axis, and Yards After the Catch per completed passes on the Y-Axis. Mariota, Wentz, and Winston are all to the far right of the graph, of course: [continue reading…]

{ 5 comments }

Two guys who were pretty good at picking up first downs.

On Monday, I provided some initial thoughts on the relative values of completion and passing first down percentage. Yesterday, I looked at the difference between the 1972 and 2017 Jets when it came to those two metrics, along with a breakdown of every team’s passing performance so far in 2017.

Since passing first down percentage — which is simply the number of passing first downs a team gained divided by their pass attempts (including sacks) — is so important, I wanted to present a list of the top teams in NFL history using this metric. My data on first downs goes back to 1950, and since then, the top three teams all have something in common: Peyton Manning. The 2004 Colts picked up a first down on a whopping 44% of passing plays, the most in league history. That team is followed by the 2013 Broncos and the 2006 Colts, and the 2016 Falcons and 1984 Dolphins round out the top five. Here’s how to read the table below, which shows the top 200 passing offenses by this metric. The 2004 Colts completed 67% of their passes, had a sack rate of 2.6%, and 67.4% of their completed passes went for first downs. The final column is what the table is sorted by: the percentage of pass plays that went for a first down.

The table below shows the top 200 teams by this metric: by defaut, it only lists the top 20, but the table is fully sortable and searchable. [continue reading…]

{ 15 comments }

Back when passes were completed for first downs.

The New York Jets have the second best completion percentage in the NFL through five weeks.  That’s a shocking thing to say for many reasons, including the key fact that 38-year-old Josh McCown has taken every snap at quarterback for the team this season. The Jets are completing 71.6% of their passes, which is truly remarkable for this franchise.

Today I want to compare the 2017 Jets to their predecessors from 45 years earlier. The 1972 Jets were an interesting team.  That year produced a low key entry for the best Joe Namath season: he went 7-6 (missing one game due to injury) but led the NFL in passing yards, touchdowns, yards per attempt, Net Yards per Attempt, and Adjusted Net Yards per Attempt.  Namath was the best QB in the NFL that year, and was named a first-team All-Pro by the Pro Football Writers, the NEA, and Pro Football Weekly. [1]Namath was a 2nd-team choice by the AP, which went with Earl Morrall, 9-0 QB of the undefeated Dolphins, as their first-team choice. But it’s not controversial to say that Namath was the best … Continue reading But Namath completed just 50% of his passes that year, and as a team, the Jets completed just 49.6% of their passes.

It’s easy to look at the 2017 Jets with their 71.6% completion rate — a whopping 22 points higher than the ’72 squad — and conclude that, era adjustments aside, the 2017 Jets passing offense is more efficient. To be clear, era adjustments are enormously important when comparing passers across eras. You almost never want to compare players from different eras without making those adjustments. But today is the rare day where that’s not where I want us to focus. Because as discussed yesterday, completion percentage ignores two key elements of a passing game. [continue reading…]

References

References
1 Namath was a 2nd-team choice by the AP, which went with Earl Morrall, 9-0 QB of the undefeated Dolphins, as their first-team choice. But it’s not controversial to say that Namath was the best QB in the NFL that year, given that he led in ANY/A and won the majority vote for best QB, and also beat out Morrall in the organizations that made All-Conference (Sporting News and UPI) votes rather than All-Pro votes.  Of the five organizations that chose between Namath and Morrall, only one went with Morrall.
{ 31 comments }

Against the Saints in week four, Jay Cutler completed 20 of 28 passes for 164 yards, which translates to a sparkling 71.4% completion percentage. But that was about as misleading as it gets. Cutler also was sacked four times — a 12.5% sack rate — and several of those completions were pretty meaningless. In fact, Cutler threw just 7 first downs against New Orleans.

When you hear the 71.4% completion rate, you think: pretty good. You’d be wrong. Completion percentage ignores sacks (it shouldn’t), and it treats a completed pass for a first down the same as a completed pass for zero yards. On 32 dropbacks, Cutler threw just 7 first downs — a 21.9% rate that is more meaningful than his completion percentage. Why is it more meaningful? Well, the Dolphins were shutout against the Saints.

Want another example? Against the Redskins in week 3, Derek Carr completed 19 of 31 passes, for a nominally effective 61% completion rate. But Carr was also sacked four times (which, again, should be in the denominator when looking at completion percentage) and picked up just three first downs. Three! So while he completed 61% of his passes, Carr threw for a first down on only 9% of his pass plays against Washington.

How about from this weekend? In his first start of the year, Titans quarterback Matt Cassel completed 66% of his passes and produced a passer rating of 85.5 against Miami. That’s pretty good, right? Well, it isn’t when you have drives that like this that increase your completion percentage and passer rating:

Cassel was sacked six times on the day and threw for just 9 first downs. So while he was 21/32 on the stat sheet, he was also 9/38 at throwing for first downs, a very poor 24% rate. The Titans had 14 drives, and one of them was a 4-play drive for -3 yards that resulted in a field goal because it started at the Dolphins 24; the other 13 drives produced one touchdown, two fumbles, and ten punts. Tennessee lost, 16-10, despite Cassel completing 66% of his passes: or, maybe they lost because Cassel completed 66% of his passes playing that style.

A high completion percentage shouldn’t be any offense’s goal; instead, it feels like more and more quarterbacks (and offensive coordinators) are treating it like the ends and not the means.

The graph below shows completion percentage in the NFL (excluding the AFL) from 1950 through five weeks of 2017. That line is in blue and plotted against the Left Y-Axis; as you can see, it’s been increasing steadily over the last seven decades.  Plotted in orange and against the Right Y-Axis is the percentage of pass plays that have gone for first downs.  That’s also increasing, although it’s been a little bit bumpier. [continue reading…]

{ 6 comments }

In 5 years, one of Tom Brady, Peyton Manning, and Drew Brees will be the all-time leader in passing touchdowns. Currently, Manning is the passing touchdown king with 539 touchdowns, but will Brees or Brady catch him?

A year ago, I wrote about the fascinating touchdown race between Brady and Brees: at the end of the 2015 season, both had thrown 428 career touchdown passes. Last year, Brees threw 37 while Brady threw 28 in 12 games, so Brees is currently up 9 on Brady, 465-456.

But when I measured Brees and Brady last year, I measured them by calendar year. Both threw their first touchdown pass in 2001, so I thought a calendar year-by-year chart would be cool. But it probably makes more sense to compare the passers year-by-year by age, as I did yesterday with Brees and Manning for passing yards. That’s because Brees is about a year and a half younger than Brady (in turn, Brady is about a year and a third younger than Manning, but we haven’t compared them by calendar year).

So if we plot their passing touchdowns by age, Brees appears to have a huge leg up on Brady. That is, unless Brady plays until he’s 45: [continue reading…]

{ 107 comments }

Drew Brees and Spreading It Around

In 2016, Odell Beckham gained 34% of all Giants receiving yards, the highest share in the NFL. For 31 of 32 teams, at least one player gained 20% of their team’s receiving yards, but for the Bills, Robert Woods led the team in receiving despite being responsible for only 19% of Buffalo’s receiving yards.

But since Drew Brees came to the Saints in 2006, no team has spread it around more than New Orleans. On average, Brees’ leading receiving has been responsible for only 22% of the Saints receiving yards each year. The table below shows the average percentage of team receiving yards gained by the top receiver (RB, WR, or TE) for each team in each season over the last 11 years. The Falcons, buoyed by long runs of success by Roddy White and then Julio Jones, have been the most WR1-heavy passing game, while the Saints have been the most diverse: [continue reading…]

{ 14 comments }

If you’re short on time, let me save you a read: no.

And now for the long answer.

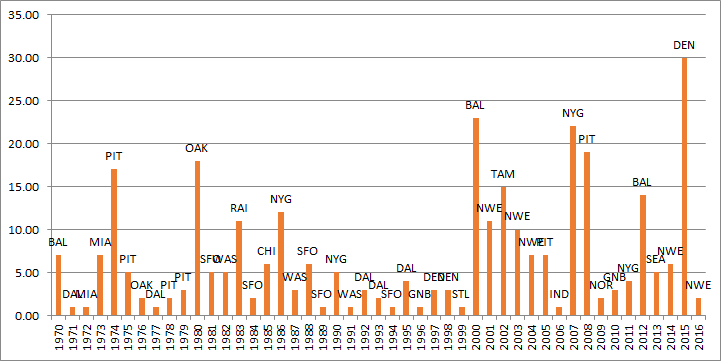
The graph below shows where each Super Bowl champion since the AFL/NFL merger ranked in Adjusted Net Yards per Attempt:

[continue reading…]

{ 34 comments }

Dan Fouts, and Winning vs. Stats Part 4

On Thursday, I looked at quarterbacks from 2016 who started at least 8 games and threw at least 150 passes. For those passers, I calculated how many standard deviations above average they were in Relative ANY/A (i.e., how much better they were, statistically, than average) and in winning percentage. I sorted the list by the difference between the two, to find the quarterbacks whose stats and winning percentages diverged by the largest amounts. And Friday, I looked at the quarterbacks whose passing stats most greatly exceeded their winning percentage in any given season.  On Saturday, I looked at the reverse: the quarterbacks whose winning percentages greatly exceeded their stats.

Today, let’s look at some career ratings.  One key note: This is a “career” rating but it excludes all seasons where a quarterback started fewer than 8 games, or threw fewer than 150 pass attempts.  So this excludes partial seasons, making it not a true snapshot of a player’s career, but rather a quarterback’s career as his team’s main starter.

The main leader here is Dan Fouts, and it’s not particularly close.  Over the course of his “career” — which spans 13 seasons as a starter with 150+ attempts — Fouts was a total of 13.8 standard deviations above average in ANY/A. However, he was barely above average in winning percentage, at just 0.23 standard deviations. Remember, Fouts had two top-30 seasons and four top-100 seasons in terms of his stats exceeding his record. As a result, his total “Diff” is 13.57, easily the most of any quarterback in this study, with Dan Marino, Boomer Esiason, and Drew Brees.

But since this is a cumulative stat, I wanted to also look at things on a per season basis.  So Fouts was, on average, 1.06 standard deviations above average in ANY/A, and just 0.02 in winning percentage, for an average difference of 1.04.  So is it better to sort the list based on cumulative difference, which is biased towards longevity, or average difference, which can be skewed by players who only played a few seasons? To combine the two ideas, I came up with a third column called Adj Diff.  That’s calculated by adding 6 seasons of average (i.e., 0.00) play to every player’s total diff, and re-calculating their average on a per-season (with 6 additional seasons) basis.  This helps blend both ideas, in my opinion.  If you have only a few seasons, 6 seasons of average play will drop you down significantly, but it also limits the value given to compilers.  Anyway, here’s the list: [continue reading…]

{ 51 comments }

2016 Playoff Passing Numbers

These two were the top passers of the 2016 postseason

With the 2016 postseason in the books, who were the best and worst passers? There are 11 playoff games every year, and since there were no games where a starting quarterback was injured or benched during the game, that gives us 22 quarterback performances to evaluate.

The best performance belongs to Matt Ryan against the Packers in the NFC Championship Game. Ryan threw for 392 yards with 4 TDs and 0 interceptions or sacks. That’s 472 Adjusted Net Yards and it came on 38 dropbacks, which translates to a 12.42 ANY/A average. His opponent, Green Bay, allowed 6.85 ANY/A to passers this year; that means over the course of 38 dropbacks, Ryan produced 212 Adjusted Net Yards of Value above average.

Using that methodology, here are the single game playoff passing numbers from the 2016 postseason: [continue reading…]

{ 22 comments }

The two leaders in ANY/A in 2016.

Matt Ryan and Tom Brady finished the season ranked 1st and 2nd in the NFL in Adjusted Net Yard per Attempt. How unusual is that?

  • In 1966, Bart Starr led the NFL in ANY/A and was the NFL MVP. Len Dawson led the AFL in ANY/A, and was the AFL’s first-team All-Pro selection at quarterback (running back Jim Nance was the MVP). The Packers and Chiefs met in the Super Bowl, of course, making it one of just two times that the Super Bowl featured two first-team All-Pro choices at quarterback. The other? Super Bowl III, featuring Earl Morrall and Joe Namath).
  • In 1971, Roger Staubach had a historically great season, producing a remarkable 7.81 ANY/A. The runner-up that year was Bob Griese, at 6.35, and no other passer was over 6.00. Those 1971 seasons from Staubach and Griese both ranked in the top 50 in my era-adjusted passer rating seasons, too. Alan Page was the AP MVP choice that year, Staubach won the Bert Bell Award for Player of the Year, and Griese won the third MVP, given by the NEA. So when the Cowboys and Dolphins met in the Super Bowl, it featured two MVP quarterbacks, a feat that could be matched this year. The PFWA has already named Ryan as its MVP, but the AP or the Bert Bell Award could choose Brady, which would give us another set of dueling MVPs.
  • In 1984 Dan Marino was a unanimous MVP (AP, NEA, PFWA, Bert Bell) on the back of a groundbreaking performance. His raw numbers (48 TDs, 5,084 yards) were remarkable, but so was his 8.94 ANY/A average. Joe Montana had a darn good year, too: his 49ers went 15-1 and his 7.93 ANY/A was 1.24 ANY/A better than any quarterback not named Marino. From an ANY/A dominance standpoint, it’s very similar to what Ryan and Brady have done this year.

[continue reading…]

{ 1 comment }
Next Posts Previous Posts