≡ Menu

Background reading:

Part I

Part II

Part III

Part IV

Part V (Career Passer Ratings)

In the interest of making all data available to you, the reader, the table below shows the averages for each professional football league since 1932 in the relevant passing statistics used to calculate passer rating: [continue reading…]

{ 9 comments }

With the 2016 season in the books, let’s take a look at the final ANY/A differential numbers. As regular readers know, ANY/A is simply yards per attempt that includes sack data and has a 20-yard bonus for passing touchdowns and a 45-yard penalty for interceptions.

ANY/A differential is one of the best measures of team play. This season, Atlanta very narrowly edged New England for the ANY/A differential crown.  No team finished in the top 8 of both offensive ANY/A and defensive ANY/A – a sign of how compressed the league was this season — but the Patriots were closest, ranking 2nd in offensive ANY/A and 9th in defensive ANY/A.  But because Atlanta had such a large lead in offensive ANY/A, the Falcons were number one in ANY/A differential even with the 18th best pass defense. [continue reading…]

{ 37 comments }

Carson Palmer’s Decline Has Been Severe

In 2015, Carson Palmer finished first in ANY/A, as did his Arizona Cardinals. It was a magnificent passing season for Palmer, who was 36 years old last season. In the offseason, I noted that it was a big outlier, but there were a couple of ways you could interpret the data:

If you’re a Palmer fan, the results here can both show how much of an outlier Palmer is, but also might be considered inspiring. Peyton Manning was really good at age 36 and then historic at age 37; Gannon and Steve Young had great years at 36, and then were even better at age 37. The same goes (with a slightly lower baseline) for John Elway, Kurt Warner, and Tom Brady. Supporting cast is undoubtedly a big part of this, and Palmer seems to be playing with one of the best ones. The wildcard in the room is how much his meltdown in the NFC Championship Game impacts him mentally.

The general rule of thumb, I think, for an older quarterback is to project them to be OK until they aren’t. What does that mean? Well, I think of Adam Harstad’s mortality tables. Just because a quarterback is old doesn’t mean he’s going to have a 5 or 10% decline: guys like Manning, Gannon, Young, Elway, Warner, Brady, and Brees are examples of that. But once that decline hits, it’s often severe and permanent. For now, though, Palmer is still one of the rare quarterbacks who had his best season at age 36.

Well, we have our answer. While teams like the Texans, Panters, and Jets have suffered notable declines in the passing game, all three teams are dwarfed by the decline in pass efficiency endured by the Cardinals this season: [continue reading…]

{ 22 comments }

Joe Flacco’s Career, My Graphic Novel

My favorite measure of quarterback play is Adjusted Net Yards per Attempt. For new readers, ANY/A is simply yards per attempt, but it includes sacks (both in the denominator and with those yards lost deducted from the numerator) and adjustments for touchdowns (20-yard bonus) and interceptions (45-yard penalty).

I am going to use a modified version of that formula today, by basing my formula around yards per dropback rather than yards per attempt. The only difference? Spikes are discarded, scrambles (and yards gained on scrambles) are included, but those are both improvements to the formula.

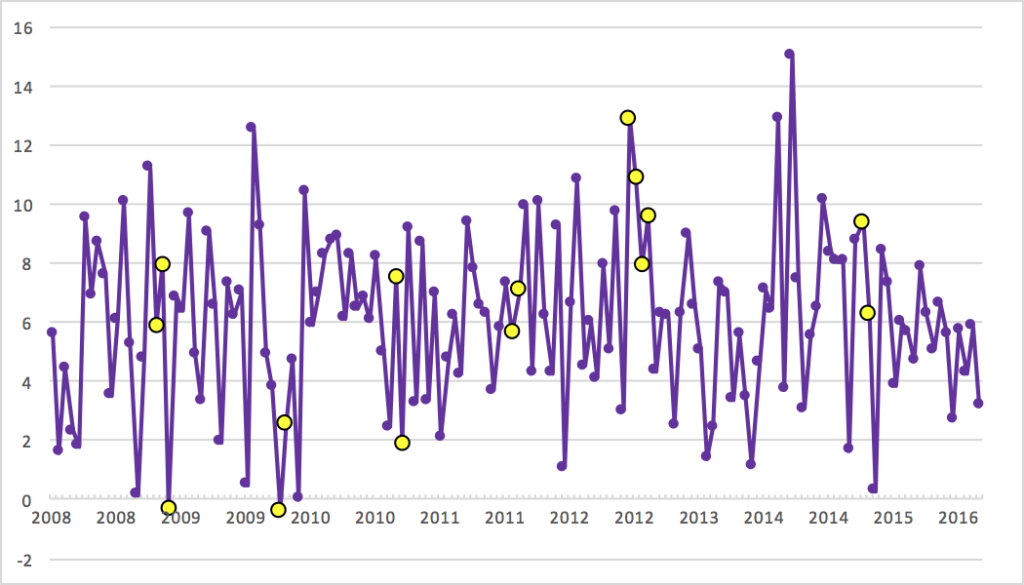
With that said, here is Joe Flacco‘s modified ANY/A average in every game of his career, plotted from his first game in week 1 of 2008 through week 7 of 2016.  I have made the data points that represent playoff games larger and in yellow.  The four dots next to each and relatively high on the graph represent, of course, his Super Bowl run in 2012.

flacco [continue reading…]

{ 9 comments }

For over two decades, the Green Bay Packers have been lucky to have a Hall of Fame quarterback. How good have things been? Well, last year was only the third time since 1994 that the Packers finished below league average in Adjusted Net Yards per Attempt. But in general, Aaron Rodgers is the best quarterback in the league, and the return of Jordy Nelson should ensure another stellar year for Rodgers.

When discussing Green Bay’s passing attack in the days since the merger, you get a pretty stark split between the pre-Favre/Rodgers eras and the post-Favre/Rodgers eras.  The graph below shows the Packers Relative ANY/A — i.e., the team’s Adjusted Net Yards per Attempt minus the league average ANY/A — in every year since 1970: [continue reading…]

{ 7 comments }

On average, passing yards is a pretty meaningless measure of quarterback play.  Consider that the winning team and the losing team in a game both generally throw for about the same number of yards. Last year, for example, winning teams averaged 258 gross passing yards per game, while losing teams averaged 259. In 2013, it was 253 for the winners, 251 for the losers. In 2012, it was 246 for the winners, 248 for the losers. Since 2000, winning teams have averaged about 5 more passing yards per game, thanks mostly to 2009 (244 for winning teams, 222 for losing) and 2014 (261/242) as big outliers.

Joe Flacco, for example, has averaged 233 passing yards per game in wins and 231 in losses. But just because the averages are close together doesn’t mean every quarterback follows this same formula. And two of the best examples of that are Nick Foles and Blake Bortles.

Foles has lost 17 games where he was the starting quarterback; in those games, his average stat line was 21/38 for 214 passing yards, 0.7 TDs and 1.1 INTs. He also has started and won 19 games; in those games, his average stat line was 19/30, for 258 passing yards, 2.1 TDs, and 0.4 INTs. That paints the picture of a guy who is much better in wins than losses, which makes a lot of sense.  (Also, 7 of his 17 losses have come during his ugly time with the Rams, compared to just 4 of 19 wins.) [continue reading…]

{ 4 comments }

Adjusted Completion Percentage

In 1991, Dave Krieg led the NFL in completion percentage. He completed a career-high 65.6% of his passes, and while that mark was very good for that era, it doesn’t mean Krieg was great that season. In fact, he arguably wasn’t even good: Krieg actually finished just 24th in ANY/A that year.

One reason, I think, that Krieg was able to lead the NFL in completion percentage is because Krieg “ate” a lot of his incomplete passes. What do I mean by that? Krieg took a ton of sacks — he was sacked every ten times he dropped back to pass. When under duress, some quarterbacks eat the ball, to avoid an interception; that’s bad (well, it’s better than n interception) but it doesn’t get graded that way when calculating completion percentage. Other quarterbacks will throw the ball away; that’s good (assuming it isn’t intercepted) because no yards are lost, but it does hurt the quarterback’s completion percentage.

Even ignoring the yards lost due to sacks, fundamentally, a sack is no better than an incomplete pass. So why are quarterbacks who take sacks rather than throw the ball out of bounds given an artificial boost when it comes to completion percentage? Well, that’s largely just an artifact of how the NFL always graded things. The NFL was not always good at recording metrics, and somewhere along the way, sacks were either included as running plays, ignored, or included as pass plays. I don’t think a lot of thought went into it, but in my view, it makes the most sense to include sacks in the denominator when calculating completion percentage. Otherwise, we give undue credit to quarterbacks that take a lot of sacks, and penalize quarterbacks who throw the ball away when under pressure. [continue reading…]

{ 35 comments }

Three years ago, I looked at the career leaders in 4th quarter (and overtime) game-winning touchdown passes. That post is ready for an update, and there’s been some interesting movement at the top of the charts.

As a reminder: tracking things like game-winning touchdowns is only interesting in a trivial sort way. I looked at all games, regular and postseason, in all leagues, from 1940 (and before 1940 for postseason games) to 2015, and counted all touchdowns scored that put the player’s team ahead for good (with one exception: I did not count touchdowns scored when down by 7 and the team successfully went for two afterwards). The table below shows all players with at least 4 such game-winning touchdown passes.

Incredibly, Johnny Unitas is still the record-holder in this category. In 23 games, Unitas threw a touchdown pass in the fourth quarter to win the game for the Colts. His first came against Washington in 1956, with his last coming 14 years later against the Bears. The table below provides a link to all 23 such fourth-quarter, game-winning touchdown throws by Unitas: [continue reading…]

{ 20 comments }

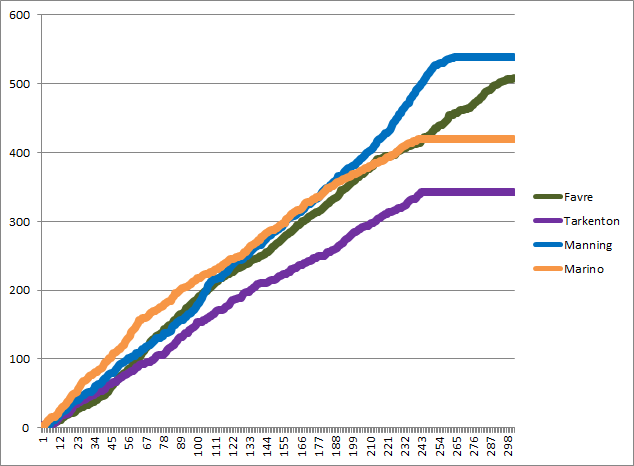
There have been four passing touchdown kings in the last 40 years: Fran Tarkenton, Dan Marino, Brett Favre, and Peyton Manning.  I thought it would be fun to plot the number of career touchdown passes each player had on the Y-Axis after each game of their career (shown on the X-Axis):

td pass leaders
[continue reading…]

{ 7 comments }

Tom Brady and Drew Brees ended the 2015 season in a pretty remarkable place: both have 428 touchdown passes, tied for the third most in NFL history.  Both threw their first touchdown pass in 2001, which makes it easy — and fun! — to compare the two players.  The graph below shows the number of career touchdown passes for each player over every week since 2001:

brady brees td

Brady took an early edge, both because he started earlier (he had 18 touchdowns in 2001; Brees had 1) and played better earlier (Brees had 28 touchdowns in ’02 and ’03 combined; Brady had that many just in ’03).  And, of course, Brady’s scorched-earth 2007 season helped see him take his biggest lead.  Consider that through 2007, Brees had thrown fewer than 30 touchdown passes in each of his first seven seasons. Since then? Brees has thrown more than 30 touchdowns in all eight seasons! [continue reading…]

{ 7 comments }

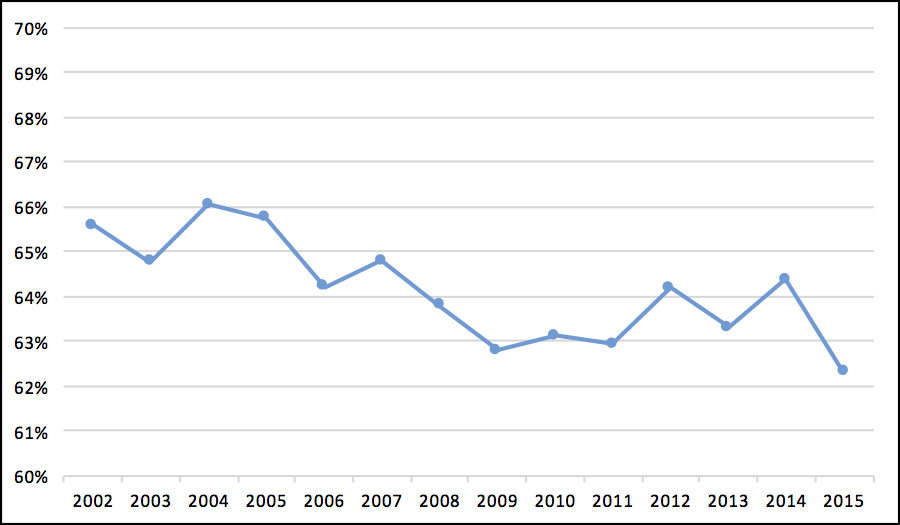
Some quick but interesting data dumps today. First, let’s take a look at receiving yards by wide receivers as a percentage of league-wide receiving yards in each year since 2002. In the early part of that era, wide receivers had about 2/3 of all receiving yards, but that number dipped to just 62% this year, the lowest during this period.

wr 2002 2015 [continue reading…]

{ 4 comments }

This pass probably wasn't completed.

This pass probably wasn’t completed.

In the NFC Championship Game, Carson Palmer was really bad.  He completed 23 of 40 passes for 235 yards, with three sacks that lost 8 yards.  That by itself is not very good — it translates to a 5.3 net yards per attempt average — but the real damage came when it comes to turnovers.  Palmer threw one touchdown againt four interceptions, giving him an Adjusted Net Yards per Attempt average of just 1.56.  And even that inflates things a bit, as Palmer also fumbled twice, with both fumbles being recovered by Carolina. On the season, Carolina allowed 4.46 ANY/A to opposing passers, the best in the NFL, so that does mitigate things a bit.  As a result, Palmer’s game is considered -125 ANY below expectation, because he was 2.9 ANY/A below expectation over 43 dropbacks.

That’s bad, but nowhere near as bad as the worst performance from even this year’s playoffs (Brian Hoyer) or the last Cardinals playoff loss (thank you, Ryan Lindley).  But the reason Palmer’s performance appeared so bad was precisely because it came from someone like Carson Palmer, and not a Hoyer or a Lindley.  Palmer, after all, was arguably the best passer in the NFL this season.  He led the NFL in Adjusted Net Yards per Attempt, at 8.11, which was 2.14 ANY/A better than league average. [continue reading…]

{ 33 comments }

This week at the New York Times, a look at how this season was, yet again, the best passing season in history:

First, a look at quantity. N.F.L. teams averaged 35.7 pass attempts per game, the most in league history, breaking the record of 35.4 set in 2013. Teams used those attempts to also set per-game records for completions (22.5) and passing yards (243.8). Passing touchdowns per game were also at a new N.F.L. high. The record had been 1.63 a game, set, remarkably, in 1948. The league had been inching toward that mark — teams averaged 1.57 and 1.58 passing touchdowns per game in 2013 and 2014 — before surpassing it with 1.64 passing touchdowns per game in 2015.

For the first time in N.F.L. history, 12 quarterbacks threw for 4,000 yards. In addition, 11 quarterbacks threw at least 30 touchdown passes; that breaks the record of nine set last season. Before 2014, no N.F.L. season had more than five quarterbacks with at least 30 touchdown throws.

You can read the full article here.

{ 4 comments }

Single-Season Passing Records in Jeopardy

With one game remaining, the NFL is having yet another record-breaking season through the air. Teams are averaging over 259 gross passing yards per game, which would break the record of 252, set last year. Teams are completing 63.1% of passes this year, which would break the record of 62.6%, also set in 2014. And teams are averaging 1.7 passing touchdowns per game, the first time in NFL history (it was 1.6 each of the last two years, and also in 1965).

As a result, a number of single-season franchise records are in jeopardy of falling this year, too, depending on what happens today. Let’s go through the list. [continue reading…]

{ 19 comments }

In 2014, the Denver Broncos ranked 4th in Adjusted Net Yards per Attempt; in case you forgot, Peyton Manning‘s “struggles” last year were really confined to the back end of the season. This year, the Broncos rank 31st in ANY/A, as Manning has been terrible and Brock Osweiler has been far below average. The Broncos ANY/A has dropped from 7.67 to 4.90, a decline of 2.77 ANY/A.

But that’s not even the biggest decline of 2015. Last year, the Dallas Cowboys ranked 2nd in ANY/A at 7.96; this year, without Tony Romo, the team is dead last at 4.76, for a decline of 3.20 ANY/A. Here is the full list of how passing offenses have improved/declined from 2014, which also shows why Carson Palmer is a pretty good choice for MVP: [continue reading…]

{ 7 comments }

With six teams on bye this week, that left 26 teams playing in week nine. Not a single one of the main quarterbacks for any of those teams averaged fewer than 4.00 Adjusted Net Yards per Attempt. That’s incredible: overall, quarterbacks this week averaged an insane 7.12 ANY/A. Take a look: the table below shows the passing stats from all 30 players who threw a pass in week 9. I have calculated the Adjusted Net Yards per Attempt for each player as well, along with their VALUE (ANY/A minus league average multiplied by number of dropbacks) provided relative to league average, with one catch: league average is 7.12. As a result, all of the quarterback grades feel a little depressed. [continue reading…]

{ 1 comment }

On Monday, I looked at the SOS-adjusted Adjusted Net Yards per Attempt ratings of every quarterback and defense in the NFL in 2014. And just like last year, I want to follow that post by looking at the best and worst games of the year, from the perspectives of both the quarterbacks and the defenses.

Let’s start with the top 100 passing games from 2014. The top spot belongs to Ben Roethlisberger, for his scorched-earth performance against Indianapolis. The Steelers star threw for 522 yards and 6 touchdowns on just 49 pass attempts with no sacks or interceptions. For the game, that means Roethlisberger averaged 13.10 ANY/A. The league-average last season was 6.13 ANY/A, which means Roethlisberger was 6.97 ANY/A above average. Now since the game came against a Colts team that was 0.28 ANY/A worse than average last year, we have to reduce that by the same number. That puts Roethlisberger at 6.70 ANY/A above expectation; multiply that by his 49 dropbacks, and he produced 328 adjusted net yards of value above average after adjusting for strength of schedule. That was easily the top game of 2014. [continue reading…]

{ 2 comments }

2014 Rearview Adjusted Net Yards per Attempt

Every year at Footballguys.com, I publish an article called Rearview QB, which adjusts the fantasy football statistics for quarterbacks (and defenses) for strength of schedule. I’ve also done the same thing for years (including last season) using ANY/A instead of fantasy points, which helps us fully understand the best and worst real life performances each year. Today I deliver the results from 2014.

Let’s start with the basics. Adjusted Net Yards per Attempt is defined as (Passing Yards + 20 * Passing Touchdowns – 45 * Interceptions – Sack Yards Lost) divided by (Pass Attempts plus Sacks). ANY/A is my favorite explanatory passing statistic — it is very good at telling you the amount of value provided (or not provided) by a passer in a given game, season, or career.

Let’s start with some basic information. The league average ANY/A for quarterbacks in 2014 was 6.13, the highest in NFL history. Aaron Rodgers led the way with a 8.65 ANY/A average, the highest rate in the league among the 39 quarterbacks who started at least five games. Since the Packers quarterback had 520 pass attempts and was dropped for 28 sacks, that means he was producing 2.52 ANY/A (i.e., his Relative ANY/A) over league average on 548 dropbacks. That means Rodgers is credited with 1,383 Adjusted Net Yards above average, a metric labeled “VALUE” in the table below. That was the most in the NFL last year: [continue reading…]

{ 12 comments }

Back in December 2009, Jason Lisk wrote about a recent trend in the NFL: quarterbacks throwing for 300 passing yards and actually winning. Jason wondered whether that was something fluky, or a sign of the shifting nature of the NFL. With the benefit of hindsight, I think the answer is…. well, I think it’s pretty clear.

Including playoffs, quarterbacks who threw for 300+ yards in a game during the 2009 season won an incredible 63.3% of games. And that mark remains the highest in modern history. Over the last five years (2010 to 2014), quarterbacks have won 52% of games when cracking that mark; during the decade of the ’90s, quarterbacks won 53% of their games when throwing for 300+ yards.

Of course, the likelihood of a quarterback throwing for 300+ yards has increased significantly. Over the last four years, quarterbacks have thrown for 300+ yards in 25% of all games, an enormous increase relative to most of NFL history. The graph below shows both pieces of information: in blue, and measured against the left Y-Axis, shows winning percentage by year when a quarterback throws for 300+ yards; in red, and against the right Y-Axis, is the percentage of all games where a quarterback hit the 300+ yard mark: [continue reading…]

{ 20 comments }

On Sunday, I calculated the average number of pass attempts (including sacks) per game for each season since 1950, and then looked at which were the highest era-adjusted passing games in football history. On Monday, I looked at the single seasons that were the most and least pass-happy, from the perspective of each quarterback and after adjusting for era. Today, career grades.

How much do you know about Frank Tripucka? Probably not that much. If you’re a younger fan, you might know him because Denver “unretired” his #18 when Peyton Manning came to town, or because his son Kelly played in the NBA.

If you’re a Football Perspective regular, you may recall that he was the first quarterback in pro football history to throw for 3,000 yards in a season. [1]And by first, I mean that in the most literal sense: in 1960, Tripucka, playing in the AFL and a 14-game season, crossed the 3,000 yard mark in the final game of the season. For Denver, that … Continue reading Well, after today, you’re never going to forget about Tripucka.

I looked at all quarterbacks who started at least 48 regular season games since 1950. [2]For quarterbacks who played prior to 1950, like Tripucka, they are included, but only their post-1950 stats are counted. As a reminder about the methodology, I then calculated the league average dropbacks per game (i.e., pass attempts + sacks) in each season. Then, I determined the number of dropbacks by each quarterback’s team in each game started by that quarterback.

Then, I compared that number to league average to determine the ratio. Do this for every game of a quarterback’s career, and viola, career ratings! Here’s how to read the table below. Tripucka started 50 games in his career since 1950. In those games, his teams averaged 38.5 dropbacks per game, while the league average was 31 dropbacks. As a result, Tripucka’s teams in games he started finished with 124% as many pass attempts as the average team, or 7.5 more attempts per game. That makes him the most pass-happy quarterback ever. The final column shows whether the quarterback is in, or very likely to wind up in, the Hall of Fame. [3]Note that I have included Peyton Manning, Tom Brady, Drew Brees, Brett Favre, Kurt Warner, and Aaron Rodgers as HOF quarterbacks for these purposes. This is not based on my subjective opinion … Continue reading [continue reading…]

References

References
1 And by first, I mean that in the most literal sense: in 1960, Tripucka, playing in the AFL and a 14-game season, crossed the 3,000 yard mark in the final game of the season. For Denver, that happened to be a Saturday. The next day, another AFL quarterback, Jack Kemp, crossed the 3,000-yard threshold with the Chargers. The AFL opened with a 14-game schedule to get a jump on the NFL, which was still playing a 12-game schedule in 1960. The NFL’s regular season ended at the same time, and Johnny Unitas became the first NFL passer to hit 3,000 yards on the same day as Kemp.
2 For quarterbacks who played prior to 1950, like Tripucka, they are included, but only their post-1950 stats are counted.
3 Note that I have included Peyton Manning, Tom Brady, Drew Brees, Brett Favre, Kurt Warner, and Aaron Rodgers as HOF quarterbacks for these purposes. This is not based on my subjective opinion of those players, but based on my subjective opinion of their likelihoods of enshrinement. If one was to sort by the HOF category, I thought it would be more useful to have them as a “Yes” than as a “No.” Your mileage may vary.
{ 25 comments }

Yesterday, we looked at which teams had the most pass attempts (including sacks) in individual games relative to league average. Today, we will analyze things on the season level.

Let’s use Tobin Rote as an example. As Brad Oremland noted, Rote was stuck playing for terrible Packers teams in the ’50s that were weak on defense and light at running back. In 1951, Green Bay ranked 12th in the 12-team NFL in rushing attempts, rushing yards, and rushing touchdowns, and 11th in points allowed and yards allowed. The Packers often went with just one running back in the backfield — a rarity in those days — which is a sign that the emphasis on the passing game wasn’t just a result of the team’s losing record. Green Bay also went with a quarterback-by-committee approach: Rote started 11 of 12 games, but he finished the year with 256 pass attempts, while backup Bobby Thomason had 221. Individually, neither had great numbers, but together, they helped Green Bay finish with 50 more pass attempts than any other team in football.

The method I used yesterday, and will be using throughout this series, is to give the starting quarterback credit for all team pass attempts in that game. The reason? If a quarterback gets injured and finishes a game with just 5 attempts, that will kill his average in a misleading way. That would do more harm, I think, than giving him credit for all attempts in the game. But that decision has its drawbacks, and in particular, it seems ill-suited for teams in the early ’50s that employed a QBBC approach. This is particularly relevant here, because “Rote’s” 1951 season checks in as the most pass-happy on our list.

So the Rote line for ’51 should really be thought of as Rote and Thomason. Rote’s 1956 season also makes the top ten, and there’s no fine print necessary there. Rote started 11 of 12 games and threw 308 passes, while Bart Starr started the remaining game and had just 44 attempts that season. The ’56 Packers were not very good, ranking last in both points and yards allowed, and last in rushing attempts, too.

The table below shows the top 300 seasons (minimum 7 games started) in terms of pass attempts relative to league average. You can use the search function to see that Rote’s season in 1954 with Green Bay also makes the cut. To explain what’s in the table below, let’s use season #15 on the list, Shane Matthews in 1999, as an example. That year, Matthews started 7 games, but in those games, the Bears averaged an incredible 47.1 dropbacks per game, the second highest rate ever. Matthews shared some snaps with rookie Cade McNown that year, so you wouldn’t know it just by looking at Matthews’ raw numbers, but the ’99 Bears were insanely pass-happy under Gary Crowton. The league average was 36.3 dropbacks per game, so the Bears in “Matthews games” were 10.8 attempts above average, and 129.8% above league average. [continue reading…]

{ 6 comments }

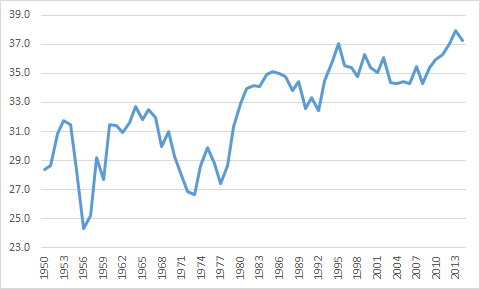
Let’s take a look at the league average dropbacks (pass attempts + sacks) per game for each year from 1950 to 2014.

dropback per game [continue reading…]

{ 22 comments }

You remember 1976, don’t you? Two teams — the Colts with Bert Jones and Roger Carr, and the Raiders with Ken Stabler and Cliff Branch — stood out from the pack when it came to pass efficiency that season. The Colts led the NFL in passing yards, ranked 2nd in passing touchdowns, and threw just 10 interceptions, tied for the fewest in the NFL. Oakland threw 33 touchdown passes — nine more than the Colts and 12 more than any other team in football — while ranking 3rd in passing yards. Both teams averaged 7.5 Net Yards per Pass Attempt, while every other team was below seven in that metric. Those two teams went a combined 24-4.

The next four best passing teams were St. Louis, Dallas, Minnesota and Los Angeles. Each of those teams went 10-4 or better. In fact, the linear relationship between pass efficiency and team record was quite strong that year. Take a look at the chart below, which plots Relative ANY/A — i.e., Adjusted Net Yards per Attempt relative to league average — on the X-Axis, and Winning Percentage on the Y-Axis: [continue reading…]

{ 21 comments }

A couple of years ago on the July 4th holiday, I looked at each team’s franchise nemesis in a number of statistics. Let’s revisit that, beginning today with passing yards and passing touchdowns.

You won’t be surprised to know that John Elway has thrown for more yards against the Chiefs, Chargers, Raiders, and Seahawks — his four division rivals — than any other player has gained against those four teams. Similarly, Dan Marino has thrown for more yards against the Bills, Jets, Patriots, and Colts than any other quarterback. Brett Favre threw for more yards than anyone else against the Lions, Bears, and Vikings (but not the Bucs), and Peyton Manning is the top nemesis for the Oilers/Titans franchise, the Jaguars, and the Texans.

Drew Brees is the big enemy of the Bucs, Panthers, and Falcons, while Ben Roethlisberger is the top passer against the Ravens, Bengals, and Browns. Perhaps more surprising is that Eli Manning has already thrown for more yards against Philadelphia, Washington, and Dallas than any other quarterback: that’s particularly surprising since he wasn’t #1 against any of those teams two years ago.

One that always kind of surprises me is seeing Johnny Unitas as number 1 against the 49ers, but it does make some sense. My guess is you could win quite a few bar bets with that one. Here’s the full list, which includes all passing yards thrown by each quarterback against each of the 32 teams (and includes playoff games): [continue reading…]

{ 6 comments }

NVB loved to go deep

NVB loved to go deep

During the 2013 season, I crunched the numbers to determine that Chris Johnson was the career leader in average length of rushing touchdown (since then, his average has dropped to 25.8, allowing Robert Smith to regain the top spot). Last year, I did the same analaysis to show that Homer Jones is the career leader in average length of receiving touchdown. Today, we look at the average length of passing touchdowns for over a hundred quarterbacks.

The table below shows the average and median length of touchdown passes for each quarterback with at least 125 career passing touchdowns. Playoff touchdowns are included in this data set. Norm Van Brocklin is your career leader, although it is Otto Graham who is the leader in median touchdown length; as such, the Van Brocklin/Graham debate must rage on. [continue reading…]

{ 17 comments }

Yards per Attempt is not as good as Net Yards per Attempt, which accounts for sacks, and it’s not as good as Adjusted Net Yards per Attempt when it comes to predicting wins, since that metric includes touchdowns and interceptions. But still, vanilla Yards per Attempt usually correlates decently well with winning teams. The emphasis here is on the word usually.

There were four teams that stood out from the pack in yards per attempt last year: while 28 teams averaged less than 8.0 Y/A, four team averaged 8.2, 8.3, or 8.4 yards per attempt. Those teams were Dallas, Green Bay, Pittsburgh, and…

Why don’t you try to guess the 4th team.

[Come on, give it a good try.]

[Wrong. Guess again.]

[Nope. One more guess.] [continue reading…]

{ 7 comments }

Previously on “take away his X [best/worst]” plays:

In April, I noted that you would need to take away Peyton Manning’s best 19 passes in order to bring his stellar Net Yards per Attempt average to below league average. Today, we look at the reverse question: How many of Derek Carr’s worst dropbacks would we need to erase to bring his NY/A above league average? I’ll give you a moment to think about the answer. [continue reading…]

{ 8 comments }

Last week, I looked at how many top carries needed to be removed in order to bring the best running backs below league average. Today, I want to do the same thing, but for quarterbacks, using pass attempts. [1]The same caveat from last time applies: because I used the play-by-play logs to conduct this exercise, there may be slight differences between the numbers in this table and the official numbers.

Aaron Rodgers averaged 7.7 net yards per attempt last year, the best rate in all of football. But as it turns out, he’s not the leader in this metric. You may be surprised to learn that one “only” needs to remove Rodgers’ 15 best pass plays to bring his NY/A average below the 2014 league average rate of 6.35. Meanwhile, you have to remove 19 of Peyton Manning’s top plays to bring his 7.5 NY/A average below league average. That’s because Rodgers’ ten best pass plays went for 642 yards, while Peyton Manning’s top ten pass completions gained 499 yards. [2]It also helped Manning’s cause that he had more dropbacks.

Regular readers know the drill; if you need more info on how to read the table, check last week’s post. The table below displays all quarterbacks who had at least 100 dropbacks last season and finished with a NY/A average above 6.35; the final column displays how many of each player’s top pass attempts need to be removed to bring his NY/A average below league average.

QuarterbackDBNetYdNY/ANum
Peyton Manning61446087.519
Ben Roethlisberger64247657.4215
Aaron Rodgers54742097.6915
Tony Romo46534657.4512
Drew Brees68747716.9410
Andrew Luck64345837.1310
Matt Ryan65844946.837
Philip Rivers60440856.766
Ryan Fitzpatrick33323897.176
Kirk Cousins21216407.746
Eli Manning62942276.724
Joe Flacco57438346.684
Brian Hoyer46331776.864
Mark Sanchez33022696.884
Tom Brady60539696.563
Andy Dalton50432826.512
Russell Wilson49232376.582
Drew Stanton25116456.552
Carson Palmer23315636.712
Nick Foles32120916.511
Zach Mettenberger19612746.51
Colt McCoy1459476.531

I’ll again leave the commentary to you guys.

References

References
1 The same caveat from last time applies: because I used the play-by-play logs to conduct this exercise, there may be slight differences between the numbers in this table and the official numbers.
2 It also helped Manning’s cause that he had more dropbacks.
{ 9 comments }

Guest Post: Touchdown Pass Vultures

Adam Steele is back for another guest post. And, as always, we thank him for that. You can view all of Adam’s posts here.


During the 2014 season, Chase noted that the league-wide touchdown pass rate was the highest it had been since the NFL merger. The final few weeks of the season dragged down the average a little bit, but 2014 still checks in as the most touchdown pass friendly year in NFL history. In response, a few commenters cited the possibility that teams were tallying more TD passes by sacrificing TD runs, which is a logical conclusion considering the very low rate of rushing touchdowns in 2014 (teams averaged 0.74 per game, the lowest since 1999). Today, I’m going to look into this further and see if teams really are inflating their passing TD numbers at the expense of the run.

First, we have to establish a historical baseline, and I did this by looking at every NFL season since 1950. [1]AFL numbers were not included. In that time frame, teams averaged 2.26 offensive touchdowns per game, with 1.35 of those coming via the pass and 0.91 via the run. Translated into a ratio, offensive touchdowns have historically been 59.6% passing and 40.4% rushing. That 59.6% is the key number here, as it will be the baseline ratio for expected passing touchdowns. Below is a chart containing relevant information for each year since 1950. The “PaTD %” column represents the percentage of offensive touchdowns in a given year that were scored via the pass, and the “Inflation” column compares that year’s passing TD ratio with the historical average of 59.6%.

YearPassTD/GRushTD/GOffTD/GPaTD %Inflation
20141.580.742.3268%14.1%
20131.570.82.3766.2%11.1%
19651.571.012.5760.9%2.2%
19631.540.972.5161.4%3%
19621.531.092.6258.5%-1.9%
19521.511.022.5359.7%0.2%
20121.480.782.2665.4%9.7%
20101.470.782.2565.3%9.6%
19581.471.222.6954.5%-8.5%
19541.471.062.5258.1%-2.5%
20111.460.782.2465.1%9.2%
19871.450.862.3162.9%5.5%
19611.451.052.558.2%-2.4%
19671.450.982.4259.7%0.1%
19691.440.882.3262.1%4.2%
20041.430.812.2463.8%7%
19641.420.992.4158.9%-1.2%
19601.421.032.4557.9%-2.9%
19501.411.332.7451.4%-13.7%
20071.410.752.1665.1%9.2%
19831.40.982.3758.9%-1.2%
19511.391.222.653.3%-10.5%
20091.390.842.2262.3%4.6%
19951.380.82.1863.3%6.2%
19841.370.922.2960%0.7%
19981.370.792.1663.5%6.5%
19681.370.92.2760.4%1.4%
19591.371.12.4755.3%-7.1%
20021.360.92.2560.1%0.9%
19801.350.962.3158.4%-1.9%
19991.340.732.0764.7%8.6%
19851.330.992.3257.4%-3.6%
19661.330.952.2958.3%-2.1%
19811.320.982.357.3%-3.9%
19531.311.172.4952.8%-11.4%
19861.310.92.259.4%-0.4%
19961.30.762.0663.2%6.1%
19941.30.762.0663.2%6%
19891.30.872.1760%0.7%
19971.290.82.0961.6%3.4%
19901.280.842.1360.4%1.4%
20011.280.742.0263.5%6.6%
20001.280.832.1160.6%1.7%
20031.280.832.1160.5%1.5%
19821.270.922.1958.1%-2.5%
20061.270.832.0960.4%1.4%
20081.260.932.1957.6%-3.4%
20051.260.842.159.9%0.5%
19551.251.152.452%-12.7%
19881.240.952.1956.7%-4.8%
19791.21.092.2952.5%-11.9%
19751.191.132.3251.2%-14.1%
19571.181.12.2851.7%-13.3%
19701.170.81.9859.3%-0.5%
19931.150.681.8363%5.7%
19921.150.741.960.8%2%
19911.140.81.9458.8%-1.3%
19561.131.242.3747.5%-20.3%
19721.1112.1152.6%-11.7%
19761.11.062.1651.1%-14.3%
19711.070.911.9853.9%-9.6%
19781.041.012.0650.8%-14.8%
19731.040.911.9553.4%-10.4%
19741.0312.0450.7%-14.8%
19770.990.91.8952.4%-12%

As you can see, 2014 really did feature highly inflated passing TD totals, with 68.0% of offensive touchdowns coming through the air. This trend began in 2010, stabilized for four years, then jumped again significantly last season. The most obvious explanation is that teams are now passing more in general, so it would follow that they would also pass more to score touchdowns. But that’s only part of the story, as the rate of passing touchdowns has far outstripped the rate of overall called passes.

The main culprit appears to be goal line play selection, which has heavily favored the pass in recent seasons. Interestingly, from 1997-2009, there was no trend whatsoever, with passing TD ratios jumping around randomly from season to season. From 1980-1994, passing TD ratios were slightly lower, yet still very random. Even during the dead ball era of the 1970s, when the rules made passing far more difficult than it is today, teams still scored more often with passes than they did with runs. In fact, the famous 1956 season was the only time in the last 65 years where teams scored more rushing touchdowns than passing touchdowns.

But here’s what fascinates me the most: Despite the huge increases in total yardage and passing efficiency in recent years, offensive touchdowns have increased very little. In 2014, teams scored only 0.06 more offensive touchdowns than the historical average. In fact, the top 15 seasons for offensive TD production all came before the merger! If the NFL had been playing a 16 game schedule in the ’50s and ’60s, TD pass totals would be very similar to what we see today, and rushing TD totals would be higher.

So how does all this affect touchdown records for various quarterbacks? Since the 16 game schedule began in 1978, there have been 51 teams who scored at least 50 offensive touchdowns in a given season. Of those 51 teams, 33 of them had passing TD ratios above the historical average of 59.6%. In this chart, I list the primary QB, although the numbers represent team totals. The “Adjusted Pass TD” column is calculated by multiplying offensive touchdowns by .596, calculating how many TD passes would have been thrown by sticking with the historical average ratio. The “Change” column represents the difference in adjusted TD passes compared to actual TD passes, basically measuring how many TD pass were vultured from the run game.

YearTeamQBPassTDRushTDOffTDPaTD%Adj PaTDChangeInflation
2013BroncosManning55167177%42-1330%
2007PatriotsBrady50176775%40-1025.2%
1984DolphinsMarino49186773%40-922.7%
2011PackersRodgers51126381%38-1335.8%
2000RamsWarner37266359%381-1.4%
2011SaintsBrees46166274%37-924.5%
2004ColtsManning51106184%36-1540.3%
199849ersYoung41196068%36-514.7%
199449ersYoung37236062%36-13.5%
1981ChargersFouts34266057%362-4.9%
2012PatriotsBrady34255958%351-3.3%
1983RedskinsTheismann29305949%356-17.5%
1998VikingsCunningham41175871%35-618.6%
1998BroncosElway32265855%353-7.4%
2004ChiefsGreen27315847%358-21.9%
2011PatriotsBrady39185768%34-514.8%
2001RamsWarner37205765%34-38.9%
1985ChargersFouts37205765%34-38.9%
2010PatriotsBrady37195666%33-410.9%
1980CowboysWhite30265654%333-10.1%
2006ChargersRivers24325643%339-28.1%
2003ChiefsGreen24325643%339-28.1%
1986DolphinsMarino4695584%33-1340.4%
1999RamsWarner42135576%33-928.1%
2014BroncosManning40155573%33-722%
1991BillsKelly39165571%33-619%
2009SaintsBrees34215562%33-13.7%
199349ersYoung29265553%334-11.5%
1988BengalsEsiason28275551%335-14.6%
2008SaintsBrees34205463%32-25.7%
2005SeahawksHasselbeck25295446%327-22.3%
2012SaintsBrees43105381%32-1136.2%
2014CowboysRomo37165370%32-517.2%
2009VikingsFavre34195364%32-27.7%
198449ersMontana32215360%3201.3%
2004ChargersBrees29245355%323-8.2%
2002ChiefsGreen27265351%325-14.5%
2014PackersRodgers38145273%31-722.6%
1983CowboysWhite31215260%3100%
2014ColtsLuck4295182%30-1238.2%
2013EaglesFoles32195163%30-25.3%
2007ColtsManning32195163%30-25.3%
1985BengalsEsiason31205161%30-12%
1991RedskinsRypien30215159%300-1.3%
199249ersYoung29225157%301-4.6%
2000RaidersGannon28235155%302-7.9%
2011LionsStafford4195082%30-1137.6%
2007CowboysRomo36145072%30-620.8%
2003PackersFavre32185064%30-27.4%
1985DolphinsMarino31195062%30-14%
2009PackersRodgers30205060%3000.7%

I have plenty of thoughts about this chart, but I’m more interested to see what the readers think. Does this analysis change your opinion of any of these great QB seasons?

References

References
1 AFL numbers were not included.
{ 12 comments }

Quarterbacks and Passing Milestones

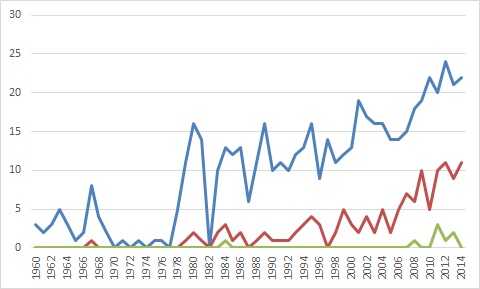
The first 3,000 yard passer came in 1960, when Johnny Unitas reached such feat in the NFL and Jack Kemp and Frank Tripucka did so in the AFL. Joe Namath became the first 4,000-yard passer seven years later, and Dan Marino in 1984 was the first to reach 5,000 yards.

The graph below shows the number of 3,000 yard passers in blue, 4,000-yard passers in red, and 5,000-yard passers in green in each season since 1960.  As you can see — and no doubt already knew — passing productivity is on the rise:

YardPassers [continue reading…]

{ 11 comments }
Next Posts Previous Posts