≡ Menu

Guest Post: Are Interceptions Overrated?

Guest contributor Adam Steele is back again. You can read all of Adam’s articles here.


Are Interceptions Overrated?

There’s nothing worse than throwing an interception. Everyone seems to agree on this, from fans to media to advanced stats guys. But is it really true? In this quick study, I looked at the tradeoff between interception avoidance and aggressive downfield passing to see which strategy has a larger impact on winning. To measure this, I created two categories of quarterbacks: Game Managers and Gunslingers.

First, the Game Managers, which includes all post-merger quarterback seasons with an INT%+ of at least 110 [1]Which means the player was at least 0.67 standard deviations better than league average at avoiding interceptions. and a NY/A+ of 90 or below (min 224 attempts). [2]Which means the player was at least 0.67 standard deviations worse than league average in net yards per attempt. These guys avoided picks but failed to move the ball efficiently, the hallmark of a conservative playing style.

[continue reading…]

References

References
1 Which means the player was at least 0.67 standard deviations better than league average at avoiding interceptions.
2 Which means the player was at least 0.67 standard deviations worse than league average in net yards per attempt.
{ 27 comments }
Ryan  Lindley imploded against the Panthers in the Wildcard Round

Ryan Lindley imploded against the Panthers in the Wildcard Round

Ryan Lindley had a very, very bad day against the Carolina Panthers on Saturday. He completed 16 of 28 passes for just 82 yards, with one touchdown and two interceptions. He was also sacked four times and lost 31 yards. Assigning 20 yards per passing touchdown and -45 per interception, and including the sack data, this means Lindley produced -19 adjusted net yards. Given his 32 dropbacks, that translates to a -0.59 ANY/A average.

Which, of course, is really bad. The fact that it came in the most pass-friendly era in history makes it look even worse, although that’s slightly tempered by the fact that the Panthers have an above-average defense. We can combine the era- and SOS-adjustments in one step by noting that Carolina allowed 5.84 ANY/A to opposing passers this year. As a result, this means Lindley fell 6.45 ANY/A short of what we would expect, given the Panthers defense and this era. Over the course of 32 dropbacks, that means Lindley produced 206 Adjusted Net Yards below expectation.

Using that methodology for every playoff game since 1950, Lindley’s mark is the 9th worst in playoff history. The worst? That belongs to Kerry Collins in Super Bowl XXXV. Here’s how to read the table below. Collins averaged -2.19 ANY/A against the Ravens over the course of 43 dropbacks; the Baltimore defense, of course, was very good against the pass, allowing just 3.88 ANY/A. Still, that means Collins fell 6.07 ANY/A short of expectation. Over 43 dropbacks, that’s -261 ANY below what we would expect given the Ravens defense, the worst ever.

One final note: in the table below, you can click on the “Year” cell for each player to go to the boxscore for that game. [continue reading…]

{ 13 comments }

A massively disappointing quarterback and Josh  McCown

A massively disappointing quarterback and Josh McCown

Passer rating is a stupid stat. But my interest in trivia trumps my disdain for passer rating, so let’s move on.

Josh McCown had a passer rating of 109.0 last year, the third best in the NFL in 2013. With one game left in the 2014 season, McCown has a passer rating of 70.5, and he is in a tight three-way race with Geno Smith and Blake Bortles to see who finishes the season with the worst passer rating. Update: McCown had a passer rating of 70.0 in week 17, and finished the year with a 70.5 passer rating. A decline of 38.5 points in a quarterback’s passer rating is enormous, but not unprecedented. In fact, eight other players (minimum 200 pass attempts both years) have seen larger declines:

#8) Daunte Culpepper (2004-2005)

In 2004, Culpepper set an NFL record with 5,123 yards of total offense.  I wrote about Culpepper’s great ’04 season and his subsequent decline at the PFR blog back in 2007, and I maintain that Culpepper was a very underrated quarterback during his time in Minnesota.  In 2004, he finished with a passer rating of 110.9; the next year, his final with the Vikings, he threw 6 touchdowns against 12 interceptions in seven games, before an ACL year ended his season.  He finished with a 72.0 passer rating, representing a 38.9 point drop from his lofty ’04 standard. [continue reading…]

{ 6 comments }

Number one in our hearts

Number one in our hearts

Aaron Rodgers has thrown for 3,652 yards and 35 touchdowns on his 416 pass attempts this year. He has throw just three interceptions, although he has taken 26 sacks for 156 yards. Do the math, and Rodgers is averaging 9.19 Adjusted Net Yards per Attempt this year. Through 14 weeks, the NFL average is 6.24 ANY/A, which means Rodgers is averaging 2.95 ANY/A better than average. Over the course of his 442 dropbacks, this means Rodgers has produced 1,303 yards of Adjusted Net Yards of Value over average.

ANY/A leaves much to be desired as the end-all, be-all measure of quarterback play, but it’s simple, easy to understand, and works well for historical comparisons. At the end of the year, I will produce an SOS-adjusted version of the statistic, but today, I just wanted to take a quick look at the leaderboard. There are a few surprises, after the very expected result at the top of the list. [continue reading…]

{ 4 comments }

NFL Passing, 1950 Through Week 13, 2014

In case you haven’t noticed, 2014 is on pace to become the greatest passing season in NFL history. Which may not be surprising, since just a few months ago, the three best passing seasons in NFL history were the 2012, 2011, and 2013 seasons. Falling into fifth place will be the… 2010 NFL season. So passing numbers are on the rise, but you already knew that.

Through week 13 of the 2014 season, the NFL average Adjusted Net Yards per Attempt — defined as gross passing yards, plus 20 yards for every touchdown pass, minus 45 yards for every interception, and minus sack yards, all divided by the total number of pass attempts plus sacks — was at 6.26.  Most passing statistically typically take a trip south in December (and prior to SNF, the week 14 average was 5.85), but 6.26 would be a significant outlier even in our high-flying times. The graph below shows the NFL average ANY/A for each season since 1950.  Of course, we are doing a bit of apples-to-oranges comparisons by using full season numbers for all years and through-13-weeks numbers for 2014, but so be it: [continue reading…]

{ 11 comments }

Dalton was scary bad last night.

Dalton was scary bad last night.

Last night, Andy Dalton was not very good. completed 10 of 33 passes for 86 yards, while throwing 0 touchdowns and 3 interceptions. Add in his two sacks for 14 yards, and Dalton averaged -1.80 ANY/A. That’s terrible, of course, but how bad does that measure historically? Let’s use the same methodology we did when calculating how good Ben Roethlisberger was against the Colts. Against every other passer this year, the Browns had allowed 5.58 ANY/A to opposing players. As a result, Dalton finished 7.38 ANY/A below expectation.

Over the course of his 35 dropbacks, that means Dalton provided -258 adjusted net yards of value relative to expectation. That’s bad — really bad — but it only ranks as the 83rd worst performance since the merger. The table below shows the 150 worst games since 1970, although for 2014, I have only included Dalton’s game (so Geno Smith and his bad performances could make the list, but I didn’t have time to calculate — feel free to do so in the comments!). [continue reading…]

{ 13 comments }
The braintrust.

The braintrust.

The Jets passing offense being bad does not qualify for news.  However, the Jets passing offense and passing defense combining for historically inept numbers? Sure, that qualifies.

New York has thrown 8 touchdown passes this year against 11 interceptions. That’s a -3 differential which is pretty bad.  Only two other teams have negative ratios this year: the Jaguars, also at -3 (11 TDs, 14 INTs), and the Vikings at -5 (6/11).  But the Jets pass defense has allowed 24 touchdowns while forcing just 1… ahem, ONE… interception.  That +23 ratio for opposing quarterbacks is better than any offense this year (the Broncos are at +19 (24/5), and the Patriots and Steelers are both at +20 with matching 23/3 TD/INT ratios).

From the perspective of the Jets defense, though, that +23 reverses to a -23.  Add to that the -3 from the offensive side of the ball, and New York’s combined TD/INT ratio from both units is an incredibly bad -26.

How bad? It’s tied for the 2nd worst number through 9 games since 1970, just narrowly behind the 1975 Cleveland Browns. Those Browns began the year with 3 passing touchdowns and 17 interceptions through nine games. Okay, that was even bad for the dead ball era, but what about the defense? Cleveland allowed 19 passing touchdowns while forcing just six interceptions during that stretch! Those numbers led to an 0-9 start under first-year head coach Forrest Gregg.

The table below shows all teams to start the season with at least a -20 ratio in this statistic I just made up. Here’s how to read the line from the famous 1944 Card/Pitt combination, forced together due to World War II. Through nine games, that team threw 8 touchdowns and 40 interceptions (-32), while allowing 19 passing touchdowns and intercepting just 15 passes (-4), for a total score of -36. [continue reading…]

{ 1 comment }

Adam Steele is back for his third guest post in his Marginal YAC series.


In my two previous two posts, I introduced Marginal YAC and Marginal Air Yards. Today, I’m posting the career mYAC and mAir for the 96 quarterbacks with at least 1,000 pass attempts from 1992-2013. There’s a lot of data here, so I’ll let the readers do most of the commentary.

Here is a table of career Marginal YAC. The “Per 300” column is the rate of mYAC per 300 completions, or roughly equivalent to one full season. And on a “per season” basis, no quarterback benefited more from YAC than Steve Young, who also had four top-40 seasons. [continue reading…]

{ 1 comment }

In early September, Adam Steele, a longtime reader and commenter known by the username “Red” introduced us to his concept of Marginal Yards after the Catch. Today is Part II to that post. Adam lives in Superior, Colorado and enjoys digging beneath quarterback narratives to discover the truth; hey, who can blame him?


Introducing Marginal Air Yards

There are three components of Y/A: Completion %, Air Yards/Completion, and YAC/Completion. In my last post I looked at YAC, so today, let’s look at the other two components. By multiplying completion percentage and air yards per completion, we get air yards per attempt, which we can then modify to create Marginal Air Yards (mAir):

mAir = (Air Yards/Attempt – LgAvg Air Yards/Attempt)*Attempts

Here are the yearly Air Yard rates since 1992, with the table sorted by Air Yards per Attempt:: [continue reading…]

{ 15 comments }

500 touchdown passes

No one is more prolific at touchdowns than Manning

No one is more prolific at touchdowns than Manning.

Yesterday, Peyton Manning threw four touchdown passes against Arizona. In the process, he joined Brett Favre as the only players in NFL history to throw 500 career touchdown passes. In previewing that game, Mike Tanier noted that it would require us to travel back to 1987 to collect 500 Cardinals touchdown throws.

Naturally, that made me wonder how far back we would have to go to calculate the last 500 touchdown passes for each franchise. The four most recent expansion franchises — Houston, Jacksonville, Carolina, and Baltimore — have yet to throw even 400 touchdown passes. For Manning, of course, he’s thrown 500 passes beginning in the 1998 season. That’s better than any franchise in the NFL; the closest team would be the Packers. To count 500 Green Bay touchdown throws, you would need to start on November 23, 1997. Beginning on that date, Favre would throw another 269 touchdowns for the Packers, Aaron Rodgers would chip in with 200, and a handful of other Green Bay players would combine for 31 scoring throws. [continue reading…]

{ 38 comments }

In the third quarter on Monday night, I texted my Patriots fan buddy Matt, “Is it possible that we suck? Maybe the run is finally over.” Bill Barnwell mused on this, and Aaron Schatz also wrote about it. It was hard not to think that, given the way the Patriots were manhandled by a mediocre team playing without several key players. It looked every bit as bad as the 41-14 score and maybe worse.

I remember the last time I wondered if the Pats were done. In a 34-14 loss to the Browns in 2010, the Patriots looked pretty impotent. In that game, as in the Chiefs one, the Pats had just under 300 yards of offense. Peyton Hillis ran over the Patriots. Of course, that wasn’t the end. Maybe this time is different, though. If anything the Chiefs game was even worse, so it’s possible this time really is the end. [1]And those Pats were 6-1 at the time of the loss to the Browns.

Will the Patriots offense be good later this year? To provide a little insight into this, I went back and looked at performance trends for quarterbacks who have had long careers. The first table looks at quarterbacks since 1969 who have the biggest single-season drops in adjusted net yards per attempt (ANY/A) from the previous five year trend. I look just at quarterbacks with at least 100 attempts in a season and I weight by the number of attempts when calculating the average ANY/A over the previous five years.

[continue reading…]

References

References
1 And those Pats were 6-1 at the time of the loss to the Browns.
{ 20 comments }

Just above these words, it says “posted by Chase.” And it was literally posted by Chase, but the words below the line belong to Adam Steele, a longtime reader and commenter known by the username “Red”. And I thank him for it. Adam lives in Superior, Colorado and enjoys digging beneath quarterback narratives to discover the truth; hey, who can blame him? One other house-keeping note: I normally provide guest posters with a chance to review my edits prior to posting. But due to time constraints (hey, projecting every quarterback in the NFL wasn’t going to write itself!), I wasn’t able to engage in the usual back and forth discussion with Adam that I’ve done with other guest posters. As a result, I’m apologizing in advance if Adam thinks my edits have changed the intent of his words. But in any event, sit back and get ready to read a very fun post on yards after the catch. When I envisioned guest submissions coming along, stuff like this is exactly what I had in mind.


Introducing Marginal YAC

A quarterback throws a two yard dump off pass to his running back, who proceeds to juke a couple defenders and run 78 yards into the endzone. Naturally, the quarterback deserves credit for an 80 yard pass. Wait, what? Sounds illogical, but that’s the way the NFL has been keeping records since 1932, when it first began recording individual player yardage totals. The inclusion of YAC — yards after the catch — in a quarterback’s passing yards total can really distort efficiency stats, which in turn may distort the way he is perceived.

In response, I created a metric called Marginal YAC (mYAC), which measures how much YAC a quarterback has benefited from compared to an average passer. Its calculation is very straightforward:

mYAC = (YAC/completion – LgAvg YAC/completion) * Completions

I have quarterback YAC data going back to 1992 for every quarterback season with at least 100 pass attempts. [1]This data comes courtesy of sportingcharts.com. It’s obviously unofficial, but there doesn’t seem to be any noticeable biases from one team to another. Some unofficial stats, such as … Continue reading That gives us a healthy sample of 965 seasons to analyze, and includes the full careers of every contemporary quarterback. But first, let’s get a sense of what’s average here. The table below shows the league-wide YAC rates since 1992: [continue reading…]

References

References
1 This data comes courtesy of sportingcharts.com. It’s obviously unofficial, but there doesn’t seem to be any noticeable biases from one team to another. Some unofficial stats, such as passes defensed or quarterback pressures, can vary wildly depending on the scorekeeper, but Sporting Charts’ YAC stats seem pretty fair, from what I can tell. Here is a link to the 2013 data. Chase note: I have not had the chance to compare these numbers to what is on NFLGSIS, but that’s a good idea.
{ 23 comments }

A couple of years ago, I asked how long it should have taken the Jaguars to move on from Blaine Gabbert. Today I want to revisit that general idea, but look at how long it takes the best quarterbacks to identify themselves as top-tier players. A couple of months ago, I looked at the greatest quarterbacks of all time. Using the top 75 quarterbacks from that list, I removed any player whose career began before the merger; that left me with 42 passers.

First, I looked at how each quarterback fared in relative Adjusted Net Yards per Attempt — i.e., ANY/A relative to league average — through their first 16 starts. Just over two-thirds of these passers were above average during their first 16 starts, with 1/3 of those quarterbacks being at least 1 ANY/A better than league average.  That group of fourteen quarterbacks — which Aaron Rodgers just falls shy of joining — can be categorized as above-average quarterbacks from the beginning. They are Kurt Warner, Dan Marino, Daunte Culpepper, Chad Pennington, Tony Romo, Mark Rypien, Jeff Garcia, Boomer Esiason, Ben Roethlisberger, Philip Rivers, Matt Ryan, Joe Montana, Steve McNair, and Ken Stabler. Obviously a number of those quarterbacks were not immediate starters in the NFL, but they did excel as soon as they became starters.

The graph below shows each of the 42 quarterbacks’ Relative ANY/A through their first 16 starts. The X-Axis represents the quarterback’s first year, and the Y-Axis shows their RANY/A value through 16 starts.

QB breakout 1

Now, let’s remove the 14 quarterbacks who had a RANY/A of at least +1.0 through their first sixteen starts. How did the other 28 quarterbacks fare in starts 17 through 32 in RANY/A? Eleven of them produced a RANY/A of at least +1.0 in their next sixteen starts: Bert Jones, Matt Schaub, Ken Anderson, Peyton Manning, Aaron Rodgers, Brad Johnson, Carson Palmer, Jim Everett, Steve Young, Dan Fouts, and Steve Grogan.

[continue reading…]

{ 24 comments }

The past couple of days, we looked at the players with the most receiving yards and rushing yards in their final 16 regular season games. Today, we get to the quarterbacks.

Only one non-active player threw for 4,000 yards in his final 16 games.

Trivia hint Show


Click 'Show' for the Answer Show

Three other players threw for 3900+ yards. That doesn’t include Dan Fouts (3,805) or Dan Marino (3,869), but it does include quarterbacks from the great, the good, and the ugly category.

Trivia hint 1 Show


Trivia hint 2 Show


Click 'Show' for the Answer Show

Trivia hint 1 Show


Trivia hint 2 Show


Click 'Show' for the Answer Show

Trivia hint 1 Show


Trivia hint 2 Show


Click 'Show' for the Answer Show

{ 4 comments }

Smith struggled as a rookie; then again, so did many greats

Smith struggled as a rookie; then again, so did many greats.

In 2013, Geno Smith had the worst passer rating (66.5) in the NFL. The year before, Mark Sanchez had a passer rating of 66.9, which was very nearly the lowest in the league (Matt Cassel had a rating of 66.7). But while the Jets didn’t quite do it, a couple of teams have managed to have different quarterbacks in consecutive seasons finish with the lowest passer ratings in the NFL (minimum 14 attempts per game).

In 2000, a second-year Akili Smith was given the starting job and posted a miserable 52.8 passer rating. A year later, Jon Kitna took over for the Bengals, and his 61.1 rating was the worst among qualifying passers.

In 1993, Mark Rypien finished with the worst passer rating in the league two years after winning the Super Bowl. Washington drafted Heath Shuler the following year, and as a rookie, Shuler finished with the worst passer rating in the NFL.

The Seahawks almost pulled off this feat in the prior two years. In 1992, Stan Gelbaugh had the worst passer rating as part of the historically inept Seattle passing attack. In 1991, Jeff Kemp finished with the worst passer rating in the league. Kemp, the son of Jack , started the year with Seattle but finished it with Philadelphia. He didn’t have enough attempts with the Seahawks to qualify, so I probably wouldn’t include the ’91-’92 Seahawks in this category, although that may be pickin’ nits.

The table below shows the quarterbacks to finish with the lowest passer rating in the NFL in each year since the merger. For each passer, I’ve included his age as of September 1st of that season, his traditional metrics, and his passer rating. [continue reading…]

{ 21 comments }
The top passing game of 2013

The top passing game of 2013.

Yesterday, I analyzed the 2013 passing numbers for strength of schedule. Today, we look at the best and worst games of the year, from the perspectives of both the quarterbacks and the defenses.

Let’s start with the top 100 passing games from 2014. The top spot belongs to Philadelphia’s Nick Foles, for his monstrous performance against Oakland. Foles threw for 406 yards and 7 touchdowns on just 28 pass attempts. Even including his one one-yard sack, Foles averaged a whopping 18.79 ANY/A in that game. The league-average last season was 5.86 ANY/A, which means Foles was 12.93 ANY/A above average. Now since the game came against the Raiders, we have to reduce that by -1.29, which was how many ANY/A the Raiders defense was below average. So that puts Foles at +11.64; multiply that by his 29 dropbacks, and he produced 337 adjusted net yards of value above average after adjusting for strength of schedule. That narrowly edges out the other seven-touchdown game of 2013, which came at the hands of Peyton Manning against Baltimore on opening night.

The third spot goes to Drew Brees in a week 17 performance against Tampa Bay. The 4th best game of 2013 was a bit more memorable: Tony Romo takes that prize in a losing effort, the insane week five shootout against Manning and the Broncos (Peyton’s performance checks in at #32). The table below shows the top 100 games of 2013, although for viewing purposes, it displays only the top 10 by default (all tables, as usual, are fully searchable, expandable, and sortable). [continue reading…]

{ 16 comments }

These two men look important

The two best regular season quarterbacks of all time?

Yesterday, I explained the methodology behind the formula involved in ranking every quarterback season since 1960. Today, I’m going to present the career results. Converting season value to career value isn’t as simple as it might seem. Generally, we don’t want a player who was very good for 12 years to rank ahead of a quarterback who was elite for ten. Additionally, we don’t want to give significant penalties to players who struggled as rookies or hung around too long; we’re mostly concerned with the peak value of the player.

What I’ve historically done — and done here — is to give each quarterback 100% of his value or score from his best season, 95% of his score in his second best season, 90% of his score in his third best season, and so on. This rewards quarterbacks who played really well for a long time and doesn’t kill players with really poor rookie years or seasons late in their career. It also helps to prevent the quarterbacks who were compilers from dominating the top of the list. For visibility reasons, the table below displays only the top 25 quarterbacks initially, but you can change that number in the filter or click on the right arrow to see the remaining quarterbacks. [1]Note that while yesterday’s list was just from 1960 to 2013, the career list reflects every season in history, using the same methodology as used in GQBOAT IV.

Here’s how to read the table. Manning’s first year was in 1998, and his last in 2013. He’s had 8,740 “dropbacks” in his career, which include pass attempts, sacks, and rushing touchdowns. His career value — using the 100/95/90 formula [2]And including negative seasons. is 12,769, putting him at number one. His strength of schedule has been perfectly average over his career; as a reminder, the SOS column is shown just for reference, as SOS is already incorporated into these numbers (so while Tom Brady has had a schedule that’s 0.25 ANY/A tougher than average, that’s already incorporated into his 10,063 grade). Manning is not yet eligible for the Hall of Fame, of course, but I’ve listed the HOF status of each quarterback in the table. Note that I only have quarterback records going back to 1960; therefore, for quarterbacks who played before and during (or after) 1960, only their post-1960 record is displayed. In addition, SOS adjustments are only for the years beginning in 1960. [continue reading…]

References

References
1 Note that while yesterday’s list was just from 1960 to 2013, the career list reflects every season in history, using the same methodology as used in GQBOAT IV.
2 And including negative seasons.
{ 109 comments }
Can you spot the GOAT?

Can you spot the GOAT?

In 2006, I took a stab at ranking every quarterback in NFL history. Two years later, I acquired more data and made enough improvements to merit publishing an updated and more accurate list of the best quarterbacks the league has ever seen. In 2009, I tweaked the formula again, and published a set of career rankings, along with a set of strength of schedule, era and weather adjustments, and finally career rankings which include those adjustments and playoff performances.  And two years ago, I revised the formula and produced a new set of career rankings.

This time around, I’m not going to tweak the formula much (that’s for GQBOAT VI), but I do have one big change that I suspect will be well-received.  Let’s review the methodology.

Methodology

We start with plain old yards per attempt. I then incorporate sack data by removing sack yards from the numerator and adding sacks to the denominator. [1]I have individual game sack data for every quarterback back to 2008. For seasons between 1969 and 2007, I have season sack data and team game sack data, so I was able to derive best-fit estimates for … Continue reading To include touchdowns and interceptions, I gave a quarterback 20 yards for each passing touchdown and subtracted 45 yards for each interception. This calculation — (Pass Yards + 20 * PTD – 45 * INT – Sack Yards Lost) / (Sacks + Pass Attempts) forms the basis for Adjusted Net Yards per Attempt, one of the key metrics I use to evaluate quarterbacks. For purposes of this study, I did some further tweaking. I’m including rushing touchdowns, because our goal is to measure quarterbacks as players. There’s no reason to separate rushing and passing touchdowns from a value standpoint, so all passing and rushing touchdowns are worth 20 yards and are calculated in the numerator of Adjusted Net Yards per Attempt. To be consistent, I also include rushing touchdowns in the denominator of the equation. This won’t change anything for most quarterbacks, but feels right to me. A touchdown is a touchdown.

Now, here comes the twist.  In past year, I’ve compared each quarterback’s “ANY/A” — I put that term in quotes because what we’re really using is ANY/A with a rushing touchdowns modifier — and then calculated a value over average statistic after comparing that rate to the league average. For example, if a QB has an “ANY/A” of 7.0 and the NFL average “ANY/A” is 5.0, and the quarterback has 500 “dropbacks” — i.e., pass attempts plus sacks plus rushing touchdowns — then the quarterback gets credit for 1,000 yards above average. [continue reading…]

References

References
1 I have individual game sack data for every quarterback back to 2008. For seasons between 1969 and 2007, I have season sack data and team game sack data, so I was able to derive best-fit estimates for each quarterback in each game. For seasons between 1960 and 1969, I gave each quarterback an approximate number of sacks, giving him the pro-rated portion of sacks allowed by the percentage of pass attempts he threw for the team.
{ 41 comments }

A Passing League

In some ways, the premise of this post is geeky even for this site. And that’s saying something. There is a debate over the proper way to measure league average. For example, when we say the average completion percentage in the NFL is 61.2%, this is generally assumed to reflect the fact that in 2013, there were 18,136 passes thrown in the NFL, and 11,102 of them were completed.

An alternative method of measuring completion percentage in the NFL is take the average completion percentage of each of the 32 teams. That number won’t be very different, but it won’t be identical, either. The difference, of course, is that this method places the same weight on each team’s passing attack when determining the league average. The former, more common method, means that the Cleveland Browns make up 3.755% of all NFL pass attempts and the San Francisco 49ers are responsible for only 2.299% of the league-average passing numbers. The latter method puts all teams at 3.125% of NFL average.

Wow, Chase, is this really a football blog? Two paragraphs on calculating the average in a data set? Believe it or not, that background presents an interesting way to look at how the NFL has become more of a passing league.

For example, let’s look at the 1972 season. Miami led the NFL in points scored and in rushing attempts, while ranking 24th out of 26 teams in pass attempts. Does this mean the Dolphins weren’t a good passing team? Of course not; in fact, Miami had the highest Adjusted Net Yards per Attempt average of any team that season! That year,only two teams threw over 400 passes: New England and New Orleans. And both teams were below-average in ANY/A, with the Patriots ranking in the bottom three.

In 1972, the average pass in the NFL gained 4.28 Adjusted Net Yards.  But an average of each team’s ANY/A average was 4.34, because good passing teams like Miami and Washington passed less frequently than bad passing teams like New England and New Orleans.  The league-wide average was only 98.5% of the “average of the averages” average; whenever that number is less than 100%, we can conclude that the better passing teams are passing less frequently.

Fast forward 39 years. In 2011, three teams topped the 600-attempt mark: Detroit, New Orleans, and New England. Tom Brady’s Patriots and Drew Brees’ Saints ranked in the top three in ANY/A (and the Lions in the top 7), while Aaron Rodgers’ top-ranked Packers in ANY/A still finished above average in pass attempts. The Tim Tebow Broncos were last in pass attempts, and in the bottom ten in ANY/A. The Jaguars, who finished last in ANY/A by a large margin, were in the bottom five in pass attempts, too, as Maurice Jones-Drew led the league in rushing. In 2011, the league-wide average ANY/A was 5.90, while the “average of the 32 teams” ANY/A was 5.85; that’s because the best passing teams were throwing more frequently than the worst passing teams (the ratio here was 100.8%). [continue reading…]

{ 15 comments }
Chris Berman has already copyrighted Teddy 'Bridge over troubled' Water.

Chris Berman has already copyrighted Teddy 'Bridge over troubled' Water.

Sometimes, it’s hard to believe that it’s 2014. With draft season now in full gear, I wanted to take a few minutes and look at the stats of the top college quarterbacks from last year. Unfortunately, that’s easier said than done. I couldn’t find a site that presented a full list of all college quarterback stats, including sacks, which is, of course, insane.

College football records sacks as rushing plays for the offense; as a result, knowing how many sacks Johnny Manziel or Teddy Bridgewater took last year is not that easy to find. So here’s what I did:

1) Using team game log data, I found the number of sacks for each defense in each game.

2) Next, I recorded the percentage of team pass attempts recorded by each quarterback for his offense in each game (usually close to 100%).

3) I synched up these two sets of data, and multiplied each quarterback’s percentage of team pass attempts by the number of sacks by his opponent’s defense in that game.

That provided me with some useful estimated sack data. From there, I calculated each quarterback’s Adjusted Net Yards per Attempt average, which is simply (Gross_passing_yards + 20*PassTDs – 45*INTs – Estimated_sack_yards_lost) / (Pass_attempts + Estimated_sacks). I did this for the 140 quarterbacks with the most pass attempts in the FBS (sorry, Jimmy Garoppolo fans) in 2013.

Since the number of pass attempts vary wildly at the college level, I also calculated a Value Over Average statistic. The 140 quarterbacks had an average ANY/A of 6.44, so the Value metric (which is what the table is sorted by) is simply (ANY/A – 6.44) * (Pass_attempts + Estimated_sacks). Here’s how to read Bridegwater’s line, the Louisville quarterback who many believe will be the first quarterback selected in the draft.

Bridgewater provided the 5th most passing value by this formula, completing 303 of 427 passes for 3,970 yards with 31 touchdowns and 4 interceptions. He took 25.5 sacks and lost 185 yards, and had a sack rate of 6% (if I included the percent sign, the table would not sort correctly). Bridgewater also averaged 13.1 yards per completion and had a 9.34 ANY/A average, which combined with his number of dropbacks, means he added 1,310 adjusted net yards of value over average. By default, the table below only shows the top 25, but you can sort and/or search to find each of the 140 quarterbacks (and you can change the number of quarterbacks displayed via the dropdown box to the left). [continue reading…]

{ 7 comments }

Terry Bradshaw finished his career with 212 touchdowns, 210 interceptions and a 70.9 passer rating. Kurt Warner threw 208 touchdowns against only 128 interceptions, and his 93.7 passer rating ranks 8th in NFL history and 2nd among retired players. But Bradshaw played from 1970 to 1982, while Warner played from 1998 to 2009. As a result, comparing their raw statistics holds very little meaning. Comparing across eras is very challenging, but not impossible. And in this case, once you place the numbers in the proper context, Bradshaw’s numbers were arguably more impressive than Warner’s numbers.

Let’s start with Bradshaw and begin by looking at his Relative ANY/A for each year of his career. For new readers, ANY/A stands for Adjusted Net Yards per Attempt, defined as

(Gross Pass Yards + 20 * PTDs – 45 * INTs – Sack Yds)/(Attempts + Sacks)

Relative ANY/A simply compares a quarterback’s ANY/A average to league average, a necessary element when comparing quarterbacks across eras. In the graph below, the size of the bubble corresponds to how many attempts Bradshaw had in each season, while the Y-Axis shows Bradshaw’s Relative ANY/A (by definition, 0 is equal to league average).  The graph shows a clear story: for the first five years of his career, Bradshaw was a below-average quarterback, but over the rest of his career, he was one of the best in football. His best year came in 1978 when Bradshaw finished with a RANY/A of +2.0, which was the third best mark in football (only a hair behind Roger Staubach and Dan Fouts). Those stats, combined with a 14-2 record, led to Bradshaw being named the AP’s MVP that season. [continue reading…]

{ 41 comments }

Smith against the Bucs

Smith looks to go deep against the Bucs.

We were very spoiled last year. Andrew Luck, Robert Griffin III, and Russell Wilson had outstanding rookie seasons in 2012, and perhaps that set expectations a bit high for the 2013 class. No one will confuse those three with EJ Manuel, Geno Smith, and Mike Glennon, all of whom struggled for most of their rookie seasons. But while Smith and Glennon didn’t produce excellent numbers, they produced very interesting ones.

Among the 35 quarterbacks with the most pass attempts, Glennon finished a very pedestrian 27th in Adjusted Net Yards per Attempt. But he did it in a very unique way: Glennon had an outstanding 19/9 touchdown-to-interception ratio, but he ranked dead last in Net Yards per Attempt. One reason for that is Glennon averaged only 10.6 yards per completion, the 3rd worst average among the 35 passers.

Smith finished 34th in ANY/A, largely due to his horrific 12/21 TD/INT ratio. He was a bit better in NY/A, ranking 28th, but what’s interesting about the Jets quarterback is that he ranked 7th in yards per completion. That metric is not a particularly effective measure of passer quality — after all, Matt Ryan ranked 35th — but it is a pretty good way to describe a quarterback’s style. While both Glennon and Smith were below average, they were below average in very different ways. [continue reading…]

{ 10 comments }

Superman wears #12 in Indianapolis now.

Superman wears #12 in Indianapolis now.

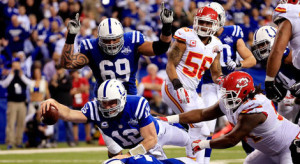
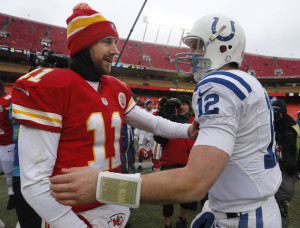
The NFL playoffs began in very entertaining fashion in Indianapolis. The Chiefs lost Jamaal Charles on the first drive of the game to a concussion, but stormed out to a 38-10 lead. Then the Colts pulled off the second greatest comeback in NFL history, eventually winning 45-44. The much-maligned Alex Smith had the game of his life, finishing 30 of 46 for 378 yards, with 4 touchdowns and no interceptions while also rushing for 57 yards.

Of course, Andrew Luck had an incredible game, too, even if it wasn’t necessarily as efficient. Luck went 29/45 for 443 yards and 4 touchdowns to counter his 3 interceptions, rushed for 45 yards, and recovered a Donald Brown fumble and ran it in for the touchdown.

Which made me wonder: where does this game rank among the greatest quarterback battles? To make life simpler, I’m only going to look at passing statistics, although obviously both players added some value on the ground. Smith averaged 9.23 Adjusted Net Yards per Attempt, defined as (Passing Yards + 20*TD – 45*INT – Sack Yards) divided by (Pass Attempts + Sacks). The NFL average in 2013 was 5.87 ANY/A, which means Smith produced 3.36 ANY/A over average. And, since he had 48 pass attempts (including sacks), that means Smith provided 161 yards over average.

Luck’s averages were hurt by the three interceptions, but he still produced 8.23 ANY/A and therefore 2.41 ANY/A over average. That means, over his 46 dropbacks, he produced 111 yards of value over average. So where does that mean this game ranks among all playoff games since 1970? My initial thought was to simply add the two value over average numbers, but that ended up producing a list dominated by great games by one quarterback. To counter this, I decided to only look at games where both quarterbacks were above average and to instead take the Harmonic Mean of their values. This wound up producing a pretty good list, and it places Luck/Smith at #9. [continue reading…]

{ 5 comments }

On Friday, I explained the idea behind Playoff Leverage. That post is required reading before diving in today, but the summary is that the Super Bowl counts for more than the conference championship games, which count for more than the division round games, which count for more than the wild card games. The value that is assigned to each game — the Super Bowl is currently worth 3.14 times as much as the average playoff game — is then used to adjust the stats of the players in those games.

For quarterbacks, the main stat used to measure passing performance is Adjusted Net Yards per Attempt. In case you forgot, ANY/A is defined as

[math]Pass Yards + 20*PassTDs – 45*INTs – SackYards)/(Attempts + Sacks)[/math]

Today, we’re going to look at every quarterback since 1966. Players like Bart Starr and Johnny Unitas who played before 1966 will count, but their stats from 1965 and earlier will not be included. This obviously is a serious disservice to Starr in particular, but for now, I’m going to only focus on the Super Bowl era. [continue reading…]

{ 11 comments }

No, Peyton, you're the man

No, Peyton, you're the man.

In 1984, Dan Marino set an NFL record with 48 touchdown passes, but his Dolphins lost in the Super Bowl. Twenty years later, Peyton Manning broke Marino’s record, but he lost to the eventual Super Bowl champion Patriots in the playoffs. In 2007, Tom Brady broke Manning’s touchdowns record, but he lost in the Super Bowl, too.

When the greatest quarterback seasons of all time are discussed, these three years dominate the discussion. And with good reason. But if you include the playoffs — and frankly, there’s no reason not to include the playoffs — which quarterback produced the greatest season of all time? I’m going to stipulate that the greatest quarterback season ever has to end in a Lombardi Trophy, because otherwise, I think we’ll end up back in the world of Marino ’84/Brady ’07/Manning ’04. Of course, now another Manning season has entered the mix: and with a Super Bowl win, Manning’s 2013 should and would be remembered as the greatest quarterback season of all time.

So, the question becomes, which season would he knock off the top rung? I think there are six seasons that stand out from the rest, based on regular and postseason performance.

Honorable Mention [continue reading…]

{ 14 comments }

Kansas City Chiefs (11-5) (Pick’em) at Indianapolis Colts (13-3), Saturday 4:35PM ET

The Chiefs have the talent edge, but the Colts have one big advantage

The Chiefs have the talent edge, but the Colts have one big advantage.

Among the four games this weekend, this one figures to be the most competitive: I would be surprised if this isn’t a one possession game in the fourth quarter. The Colts rank 13th in Football Outsiders DVOA, courtesy of the 13th-ranked offense, the 16th-best defense, and the 17th best special teams. Kansas City is 7th overall, thanks to a 15th-place ranking on offense, a 9th-place ranking on defense, and the top special teams in the NFL. And while the Colts beat the Chiefs two weeks ago, I don’t put much stock in that for a couple of reasons.

One, the Chiefs were missing two key players, left tackle Branden Albert and pass rusher Justin Houston. Two, I suspect that Kansas City called a very vanilla game plan in the first meeting. The Chiefs knew that Indianapolis was the likely first round opponent in the playoffs, and a win would have been meaningless for Kansas City unless Denver would lose to either Houston or Oakland. In retrospect, had the Chiefs kept their cards close to the vest (a luxury the Colts couldn’t afford), it would have been wise. [continue reading…]

{ 2 comments }

2013 Team NY/A and ANY/A Differential Data

Just a quick data dump here for those inquiring minds. Here are the leaders in NY/A differential, which is simply Net Yards per Attempt (which incorporates sack data) for each team minus the Net Yards per Attempt allowed by that team. Seattle ranks #1 in NY/A differential, as Russell Wilson‘s offense has averaged 6.97 NY/A (which ranks 6th) and the defense has allowed just 4.85 NY/A (which ranks first), giving them a +2.13 NY/A differential.

RkTmNY/ANY/A RkNY/A ANY/A A RkNY/A Diff
1Seattle Seahawks6.9764.8512.13
2Cincinnati Bengals6.7295.0921.63
3Denver Broncos7.8316.22171.61
4New Orleans Saints7.1545.5871.56
5Arizona Cardinals6.51115.5560.96
6Philadelphia Eagles7.4236.56220.86
7San Francisco 49ers6.53105.6890.86
8Pittsburgh Steelers6.39125.88100.51
9San Diego Chargers7.5427.1310.44
10Carolina Panthers5.9205.550.39
11Detroit Lions6.8286.53200.29
12New York Giants5.91195.6380.28
13Green Bay Packers6.9476.79250.15
14Buffalo Bills5.44295.2930.15
15New England Patriots6.12156110.12
16Chicago Bears7.0356.93270.1
17Cleveland Browns5.53275.4940.05
18Tennessee Titans6.13146.2215-0.08
19Indianapolis Colts6.07166.4219-0.35
20Houston Texans5.65256.0513-0.4
21Kansas City Chiefs5.69246.214-0.51
22Miami Dolphins5.47286.0312-0.56
23Dallas Cowboys6.37136.9829-0.62
24New York Jets5.56266.318-0.73
25Baltimore Ravens5.38306.2216-0.84
26Minnesota Vikings5.81216.6723-0.86
27St. Louis Rams5.77226.7524-0.98
28Oakland Raiders5.93186.9728-1.04
29Atlanta Falcons6.04177.1132-1.08
30Washington Redskins5.74237.0830-1.35
31Jacksonville Jaguars5.36316.8126-1.45
32Tampa Bay Buccaneers5.03326.5421-1.51

[continue reading…]

{ 8 comments }

Buffalo just sacked Tannehill again

Buffalo just sacked Tannehill again.

Did you happen to notice the stat line produced by Ryan Tannehill last week? He completed just 10 of 27 passes for only 82 yards in a 19-0 loss to the Bills. A 37% completion rate and a 3.0 yards per attempt average are ugly numbers in their own right, but Tannehill was also sacked seven times for 46 yards. That means on 34 dropbacks, he produced…. 36 yards.

Tannehill did not throw an interception in the 19-0 shutout, so perhaps that’s why this game has gone under the radar. But a quarterback does not get to fare so poorly and avoid coverage of it at Football Perspective. Can you imagine if Tony Romo or Jay Cutler had a game like this? Why aren’t people talking about this? Tannehill averaged One Net Yard per Attempt over THIRTY FOUR DROPBACKS!?! Tannehill’s NY/A average dropped from 5.72 to 5.46, an unheard of drop this late in the season.

To be fair, Tannehill’s lack of interceptions does make the performance less horrible. But today, I want to just focus on yards produced on pass attempts (including sacks). Lots of good quarterbacks have had bad days when it comes to interceptions, but how often does a quarterback struggle so much on nearly every play for 34 plays?

Let’s provide some context. This season, the average pass play (including sacks) has produced 6.217 net yards, which means you would expect 34 dropbacks to produce 211.4 yards. That means Tannehill’s performance produced 175.4 net yards under average. Among quarterbacks with at least 15 pass attempts in a game, that’s the 25th worst performance since 1960, and the 7th worst performance since 2000.

The table below shows the worst 250 performances since 1960, although the only game I calculated for 2013 was Tannehill’s. The worst performance using this formula goes to Green Bay’s Lynn Dickey in 1981 against the Jets in week 16. He completed just 12 of 33 passes for 96 yards (I’ve included the TD and INT numbers even though they are not part of the calculation), and was sacked an incredible 9 times for 57 yards (Mark Gastineau, Joe Klecko, and Marty Lyons each had multiple sacks). So on 42 dropbacks, Dickey gained 39 yards, for an average of 0.9 NY/A. The NFL average that season was 6.02 NY/A, which means Dickey produced 214 Net Yards below average.
[continue reading…]

{ 9 comments }

How quaint: a quarterback taking snaps form under center

How quaint: a quarterback taking snaps form under center.

With one game remaining, Peyton Manning has already set the new single-season record with 51 passing touchdowns (two months ago, I projected Manning to finish the season with 52 touchdowns). But all records must be viewed in their environment, and NFL teams are averaging 1.58 touchdown passes per team game this year, the highest average since 1948. In 1984, the year Dan Marino threw 48 touchdowns, teams averaged 1.37 touchdown passes per game.

So which season is more impressive? That’s a complicated question, and one that could be answered in many ways. In my view, the question boils down to which performance was more outstanding; in mathematical terms, we could define that as which season was farthest from the mean.

To make life a little simpler, I’m going to analyze this question on the team level, meaning we will compare “Denver 2013” to “Miami 1984.” Of course, this approach is preferable in many ways, since when we praise Manning we really mean “Manning with his offensive line and his coaching staff throwing to Demaryius Thomas, Wes Welker, Eric Decker, and Julius Thomas.” And “Marino in 1984” means “Marino and Mark Clayton and Mark Duper and Dwight Stephenson and Ed Newman.”

This season, the Broncos have 51 touchdown passes. The other 31 teams (through 15 games) are averaging 22.8 passing touchdowns, which means Denver is 28.2 touchdowns above average. The standard deviation of the 32 teams in passing touchdowns is 7.4; as a result, we can say that the Broncos are 3.84 standard deviations above average, also known as their Z-score.

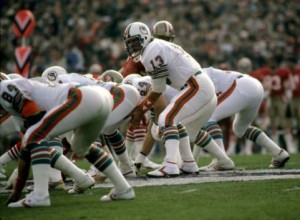
In 1984, the other 27 teams (through 16 games) averaged 21.0 touchdowns, while the Dolphins threw 49 scores (Jim Jenson, a college quarterback who played receiver for Miami, threw a 35-yard touchdown to Duper against the Patriots off a Marino lateral). The standard deviation that season in touchdown passes at the team level was 7.5, which gives Miami a Z-score of 3.72 in 1984.

So the Broncos this season have been more extraordinary, at least by this measure. One nice thing about using the Z-score is we don’t need to adjust for games played. I went ahead and calculated the Z-scores for every team since 1932. The current Broncos are #1, with the ’84 Dolphins in second place. The third place team isn’t the Tom Brady 2007 Patriots; that team is down at #7, because the standard deviation in passing touchdowns among the league’s 32 teams was 8.8 that season. Instead, the third slot goes to the 1986 Dolphins. Few remember that Marino threw 44 touchdowns that season; add in Don Strock’s two touchdowns, a lower league average and a smaller standard deviation, and those Dolphins get a Z-score of 3.70.

Let’s look at the top 100 teams using this metric. The 2004 Colts ranked fifth (if you click on the cell in the team column, the link takes you to that team’s PFR page) in Z-score. That year, Indianapolis threw 51 touchdowns, while the other 31 teams averaged 21.97 touchdown passes. That means Indianapolis was 29.03 touchdowns above average, the highest production above average to date. But that year, the standard deviation among the 32 teams in passing touchdowns was 8.53, giving the Colts a Z-score of “only” 3.41; that’s why they’re 5th, not first.
[continue reading…]

{ 38 comments }

Eli Manning in elite INT territory

After a five-interception performance against a dominant Seattle pass defense, Eli Manning now has 25 interceptions this season. The odds are extremely low, but it’s not impossible that he throws ten more interceptions and ties the modern record set by Vinny Testaverde in 1988. That year, a 25-year-old Testaverde threw 35 interceptions when the league average interception rate was 3.91%. Since Testaverde threw 466 passes that season, we could say that a league-average quarterback would have thrown 18.2 interceptions; therefore, Testaverde threw 16.8 interceptions over average that year.

So far in 2013, the average interception rate is just 2.70%. Since Manning has thrown 485 passes, we would expect a league-average passer to record 13.1 interceptions. With 25 interceptions, that puts Manning at 11.9 interceptions above average. The table below shows the top 100 leaders in interceptions over average since 1950. [continue reading…]

{ 10 comments }
Next Posts Previous Posts