≡ Menu

Analyzing every Joe Flacco interception this year

Flacco has had more downs than ups this year

Flacco has struggled to regain his Super form.

Over the course of his six-year career, Joe Flacco has generally done an excellent job at avoiding interceptions. Remember that quarterbacks are much more likely to be intercepted on deep passes, and Flacco tends to throw deep. Flacco has the 5th highest average length of pass this year according to NFLGSIS, after ranking 3rd in 2012, and 8th in 2011. But despite attempting more risky throws, Flacco posted better-than-average interception rates in each of his first five seasons. And he did that despite completion percentages that were often at or below league average.

Before the Super Bowl, I asked if Flacco was simply lucky to keep avoiding interceptions. That seemed like a good explanation for how an inaccurate passer who throws often downfield could have such a low interception rate. But other quarterbacks, like Donovan McNabb, sustained those traits for a long time.

This year, Flacco ranks in the top 7 in both interceptions and interception rate. So has lady luck simply switched allegiances? I looked at all 14 of Flacco’s interceptions this season to determine the cause.

1) Denver, 2nd quarter, 11:47 remaining, 3rd-and-9 from the Baltimore 16, trailing 7-0

Brandon Stokley is the primary receiver on the play. He’s lined up in the slot to Flacco’s left, and ends up running across the middle of the field at the first down marker. He’s in single coverage, but Flacco’s throw is a little short, and Chris Harris makes an outstanding play diving across for the interception. You can view the play here.
[continue reading…]

{ 10 comments }

The most accurate passer in football

The most accurate passer in football.

It’s Friday, so I thought it might be fun to play around with some stats.  Net Yards per Attempt is probably my favorite predictive statistic to measure quarterbacks, but there are some problems with even that metric.  One issue is that Net Yards per Attempt — which is simply yards per attempt but includes sacks data — is pretty sensitive to outliers.  A quarterback who consistently pieces together short passes with a high completion percentage can be pretty valuable, and may end up undervalued compared to some mad bombers.

There are a couple of ways to deal with this.  One is to use a different measure of central tendency than the average production per dropback; for example, we could look at the median yards gained per pass attempt (including sacks).  Another is to measure the standard deviation on all of a quarterback’s pass plays. I thought I’d compile the data on both and see what you guys found interesting.

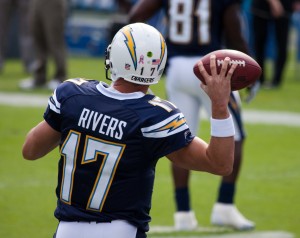
No matter how you splice the data, Philip Rivers looks outstanding. After a couple of down years, Rivers is experiencing a career revival under new head coach Mike McCoy.  The Chargers no longer rely on a downfield passing attack (and with Vincent Jackson gone and Malcom Floyd on IR, that may be more out of necessity than design), but Rivers has found a Darren Sproles replacement in Danny Woodhead.  As a result, Rivers has completed an incredible 73.9% of his passes this season.

Rivers ranks 27th in average length of pass (or average depth of target), reflecting the shorter passing attack, but Tony Romo, Chad Henne, Matt Schaub, Sam Bradford, Matt Ryan, and Alex Smith have lower average distances and worse completion percentages (among other stats).  The Chargers star has also been great at avoiding sacks: he’s completing passes on 70.8% of his dropbacks this year, a stat I’m calling Adjusted completion percentage (A_Cmp% in the table). In the table below, I’ve listed each quarterback’s number of attempts and sacks, his Adjusted completion percentage, his Net Yards per Attempt, and his standard deviation on pass plays. Since standard deviation would be biased towards quarterbacks with higher averages, I’ve sorted the table by the Ratio of each quarterback’s standard deviation to his NY/A average. Finally, I’ve also displayed the median number of yards gained for each quarterback on each dropback. All data excludes last night’s Carolina-Tampa Bay game.
[continue reading…]

{ 1 comment }

A classic shootout

A classic shootout.

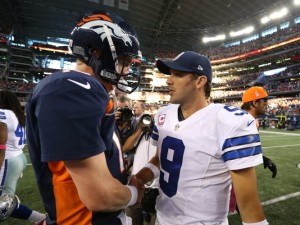
Peyton Manning and Tony Romo staged a classic yesterday afternoon in Dalllas. The Broncos won 51-48, and the two quarterbacks put up ridiculous stat lines. Manning went 33 of 42 for 414 yards, and threw four touchdowns and just one interception. He wasn’t sacked, giving him an impressive 10.69 ANY/A average (based on the formula “Passing Yards + 20 * TDs – 45 * INTs – Sack Yards lost” divided by “Sacks + Attempts”). Romo may have been better, completing 25 of 36 passes for 505 yards and 5 scores — along with one fateful interception, and four sacks for -36 yards. That’s an amazing 13.12 ANY/A average.

So far this year, the league average ANY/A is 6.00. Since Manning was at 10.69 over 42 dropbacks, we could say that he provided 197 adjusted net yards of value over average. Meanwhile, Romo produced 285 adjusted net yards of value (40 * 7.12), which means the two quarterbacks combined to produce over 481 yards of value over average. If the league average for the season remains at 6.00, that would make this the fourth best (era-adjusted) quarterback battle since the merger, although only the second best game involving Manning. The table below shows the top 100 quarterback performances in the same game from 1970 to 2012.

Here’s how to read the table: for the top game: In 1972, Joe Namath and Johnny Unitas played a classic. The fourth column provides the team names (listed as QB 1 vs. QB 2) and a hyperlink link to the actual boxscore. The fifth column shows the quarterback stats: Namath completed 15 of 28 passes for 496 yards, 6 touchdowns, and 1 interception, and had 1 sack for -6 yards; Unitas completed 26 of 45 for 376 yards, threw 2 touchdowns and no interceptions, and was sacked 6 times for -44 yards. Namath produced 441 adjusted net yards of value (using the formula from above), while Unitas produced 154 yards, giving the duo a total of 595 yards above average.
[continue reading…]

{ 33 comments }

It's been a magical month for the Broncos passing game

It's been a magical month for the Broncos passing game.

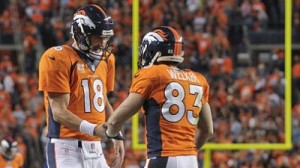
Sometimes, the simplest questions have the most complicated answers. Peyton Manning has thrown 16 touchdowns so far this season, putting him on pace for 64 touchdowns this year. Now, we can be reasonably sure that Manning’s true ability level — even with Wes Welker, Demaryius Thomas, Eric Decker, and Julius Thomas — isn’t four touchdowns per game. But he doesn’t need to keep up that pace to break Tom Brady’s single-season record of 50 touchdown passes: Manning “only” needs to averaged 2.92 touchdowns per game over the final 12 games. But to figure out his odds of averaging nearly three touchdowns per game, we need to figure out his true ability level. So how do we determine that number?

Even for a man who averages four touchdown throws per game over four games, averaging nearly three touchdowns per game going forward is still a tall order. Footballguys.com projected Manning to averaged 2.38 touchdowns per game this year. In 2012, he threw 37 touchdowns, an average of 2.31 touchdowns per game. From 2003 to 2012, excluding games [1]That was after removing week 17 of the ’04, ’05, ’07, ’08, and ’09 seasons, and week 16 of the ’05 and ’09 seasons, when Manning left early. Why did I pick the last ten years? I don’t … Continue reading he exited early, Manning averaged 2.17 touchdown passes per game. As a Colt, Manning averaged 1.92 touchdowns per game.

It doesn’t take any advanced math skills to figure out that Manning is likely to average somewhere between 2 and 4 touchdowns per game over the rest of the season. But that doesn’t help us very much: we need to be precise, since the threshold he needs to hit is 2.92 touchdowns per game. I’ll get to the more complicated math in Part II. For now, let’s look at some history.
[continue reading…]

References

References
1 That was after removing week 17 of the ’04, ’05, ’07, ’08, and ’09 seasons, and week 16 of the ’05 and ’09 seasons, when Manning left early. Why did I pick the last ten years? I don’t know, but he won his first MVP in ’03, so that seemed like a useful starting point.
{ 4 comments }

Brady needs to channel another Tom (Flores) this season

Brady needs to channel another Tom (Flores) this season

As Jason Lisk and I wrote about before the season, Tom Brady and Ben Roethlisberger have become something of the poster children so far this year when it comes to veteran QBs working with inexperienced and otherwise less-than-notable receiving groups. And, lo and behold, each has put up career-low RANY/A marks through 2 games. But how do their receiving corps rank relative to those of other teams so far this year, and how do they stack up historically?

To take a stab at answering these questions, I turned to True Receiving Yards. For each player who debuted in 1950 or later, I computed their Weighted Career True Receiving Yards for every year, as of the previous season, to get a sense of how experienced/accomplished they’d been going into the season in question. Then, I calculated a weighted averaged of those numbers for every receiver on a given team, using TRY during the season in question as the weights. For example, here are the 2013 Patriots receivers:

PlayerAgeDebutTRY% of TmAt-the-time WCTRY
Julian Edelman27200913938%615.7
Danny Amendola2820097220%1541.9
Kenbrell Thompkins2520135615%0.0
Shane Vereen2420114412%110.9
Aaron Dobson2220134312%0.0
Michael Hoomanawanui25201051%278.8
James Develin25201341%0.0
Weighted Average560.7

The way to read that is: Julian Edelman has accounted for 38 percent of the Pats’ TRY so far. Going into the season, he had a career Weighted TRY of 615.7, so he contributes to 38% of the 2013 Pats’ weighted average with his 615.7 previous career weighted TRY; Danny Amendola contributes to 20% of the team weighted average with his 1541.9 previous career weighted TRY; etc. Multiply each guy’s previous weighted career TRYs by the percentage of the team’s 2013 TRY he contributed, and you get a cumulative weighted average of 560.7 — meaning the average TRY of a 2013 Pats receiver has been gained by a guy who had a previous career weighted TRY of 560.7.

Is that a low number? Well, here are the numbers for all of the 2013 team receiving corps (not including Thursday night’s Eagles-Chiefs tilt), inversely sorted by weighted average (asterisks indicate rookies):

[continue reading…]

{ 3 comments }

What the Week 1 Passing Records Mean for 2013

In week 1, records were set for the most passing touchdowns (63) and team passing yards (8143) thrown in a single week in league history. Is this a sign that 2013 will represent the next stage in the evolution in the passing game, or are offenses typically ahead of defenses early on?

To compare week 1 of this season to other weeks in NFL history, we need to examine all statistics on a per team game basis to account for bye weeks and number of teams. But after calculating the per team game numbers, I multiplied the result by 32 to make the numbers easier to digest. The first graph shows the average number of passing touchdowns in week N of each season since 1970. As you can see, week 1 doesn’t stand out as typically being passer-friendly. On average, there were roughly 41.5 touchdowns per team game (after multiplying by 32) in week 1 of each season from 1970 to 2012, which is nearly identical to the average (40.9) the rest of the year:

[continue reading…]

{ 1 comment }

The Ebb and Flow of the NFL Passing Game Since 1932

One of the two greatest quarterbacks of the first half of the 20th century

One of the two greatest quarterbacks of the first half of the 20th century.

The game played by Peyton Manning and Joe Flacco last night bears little resemblance to the game Sammy Baugh played. Teams pass much more frequently and efficiently than ever before. And there are external effects, too: In 2011 and 2012, the average carry went for 4.3 yards, the first two years the average has ever been so high. But the details are often lost when discussing how the game has changed, and today’s post will help to refine exactly how, and in what way, the game has changed.

Nine men have thrown for 4,900 passing yards in a season. Seven of them did so in either 2011 or 2012. How did we get here? The NFL has turned into a pass-heavy league, but these changes didn’t happen overnight: a series of rules changes since the berth of the league have promoted the pass-happy environment we see today. The first ever playoff game came in 1932, pitting the Chicago Bears against the Portsmouth Spartans, predecessors of today’s Detroit Lions. The game was scoreless until the fourth quarter, when Bronko Nagurski threw a controversial pass to Red Grange for the game-winning touchdown. The pass was controversial because in 1932, a player needed to be at least five yards behind the line of scrimmage in order to be eligible to pass. The league eliminated the rule after the game [1]There must be an inverse relationship between passing prowess and rule volatility, since it took the NFL twelve years to get rid of the Tuck Rule., allowing quarterbacks and other passers to be able to pass from anywhere behind the of scrimmage.

In 1934, a slimmer and more aerodynamic football was introduced to make life easier for quarterbacks. In the 1940s, most teams switched from the single-wing to the T-Formation, which placed the quarterback in the center of the offense and helped promote the passing game. Sammy Baugh in Washington and Sid Luckman in Chicago dominated the league, and the Redskins or Bears won the title every year from 1940 to 1943. During World War II, every franchise was playing with depleted rosters, so the league experimented with a rule change that would permit liberal substitutions. Finally, in 1950, the league finally decided to go with free substitution rules on a permanent basis. As pro football historian Sean Lahman explains:

For the NFL’s first three decades, versatility was the most important trait for a player. Your starting quarterback had to be quick enough to play safety, your running backs tough enough to play linebacker. The downside to this approach was that a player with one specific skill – say blazing speed – might not be enough of an all-around player to crack the starting lineup. With free substitution legalized, specialization became the norm…. Free substitution helped the passing game immensely because it allowed coaches to use quick players at offensive end who weren’t big enough to play defense. Their speed could be used as a weapon, and many teams moved to formations that featured three ends and just two backs.

The changes produced immediate results, and by 1954, the passing game had exploded. For the first time in league history, the league average completion percentage topped fifty-percent, and the average pass attempt gained 7.2 yards. By point of reference, teams averaged 7.1 yards per pass attempt in 2012.
[continue reading…]

References

References
1 There must be an inverse relationship between passing prowess and rule volatility, since it took the NFL twelve years to get rid of the Tuck Rule.
{ 25 comments }

Straight cash, homey.

Straight cash, homey.

In 1998, 21-year-old Randy Moss made a stunning NFL debut, racking up 17 touchdowns and 1,260 True Receiving Yards, the 2nd-best total in football that season. The Vikings’ primary quarterback that year, Randall Cunningham, was a former Pro Bowler and MVP, but all that seemed like a lifetime ago before the ’98 season. He’d been out of football entirely in 1996, and in 1997 he posted an Adjusted Net Yards per Attempt average that was 1.2 points below the league’s average (for reference’s sake, replacement level is usually around 0.75 below average). With Moss in ’98, though, Cunningham’s passing efficiency numbers exploded: he posted a career best +3.2 Relative Adjusted Net Yards per Attempt, miles ahead of his perfectly-average overall career mark. If we adjust for the fact that Cunningham was also 35 at the time (an age at which quarterbacks’ RANY/A rates tend to be 1.1 points below what they are at age 27), Cunningham’s 1998 rate was actually 4.3 points better than we’d expect from the rest of his career, a staggering outlier.

The following year, Jeff George took over as the Vikings primary quarterback, and he promptly posted a Relative ANY/A 2.2 points higher than expected based on his age and the rest of his career. [1]Cunningham’s RANY/A was also 1.0 better than expected in limited action. George left Moss and Minnesota after the season, and he would throw only 236 passes the rest of his career, producing a cumulative -0.6 RANY/A in Washington before retiring.

From 2000-04, Moss was the primary target of Daunte Culpepper, whose RANY/A was 0.7 better than expected (based on Culpepper’s career numbers) when Moss was around. [2]That number is an average weighted by the number of TRY Moss had in each season Although he’d enjoyed one of the best quarterback seasons in NFL history in 2004, Culpepper was never the same after Moss was traded to Oakland; in fact, he never even had another league-average passing season, producing a horrible -1.2 RANY/A from 2005 until his retirement in 2009. [3]To be fair, Culpepper tore his ACL, MCL, and PCL halfway through the 2005 season, which also was a factor in his decline.

Moss’s stint with the Raiders was famously checkered — although Kerry Collins’ RANY/A was 0.6 better than expected in 2005, Aaron Brooks played 2.5 points of RANY/A below his previous standards in 2006 — but we all know what happened when he joined the Patriots in 2007. With Moss, Tom Brady’s RANY/A was a whopping 1.3 points higher than expected from the rest of his career, and Moss also played a big role in Matt Cassel’s RANY/A being +1.0 relative to expectations after Brady was lost for the season in 2008.

While Moss’s post-Pats career hasn’t exactly been the stuff of legends, the majority of his career (weighted by True Receiving Yards) saw him dramatically improve his quarterbacks’ play relative to the rest of their careers. In fact, his lifetime WOWY (With or Without You) mark of +1.1 age-adjusted RANY/A ranks 3rd among all receivers who: a) had at least 3,000 career TRY, b) started their careers after the merger, and c) played exclusively with quarterbacks who started their careers after the merger. And the first two names on the list are possibly explained by other means. The table below lists all 301 receivers with 3,000 career TRY. The table is fully sortable and searchable, and you can click on the arrows at the bottom of the table to scroll. The table is sorted by the QB WOWY column.
[continue reading…]

References

References
1 Cunningham’s RANY/A was also 1.0 better than expected in limited action.
2 That number is an average weighted by the number of TRY Moss had in each season
3 To be fair, Culpepper tore his ACL, MCL, and PCL halfway through the 2005 season, which also was a factor in his decline.
{ 7 comments }
Picture1

The consensus view on John Elway is clear. He was the greatest draft prospect ever, a league MVP, a two-time Super Bowl champion, a Hall of Famer, and one of the most clutch quarterbacks in football history.

But that’s not necessarily what the numbers say. In my quarterback ranking system, which rewards efficiency and longevity and adjusts for era, Elway only ranked as the 26th best regular-season quarterback of all time. If you’re so inclined, it’s not hard to find the numbers to argue that Elway – at least until Mike Shanahan returned to Denver as head coach in 1995 — was overrated. Consider:

  • Over the first 10 years of his career, Elway threw 158 touchdowns and 157 interceptions.
  • Elway never led the NFL in passer rating, completion percentage, touchdowns, yards per attempt, or Adjusted Net Yards per Attempt. Elway didn’t finish in the top ten in passer rating until his eleventh season in the league. In Net Yards per Attempt, Elway ranked in the top 10 just once from 1983 to 1994 (a first-place finish in ’87); in ANY/A, Elway’s only top ten finishes during his first ten seasons were in ’86 (10th) and ’87 (4th).
  • Elway ranks fourth all-time in passing yards, but that’s because he ranks fourth in career pass attempts. While he led the NFL in passing yards in 1993, Elway only finished in the top five in passing yards four times in his career: 1985 (2nd), 1987 (4th), 1990 (5th), and 1995 (5th).
  • Elway ranked 2nd in passing touchdowns in 1993, the only time he finished in the top 5 in that metric from 1983 to 1995. Despite throwing the fourth most pass attempts in NFL history, he ranks only 7th in passing touchdowns. In eight of sixteen seasons, including seven of his first ten years, Elway produced a below-average touchdown rate.

Here’s another interesting stat: from 1983 to 1992, the Broncos were slightly better on defense than offense. Over that time period, Denver’s Offensive SRS average was +1.01 while their Defensive SRS was +1.32. On average, the Broncos ranked 12th in points scored and 11th in points allowed. Those Denver teams are remembered as Elway’s teams — and perhaps rightly so — but the defense was just as valuable as the offense. [1]On the other hand, it’s worth pointing out that the ’83-’92 Broncos won more games than their Pythagorean record would have predicted, so perhaps Elway was responsible for more wins … Continue reading
[continue reading…]

References

References
1 On the other hand, it’s worth pointing out that the ’83-’92 Broncos won more games than their Pythagorean record would have predicted, so perhaps Elway was responsible for more wins than his passing numbers would indicate.
{ 99 comments }

Leader in Fu Manchus among active quarterbacks (sorry, Mark)

Leader in Fu Manchus among active quarterbacks (sorry, Mark).

Let’s be honest: we all know Aaron Rodgers is great, so we don’t spend much time talking about him. Debating his ability is pointless, so we instead spend countless hours discussing Tony Romo’s intangibles, Tim Tebow’s throwing motion, Colin Kaepernick’s tattoos, and Joe Flacco’s eliteness. Talk radio dies when it discusses Aaron Rodgers: debating the Packers quarterback is as fun as watching paint dry and as illuminating as asking if water is wet.

But we’re doing a disservice to us all when we ignore how great Rodgers is. I mean, we spend lots of time chronicling the feats of Adrian Peterson and Calvin Johnson — why not Rodgers?

One way to measure Rodgers’ greatness is to look at passer rating. Now we know that passer rating is wildly overrated, so perhaps you shouldn’t be too impressed to hear that Rodgers has the highest passer rating in history. But consider: Rodgers has a career 104.9 passer rating, well ahead of Steve Young, who is second at 96.8. Chad Pennington sits at #13 on the career passer rating list (an example of why this metric is one I don’t use), but Young is closer to Pennington (90.1) than he is to Rodgers. But there’s an even better way to show Rodgers’ dominance in this statistic.

Passer rating is made up of four metrics. Let’s take a look at how Rodgers ranks in those four categories:
[continue reading…]

{ 40 comments }

Yesterday, I set up a method for ranking the flukiest fantasy football seasons since the NFL-AFL merger, finding players who had elite fantasy seasons that were completely out of step with the rest of their careers. I highlighted fluke years #21-30, so here’s a recap of the rankings thus far:

30. Lorenzo White, 1992
29. Dwight Clark, 1982
28. Willie Parker, 2006
27. Lynn Dickey, 1983
26. Robert Brooks, 1995
25. Ricky Williams, 2002
24. Jamal Lewis, 2003
23. Mark Brunell, 1996
22. Vinny Testaverde, 1996
21. Garrison Hearst, 1998

Now, let’s get to…

The Top Twenty

20. RB Natrone Means, 1994

Best Season
yeargrushrushydrushtdrecrecydrectdVBD
1994163431,35012392350103.0
2nd-Best Season
yeargrushrushydrushtdrecrecydrectdVBD
199714244823915104012.9

Big, bruising Natrone Means burst onto the scene in 1994 as a newly-minted starter for the Chargers’ eventual Super Bowl team, gaining 1,350 yards on the ground with 12 TDs. In the pantheon of massive backs, he was supposed to be the AFC’s answer to the Rams’ Jerome Bettis, but Means was slowed by a groin injury the following year and never really stayed healthy enough to recapture his old form. The best he could do was to post a pair of 800-yard rushing campaigns for the Jaguars & Chargers in 1997 & ’98 before retiring after the ’99 season.

19. WR Braylon Edwards, 2007

Best Season
yeargrecrecydrectdVBD
200716801,28916107.7
2nd-Best Season
yeargrecrecydrectdVBD
20101653904715.4

The 3rd overall pick in the 2005 Draft out of Michigan, Edwards seemingly had a breakout 2007 season catching passes from fellow Pro Bowler Derek Anderson. But both dropped off significantly the next season, and Edwards was sent packing to the Jets in 2009. He did post 904 yards as a legit starting fantasy wideout in 2010, but he has just 380 receiving yards over the past 2 seasons, and it’s not clear he’ll ever live up to those eye-popping 2007 numbers again.
[continue reading…]

{ 6 comments }

Since Sam Bradford was drafted by the Rams in 2010, the only consistent force in St. Louis has been change. Tackle Rodger Saffold, drafted in the second round of the same draft, is the only other player on the 2010 Rams offense who is still on the team. Bradford has already played under three offensive coordinators (Pat Shurmur as a rookie, Josh McDaniels in 2011, and Brian Schottenheimer last year), which means this is the first time in four years he isn’t learning a new system. And while his rookie season was always overrated, his performance last year was better than you think. After adjusting for one of the league’s toughest schedules, Bradford ranked 18th in Adjusted Net Yards per Attempt, despite being saddled with an inferior set of receivers.

How inferior? The table below shows the top six leaders in receiving yards for St. Louis last season:

Games Receiving
Rk Player Year Age Tm G GS Rec Yds Y/R TD Y/G
1 Chris Givens 2012 23 STL 15 12 42 698 16.62 3 46.5
2 Brandon Gibson 2012 25 STL 16 13 51 691 13.55 5 43.2
3 Danny Amendola 2012 27 STL 11 8 63 666 10.57 3 60.5
4 Lance Kendricks 2012 24 STL 16 14 42 519 12.36 4 32.4
5 Steven Jackson 2012 29 STL 16 15 38 321 8.45 0 20.1
6 Austin Pettis 2012 24 STL 14 2 30 261 8.70 4 18.6

Chances are, unless you’re a Rams fan or play fantasy football, you’ve never even heard of four of those names.  And while Amendola was productive when healthy, he missed five games last year (and it’s worth noting that Bradford’s numbers weren’t worse without Amendola in the lineup). Steven Jackson is of course a great player, but there’s only so much help a 29-year-old running back who catches 38 passes can provide to an ailing passing game.
[continue reading…]

{ 5 comments }

No, Peyton, you are #1

No, Peyton, you are #1.

Back in March, Chase wrote a post investigating how quarterbacks age, finding that they peak at age 29 (with a generalized peak from 26-30) in terms of value over average. Today, I thought I’d quickly look at how quarterbacks age in terms of their performance rate — specifically, their Adjusted Net Yards per Attempt (ANY/A). For newer readers, ANY/A is based on the following formula: (Passing Yards + 20 * Passing TDs – 45 * INTs – Sack Yards Lost) / (Pass Attempts + Sacks).

First, I need to introduce a way of adjusting ANY/A for era: Relative ANY/A. Relative ANY/A is simply equal to:

QB_ANY/A – LgAvg_ANY/A

The table below lists the 30 single-season leaders in Relative ANY/A since the merger. You won’t be too surprised to see the 2004 version of Peyton Manning at the top. That year, Manning averaged 9.8 ANY/A, while the league average was just 5.6 ANY/A. That means Manning gets a Relative ANY/A grade of +4.1 (with the difference due to rounding).
[continue reading…]

{ 17 comments }

Most of you know that counting stats mean little for quarerbacks, but most of you also know that nothing beats meaningless trivia. Last July, I wondered who would lead the NFL in rushing yards from 2012 to 2021? It took a year, but now the natural follow-up question: Who will lead the NFL in passing yards over the next ten seasons?

Did you know that Joe Montana passed for the most yards in the ’80s? Or that Y.A. Tittle passed for the most yards from ’48 to ’57 (AAFC included) and then ’53 to ’62? The table below shows each leader in passing yards for every ten-year period, along with their age and NFL experience during their first season of that decade.
[continue reading…]

{ 19 comments }

Manning's worst statistical performance.

Manning's worst statistical performance.

Scott Kacsmar recently wrote about how Daunte Culpepper had the worst performance of his career in his biggest game. In his only NFC Championship Game appearance, Culpepper went 13-of-28 for 78 yards with three interceptions and four sacks. Which made me wonder: how many other great quarterbacks have had their worst game in the playoffs?

I’ll define worst game using the methodology from my Greatest QB of All-Time series [1]For pre-2008, I will be using estimated sack data based on the following formula: Team Sacks allowed X (QB pass attempts / team pass attempts). This means I will calculate each quarterback’s ANY/A [2]I will also include rushing touchdowns and count them the same as passing touchdowns, but will not include any other rushing data. and compare it to league average for that season.

For example, Peyton Manning‘s worst game came in November 2007 against the Chargers. He threw for 328 yards and 2 touchdowns, but that came on 58 dropbacks and with six interceptions. He averaged 1.44 ANY/A that game, in a season where the league average was 5.52 ANY/A. That means Manning was 4.08 ANY/A below average on 58 pass plays, which gave him 239 Adjusted Net Yards below average. The table below shows some of the top quarterbacks in NFL history and which games were their worst. For quarterbacks like Johnny Unitas and Bart Starr, the records are incomplete, as our individual games database only goes back to 1960. The “VALUE” column shows how many Adjusted Net Yards each quarterback was below average.
[continue reading…]

References

References
1 For pre-2008, I will be using estimated sack data based on the following formula: Team Sacks allowed X (QB pass attempts / team pass attempts).
2 I will also include rushing touchdowns and count them the same as passing touchdowns, but will not include any other rushing data.
{ 1 comment }

Last week, I wrote about why I was not concerned with Trent Richardson’s yards per carry average last season. I like using rushing yards because rush attempts themselves are indicators of quality, although it’s not like I think yards per carry is useless — just overrated. One problem with YPC is that it’s not very stable from year to year. In an article on regression to the mean, I highlighted how yards per carry was particularly vulnerable to this concept. Here’s that chart again — the blue line represents yards per carry in Year N, and the red line shows YPC in Year N+1. As you can see, there’s a significant pull towards the mean for all YPC averages.

regression ypc

I decided to take another stab at examining YPC averages today.  I looked at all running backs since 1970 who recorded at least 50 carries for the same team in consecutive years. Using yards per carry in Year N as my input, I ran a regression to determine the best-fit estimate of yards per carry in Year N+1. The R^2 was just 0.11, and the best fit equation was:

2.61 + 0.34 * Year_N_YPC

So a player who averages 4.00 yards per carry in Year N should be expected to average 3.96 YPC in Year N+1, while a 5.00 YPC runner is only projected at 4.30 the following year.

What if we increase the minimums to 100 carries in both years? Nothing really changes: the R^2 remains at 0.11, and the best-fit formula becomes:

2.63 + 0.34 * Year_N_YPC

150 carries? The R^2 is 0.13, and the best-fit formula becomes:

2.54 + 0.37 * Year_N_YPC

200 carries? The R^2 stays at 0.13, and the best-fit formula becomes:

2.61 + 0.36 * Year_N_YPC

Even at a minimum of 250 carries in both years, little changes. The R^2 is still stuck on 0.13, and the best-fit formula is:

2.68 + 0.37 * Year_N_YPC

O.J. Simpson typifies some of the issues. It’s easy to think of him as a great running back, but starting in 1972, his YPC went from 4.3 to 6.0 to 4.2 to 5.5 to 5.2 to 4.4. Barry Sanders had a similar stretch from ’93 to ’98, bouncing around from 4.6 to 5.7 to 4.8 to 5.1 to 6.1 and then finally 4.3. Kevan Barlow averaged 5.1 YPC in 2003 and then 3.4 YPC in 2004, while Christian Okoye jumped from 3.3 to 4.6 from 1990 to 1991.
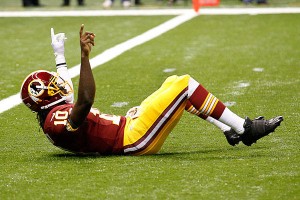
This guy knows about leading the league

This guy knows about leading the league.

Those are isolated examples, but that’s the point of running the regression. In general, yards per carry is not a very sticky metric. At least, it’s not nearly as sticky as you might think.

That was going to be the full post, but then I wondered how sticky other metrics are.  What about our favorite basic measure of passing efficiency, Net Yards per Attempt? For purposes of this post, an Attempt is defined as either a pass attempt or a sack.

I looked at all quarterbacks since 1970 who recorded at least 100 Attempts for the same team in consecutive years. Using NY/A in Year N as my input, I ran a regression to determine the best-fit estimate of NY/A in Year N+1. The R^2 was 0.24, and the best fit equation was:

3.03 + 0.49 * Year_N_NY/A

This means that a quarterback who averages 6.00 Net Yards per Attempt in Year N should be expected to average 5.97 YPC in Year N+1, while a 7.00 NY/A QB is projected at 6.45 in Year N+1.

What if we increase the minimums to 200 attempts in both years? It has a minor effect, bringing the R^2 up to 0.27, and producing the following equation:

2.94 + 0.51 * Year_N_NY/A

300 Attempts? The R^2 becomes 0.28, and the best-fit formula is now:

2.94 + 0.53 * Year_N_NY/A

400 Attempts? An R^2 of 0.26 and a best-fit formula of:

3.18 + 0.50 * Year_N_NY/A

After that, the sample size becomes too small, but the takeaway is pretty clear: for every additional yard a quarterback produces in Year N, he should be expected to produce another half-yard in NY/A the following year.

So does this mean NY/A is sticky and YPC is not? I’m not so sure what to make of the results here. I have some more thoughts, but first, please leave your ideas and takeaways in the comments.

{ 9 comments }

The guy on the right was a loser until he wasn't.

The guy on the right was a loser until he wasn't.

Longtime readers of this blog know that I’m not a big fan of Matt Stafford. Last year, when most people were praising his breakout 2011 season, I questioned whether he was as good as his backers claimed. And, of course, his 2012 performance only raised more questions.

Stafford has a 17-28 career record, which in light of his recent contract extension, has caused people to criticize the Lions for giving big money to a player who is not a “winner.” There are legitimate reasons to criticize Stafford, so why would people fall back on statements like this? I’m sure Lions fans wish the team had won more games under Stafford, but that’s in the past. The real question — and the one faced by Lions management before giving him the extension — is whether his current career record has any predictive value when it comes to his future record.

Since 1960, there have been 77 quarterbacks [1]Because their first seasons as starters came after age 25, I decided to eliminate Jeff Garcia, Trent Green, Warren Moon, Kurt Warner, Ed Brown, Tony Romo, Mark Rypien, and Jim Kelly from this … Continue reading who started at least 25 games in their first four seasons and then 25 more games in years five through eight. There’s some survivor bias in the sample — if you stick around for 25+ starts in years five through eight, you’re probably a pretty good quarterback — but there’s not much we can do about that. If you run a regression using winning percentage through four years as your input and winning percentage in years five through eight as your output, you get the following best-fit equation:

0.450 + 0.20 * Old Win %

The correlation coefficient is a tiny 0.04, and the p-value on the “Old Win %” variable is 0.09. Putting aside the questions of statistical significance, there is no practical effect. Stafford has a 0.377 winning percentage, which means this formula would predict him to win 52.6% of his games from 2013 to 2016. Joe Flacco won 68.75% of his games in his first four seasons; this would say he should be expected to win 58.7% of his games in years five through eight. In other words, someone with a great winning percentage should be expected to win only one more game per season than someone with a terrible winning percentage. And that’s even assuming the results are statistically significant, which many would say they are not. [2]And, of course, it doesn’t mean that that one extra win is because of the quarterback. Presumably, like in the case of Flacco, those quarterbacks who win games early are on good teams, and … Continue reading
[continue reading…]

References

References
1 Because their first seasons as starters came after age 25, I decided to eliminate Jeff Garcia, Trent Green, Warren Moon, Kurt Warner, Ed Brown, Tony Romo, Mark Rypien, and Jim Kelly from this study.
2 And, of course, it doesn’t mean that that one extra win is because of the quarterback. Presumably, like in the case of Flacco, those quarterbacks who win games early are on good teams, and those teams are more likely to stay good than the bad teams.
{ 8 comments }

Wilson scrambles and gets credit for it.

Wilson scrambles and gets credit for it.

I hate passer rating. So do you. Everyone does, except for Kerry Byrne. Passer rating is stupid because it gives a 20-yard bonus for each completion, a 100-yard penalty for each interception, and an 80-yard bonus for each touchdown. In reality, there should be no (or a very small) weight on completions, a 45-yard weight on interceptions, and a 20-yard weight on touchdowns.

But let’s ignore those issues today. Reading Mike Tanier’s recent article inspired me to make see what passer rating would look like if we make three tweaks. I’m not going to change any of the weights in the formula, but just redefine the variables.

1) There’s no reason to exclude sack data from passer rating. I’ve stopped writing about how sacks are just as much (if not more) on the quarterback than other passing metrics, because I think that horse has been pretty well beaten by Jason Lisk and me.

2) Scrambles should be treated like completed passes. If Russell Wilson is about to be sacked, but escapes and run for 7 yards, why should that be treated any differently than if Peyton Manning is about to be sacked, but throws a seven-yard pass at the last second?

3) Lost Fumbles should be counted with interceptions. One could make a few advanced arguments here — we should use all fumbles instead of lost fumbles, or fumbles should be given an even stronger weight than interceptions (although consider that in light of this post), or that we should limit ourselves to just fumbles lost on passing plays. I’m going to play the simple card here, and just use lost fumbles data on the season level.

Passer rating consists of four metrics, all weighted equally: completions per attempt, yards per attempt, touchdowns per attempt, and interceptions per attempt. I will use the same formula with the same weights and the same variables, but redefine what those variables are. Here are the new definitions, with the additions in blue.

Completion percentage is now (Completions plus Scrambles) / (Pass Attempts plus Sacks plus Scrambles)

Yards per Attempt is now (Passing Yards plus Yards on Scrambles minus Sack Yards Lost) / (Pass Attempts plus Sacks plus Scrambles)

Touchdown Rate is now (Passing Touchdowns plus Touchdowns on Scrambles) / (Pass Attempts plus Sacks plus Scrambles)

Turnover Rate will replace Interception Rate in the formula, and is calculated as (Interceptions plus Fumbles Lost) / (Pass Attempts plus Sacks plus Scrambles)

The table below lists all of those metrics for the 32 quarterbacks who had enough pass attempts to qualify for the passer rating crown, along with Alex Smith and Colin Kaepernick, who just missed qualifying. Let’s look at the Robert Griffin III line.

He completed 258 of 393 pass attempts for 3200 yards, with 20 touchdowns and five interceptions. Those are the standard stats that make up passer rating, but he also took 30 sacks and lost 217 yards on those sacks. That makes Griffin’s numbers worse, but he also had 38 scrambles for 302 yards (which gets recorded as 38 completed passes for 302 yards), with no scramble touchdowns. Finally, he lost two fumbles. His new completion percentage is 64.2%, his new yards per attempt is 7.13, his new touchdown rate is 4.3%, and his turnover rate (which includes fumbles) is 1.5%. The final two columns show each quarterback’s passer rating under the normal system and their passer rating using these metrics, which I’ll call the FPPR for short.
[continue reading…]

{ 14 comments }
Year QBrec Cmp Att Cmp% Yards TD TD% Int Int% Y/A Y/C PRate ESPN QBR Sk Yds NY/A ANY/A Sk%
2004 1-6-0 95 197 48.2 1043 6 3.0 9 4.6 5.3 11.0 55.4 13 83 4.57 3.21 6.2
2005 11-5-0 294 557 52.8 3762 24 4.3 17 3.1 6.8 12.8 75.9 28 184 6.12 5.63 4.8
2006 8-8-0 301 522 57.7 3244 24 4.6 18 3.4 6.2 10.8 77.0 25 186 5.59 4.99 4.6
2007 10-6-0 297 529 56.1 3336 23 4.3 20 3.8 6.3 11.2 73.9 27 217 5.61 4.82 4.9
2008* 12-4-0 289 479 60.3 3238 21 4.4 10 2.1 6.8 11.2 86.4 62.56 27 174 6.06 6.00 5.3
2009 8-8-0 317 509 62.3 4021 27 5.3 14 2.8 7.9 12.7 93.1 69.75 30 216 7.06 6.89 5.6
2010 10-6-0 339 539 62.9 4002 31 5.8 25 4.6 7.4 11.8 85.3 65.88 16 117 7.00 6.09 2.9
2011* 9-7-0 359 589 61.0 4933 29 4.9 16 2.7 8.4 13.7 92.9 59.39 28 199 7.67 7.45 4.5
2012* 9-7-0 321 536 59.9 3948 26 4.9 15 2.8 7.4 12.3 87.2 67.39 19 136 6.87 6.59 3.4
Career 78-57-0 2612 4457 58.6 31527 211 4.7 144 3.2 7.1 12.1 82.7 213 1512 6.43 5.94 4.6

In 2011, Eli Manning threw for 4,933 yards and won the Super Bowl. Last year, he threw for 3948 yards and missed the playoffs. It’s tempting to think that something was “wrong” with Manning last year. Another narrative would be that 2011 was a career year far out of line with anything else he’s done, which would make 2012 was the real Manning. I’m not sure I buy either of those explanations.

Let’s start by comparing Manning’s numbers in 2011 and 2012. Yes, his passing yards dropped, but that’s a meaningless metric on its own. He threw 53 fewer passes in 2012, a partial explanation for why his yards declined. And while his yards per attempt did drop from 8.4 to 7.4, about 20% of that dip was mitigated by the fact that he took fewer sacks (his Net Yards per Attempt dropped from 7.7 to 6.9). In addition to improving his sack rate, Manning’s touchdown and interception rates were virtually identical, which means his decline was limited to pass attempts and yards per attempt.

We can break down the numbers on why his yards per attempt declined thanks to some additional data courtesy of NFLGSIS. In 2011, Manning averaged 8.4 yards per attempt. That was a result of three things: a 61.0% completion rate, 5.82 yards after the catch (per completion), and 7.92 Air Yards per Completed Pass. In 2012, Manning averaged 7.4 yards per attempt, with a 59.9% completion rate, 4.33 average YAC, and 7.97 Air Yards per Completed Pass.

The tiny drop in completion percentage is more than offset by the better sack rate, and if Manning was throwing incomplete passes instead of taking sacks, that’s a good thing. As for what happens when he completed a pass, his entire decline was in the form of yards after the catch. In 2011, he ranked 3rd in Air Yards per Completed Pass and 6th in YAC per completion; in 2012, he ranked 2nd in AY/CP and 30th in YAC per completion.

Now there’s some evidence to indicate YAC might be more on the quarterback than Air Yards. Other studies, and what I think is popular opinion, is that YAC is more about the receiver than the quarterback. But let’s further investigate why the Giants dipped in YAC. The table below shows a more precise breakdown. For both 2011 (in blue) and 2012 (in red), you can see the number of Receptions, Air Yards per Reception, YAC per reception, and Yards per Reception. The rows show each of the Giants top three receivers, top tight end, and top running back, along with the other players at wide receiver, tight end, and running back.
[continue reading…]

{ 8 comments }

Wes Welker and playing with two HOF QBs

Last summer, I wrote a post on the percentage of each player’s receiver yards that came from each quarterback. Aaron Schatz asked the following trivia question yesterday that made me think of that old post.

Wes Welker will become the fourth player to catch passes from both Tom Brady and Peyton Manning. Can you name the first three?

Click Show for the Answer Show


That got me to thinking about other players who have played with Hall of Fame quarterbacks. There are 23 modern era quarterbacks in the Hall of Fame. Brett Favre, Kurt Warner, Manning, Brady, and Drew Brees are Hall of Famers in spirit, and Aaron Rodgers isn’t far behind those guys. That’s 29: I threw in Ken Anderson to get us to an even 30.

I then checked to see how many players caught touchdown passes from more than one of those players. The most common pairings were from quarterbacks on the same team: Joe Montana and Steve Young (9), Norm Van Brocklin and Bob Waterfield (8), Sonny Jurgensen and Van Brocklin (6), and Favre and Rodgers (6).

But there were some pretty interesting ones on the list, too. Assuming Warner makes the Hall of Fame, Amp Lee will be the only player in NFL history to catch touchdowns from four Hall of Fame quarterbacks (Warner, Montana, Young, and Warren Moon). Currently, Lee is one of five players to catch passes from three quarterbacks in the Hall of Fame:
[continue reading…]

{ 3 comments }

Franchises Nemeses: Passing Stats

Let’s start with a bit of trivia. Do you know which quarterback has thrown for the most passing yards against any one opponent?

Click Show for the Answer Show


What about the most passing touchdowns?

Click Show for the Answer Show


Last year, on the Wednesday through Friday of Fourth of July, I posted a list of franchise leaders in passing stats, rushing stats, and receiving stats. This year, I’ll be doing the reverse, looking at the biggest nemeses for each franchise. We’ll start with the passing stats today.

The table below shows for each NFL team the quarterback to whom they have allowed the most passing yards since 1960.
[continue reading…]

{ 12 comments }

Yards per Attempt is the basic statistic around which the passing game should be measured. It forms the base of my favorite predictive statistic (Net Yards per Attempt) and my favorite explanatory statistic (Adjusted Net Yards per Attempt). But it’s not perfect.

In theory, Yards per Attempt is a system-neutral metric. If you play in a conservative, horizontal offense, you can have a very high completion percentage, like David Carr in 2006. But if you’re not any good (like Carr in 2006), you’ll produce a low yards-per-completion average, dragging down your Y/A average. You can’t really “game” the system to get a high yards per attempt average; the way to finish among the league leaders in Y/A is simply by being very good.

Courtesy of NFLGSIS, I have information on the length of each pass (or Air Yards) thrown during the 2012 regular season. I then calculated, for each distance in the air, the average completion percentage and average yards per completion. In the graph below, the X-Axis shows how far form the line of scrimmage the pass went (or, as Mike Clay calls it, the depth of target). The blue line shows the average completion percentage (off the left Y-Axis) based on the distance of the throw, while the red line shows the average yards per completion (off the right Y-Axis). For example, passes four yards past the LOS are completed 69% of the time and gain 5.4 yards per completion, while 14-yard passes are at 50% and 17.6.

Cmp vs. YPC2

We can also follow up on yesterday’s post by looking at Air Yards vs. YAC for each distance or depth of throw. Air Yards is in red and on the right Y-Axis, while average yards after the catch is in blue and measured against the left Y-Axis. Initially, there is a pretty strong inverse relationship, just like with completion percentage and yards per completion. On a completion that is one yard past the line of scrimmage, the average YAC is 5.5; on a completion 10 yards downfield, the average YAC drops to 3.0. This is why players like Percy Harvin and Randall Cobb will rack up huge YAC numbers. But once you get past 13 or 14 yards, YAC starts to rise again. This makes sense, as that far down the field, a player is just one broken tackle away from a huge gain (I suspect using median YAC might paint a different picture).
[continue reading…]

{ 16 comments }

Luck winds up to throw deep

Luck winds up to throw deep.

Consider the following example. The Colts gain possession at the 20-yard line. Andrew Luck is in shotgun and throws a strike to Reggie Wayne, who catches it at the 30, runs 15 yards, and gets tackled at the 45-yard line. Luck gets credited with 25 passing yards and Wayne records 25 receiving yards. Wayne is also credited with 15 yards after the catch, a statistic that you’ll occasionally see discussed or cited.

But you rarely see Luck’s completion split into (a) 10 yards through the air, and (b) 15 yards after the catch by his receiver. Brian Burke calls those 10 yards “Air Yards” and I think that is a pretty useful moniker. The question is, what do you do with Air Yards? Luck led the NFL in Air Yards per completed pass last year (8.0), but that doesn’t make the statistic an indicator of quality. Tim Tebow’s 2011 performance produced the highest single-season Air Yards per completion average since 2006 (8.9), while Jake Delhomme (2008) and Derek Anderson (2010) each have led the league in that metric, too. Air Yards per completed pass is a very useful way to describe a player’s style, but you can’t use it alone to determine a player’s quality.

One question I have: Are Air Yards more repeatable for a quarterback than the yards he gains via his receivers’ YAC? It’s important to keep that question separate from this one: Is a quarterback who has a high number of air yards and a low YAC better than a quarterback in the opposite situation? Today, I plan to focus on the first question, but let’s take a second to address the second one.

According to ESPN’s research, yards after the catch is more about what the receiver does than the quarterback. As a result, a completion that is in the air for 40 yards is better for a quarterback’s ESPN QBR than a pass that is in the air for 5 yards on which the receiver runs for 35 yards after the catch. That makes sense, I suppose, and I suspect that’s probably true more often than not. The easiest counterargument is to point to Joe Montana, and say that what made Montana great was his pinpoint accuracy that enabled players like Jerry Rice to rack up big YAC numbers.I’m going to put off any further analysis of how much of YAC should be attributed to the quarterback and how much to the receiver, because it’s pretty complicated. One thing that is a bit easier to analyze is how “sticky” Air Yards are from year to year.
[continue reading…]

{ 25 comments }

Throwing deep against Charles Tillman can be hazardous to your passer rating

Throwing deep against Charles Tillman can be hazardous to your passer rating.

Last off-season, I produced an exhaustive analysis of fumble recovery rates. With 13 years of play-by-play data at my disposal, I thought it would be worthwhile to take a closer look at interceptions. You can skip to the results section if you like, but let me start with a few disclaimers.

Interceptions are tricky to analyze. Interception rates are very inconsistent from year to year, so much so that completion percentage alone may be a better predictor of future interception rate than actual interception rate. But putting aside randomness, there are two other big factors that determine interception rates: the score in the game and the length of the throw.

Just about every quarterback will throw more interceptions when his team is trailing in the fourth quarter. Situation plays a huge role in football, and that’s true when it comes to interception rates, too. Similarly, quarterbacks are much more likely to be intercepted on deep passes than short ones. One thing I wanted to look at was how much league-wide interception rates varied over a wide range of circumstances.

Unfortunately, there still is a bit of bias in the data. The best quarterbacks are most likely to be winning and the worst quarterbacks are most likely to be losing. That means to the extent that trailing teams throw more interceptions than leading teams, the results are probably slightly overstated. Still, I think getting a sense of the league baseline over hundreds of thousands of throw — even if not evenly distributed — can be a useful exercise.

The Results

From 2000 to 2012, there were 6,689 interceptions thrown. Here’s the breakdown with respect to the points differential (i.e., points scored minus points allowed) for the offensive team immediately before the interception. For example, teams trailing by more than four touchdowns have thrown 110 interceptions over the last 13 regular seasons. That accounts for 1.6% of all interceptions thrown over that time period:
[continue reading…]

{ 15 comments }

Still the king

Still the king.

Yesterday, I looked at the career leaders in 4th quarter (and overtime) game-winning touchdowns from scrimmage. Today I will do the same thing for passing touchdowns.

As a reminder: tracking things like game-winning touchdowns is only interesting in a trivial sort way. I looked at all games, regular and postseason, in all leagues, from 1940 to 2012, and counted all touchdowns scored that put the player’s team ahead for good (with one exception: I did not count touchdowns scored when down by 7 and the team successfully went for two afterwards). The table below shows all players with at least 4 such game-winning touchdown passes. It won’t do much to settle the Brady/Manning debate.
[continue reading…]

{ 2 comments }

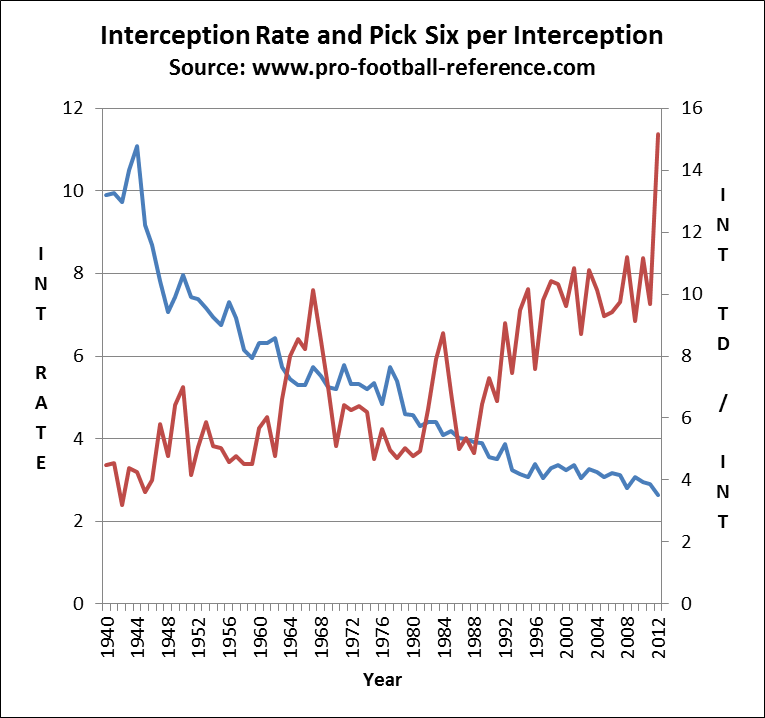
Good bit of trivia from my buddy Scott Kacsmar: there were 71 interceptions returned for touchdowns in 2012, the highest number in NFL history. Another interesting fact about the 2012 season: just 2.6 interceptions were thrown per 100 attempts, the lowest figure in NFL history.

We already know that the league-wide interception rate has been rapidly decreasing for years, but the significant increase in interceptions returned for touchdowns per interception is an under-reported story. Last year was the year of the Pick Six, but the Pick Six rate (INTs returned for touchdowns per interception) has been on the rise for several years. The graph below shows both the interception rate (100*INTs/Att) in blue (and measured against the left vertical axis) and the Pick Six rate (100*INT TDs/INT) in red (and measured against the right vertical axis):

Pick Six rate
[continue reading…]

{ 16 comments }

Russell Wilson is too awesome for snide comments.

Russell Wilson is too awesome for snide comments.

Since 1990, there have been 48 rookie quarterbacks that threw at least 224 pass attempts, the necessary amount to qualify for the league’s efficiency ratings. There are many conventional ways to measure rookie quarterbacks, but the off-season lets us play around with more obscure measures.

For example, have you ever considered how rookie quarterbacks performed compared to how their teams passed in the prior year? David Carr, Tim Couch, and Kerry Collins took over expansion teams, but we can compare the passing stats of the other 45 rookie quarterbacks to the team stats from the prior season. To compare across eras, I am grading each individual and team relative to the league average each season.

Let’s start with Net Yards per Attempt. Ben Roethlisberger averaged 7.41 NY/A in 2004 when the league average was 6.14; therefore, Roethlisberger was at 121% of league average. Meanwhile, the 2003 Steelers under Tommy Maddox were at 99% of league average. For each of the 45 rookie quarterbacks, I plotted them in the graph below. The Y-axis shows how the quarterback performed as a rookie, while the X-axis shows how his team performed in the prior season. Because it makes sense to think of “up and to the right” as positive, the X-axis goes in reverse order. Take a look – I have an abbreviation for each quarterback next to his data point:
[continue reading…]

{ 2 comments }

Trivia of the Day – Sunday, February 17th

Those are some clutch shirts

Those are some clutch shirts.

We all know that Tom Brady set the single-season passing touchdowns record in 2007, when he threw 50 touchdowns as the New England Patriots went 16-0. That broke Peyton Manning‘s mark of 49 touchdowns in 2004. And I think most of us know that prior to Manning, Dan Marino had set the NFL record with 48 touchdowns in 1984.

Marino’s touchdown record stood for 20 years, but do you know who held the record before Marino? Believe it or not, the previous record stood for even longer. Before we get to the hints, here are two freebies.

The quarterback still holds his franchise’s record for passing touchdowns in a season. And he is the last quarterback to set the single-season passing touchdowns record twice in his career.

Trivia hint 1 Show


Trivia hint 2 Show


Trivia hint 3 Show


Click 'Show' for the Answer Show

{ 6 comments }

There have been 35 quarterbacks in NFL history to throw for at least 30,000 yards. Given enough time, you could probably guess that Drew Bledsoe, Jim Kelly, and Steve McNair are three of them. All three have something else in common: they were all born on February 14th.

If we drop the cut-off to 16,000 yards, we jump to 125 quarterbacks but get to include David Garrard, another Valentine’s Day baby. With 366 possible birthdays, it’s pretty incredible that four out of a random group of 125 people would have the same birthday. Consider that no one born on any the following seven days — January 30th, March 4th and 30th, April 9th and 13th, and June 12th and 21st — has ever gained a single passing yard in NFL history. [1]Even February 29th has a couple of representatives, led by Dick Wood and his 7,153 passing yards.

But wait, there’s more: If we drop the threshold to 3,500 passing yards, we get to include Patrick Ramsey and Anthony Wright. Those guys may not impress you, but consider that only 310 players have thrown for 3,500 yards. That means dozens of days have zero quarterbacks with 3,500 yards, so slotting in Ramsey and Wright as QB5 and QB6 on your birthday dream team is pretty damn good. February 13th, for example, has Jim Youel as its top passer, and he only collected 849 yards. Yesterday’s number two slot goes to the greatest receiver of all-time to ever play with Aaron Brooks (106 yards), outpacing Drew Henson and his 98 career yards. Clearly, passing yardage is for lovers. [2]Long-time readers will recognize that this post is a blatant ripoff of Doug’s classic Passing Yardage is for Lovers, published five years ago to the day.
[continue reading…]

References

References
1 Even February 29th has a couple of representatives, led by Dick Wood and his 7,153 passing yards.
2 Long-time readers will recognize that this post is a blatant ripoff of Doug’s classic Passing Yardage is for Lovers, published five years ago to the day.
{ 17 comments }

The predictive value of target data

Demaryius Thomas made the most of his targets in 2012.

Demaryius Thomas made the most of his targets in 2012.

In 2007, Doug Drinen and I wrote a pair of articles discussing our views on targets. I’m working on a wide receiver project this off-season, and a complete discussion of receiving statistics includes a discussion of targets.

Let me start with the prevailing few: targets are important, and if two receivers have the same production on a different number of targets, the one who produced on fewer targets is better/more valuable. Similarly, if all else is equal, the receiver with a higher catch rate — calculated as catches/target — is the better/more valuable one.

There are some problems with the prevailing view. By placing targets in the denominator of a formula, we’re implying that targets are a bad thing, or at a minimum, an opportunity wasted. But targets aren’t like pass attempts. Pro Football Focus has a stat called yards per pass route run, and that actually is the receiver version of yards per pass attempt. [1]Unfortunately, yards per pass route run is not going to help us if we want to grade receivers on a historical basis.

But targets don’t help identify the player who deserves blame: on a random incomplete pass, assume three receivers are running routes, and one of them is targeted. Absent a drop, I have a hard time saying that of the three wide receivers, the targeted one did the worst of the three. If we grade a receiver by his yards per route run, each receiver is equally penalized with one route run on the play; if we grade a receiver by yards per target, the two wide receivers that did not get open are not penalized, while the one that was targeted is penalized. That seems fundamentally wrong to me.

Here’s another problem: In a broad sense, the player with more targets (or percentage of his team’s targets) is in a very real sense a bigger part of his team’s offense. Either he’s open more often, or the quarterback is throwing in his direction even when he’s not open (whether because the coaches call more plays for him or because he’s earned the quarterback’s trust). In any event, the target itself is an indicator of quality, and penalizing a player — which is what you do when you place targets in the denominator — for an event that is highly correlated with quality is not something I’m comfortable doing.
[continue reading…]

References

References
1 Unfortunately, yards per pass route run is not going to help us if we want to grade receivers on a historical basis.
{ 12 comments }
Next Posts Previous Posts