≡ Menu

Flaccoing?

Flaccoing?

In September, I started a post by asking you to make this assumption:

Assume that it is within a quarterback’s control as to whether or not he throws a completed pass on any given pass attempt. However, if he throws an incomplete pass, then he has no control over whether or not that pass is intercepted.

If that assumption is true, that would mean all incomplete pass attempts could be labeled as “passes in play” for the defense to intercept. Therefore, a quarterback’s average number of “Picks On Passes In Play” (or POPIP) — that is, the number of interceptions per incomplete pass he throws — is out of his control.

After doing the legwork to test that assumption, I reached two conclusions. One, interception rate is just really random, and predicting it is a fool’s errand. Two, using a normalized INT rate — essentially replacing a quarterback’s number of interceptions per incomplete pass with the league average number of interceptions per incomplete pass — was a slightly better predictor of future INT rate than actual INT rate. It’s not a slam dunk, but there is some merit to using POPIP, because completion percentage, on average, is a better predictor of future INT rate than current INT rate.

So, why am I bringing this up today, at the start of Super Bowl week? Take a look at where Sunday’s starting quarterbacks ranked this year in POPIP (playoff statistics included, minimum 250 pass attempts):
[continue reading…]

{ 14 comments }

Want to see how passing has changed in the NFL over the last 63 years? A picture is worth at least 1,000 words in this case. The graph below shows the number of interceptions per dropback (red), sacks per dropback (purple), non-INT incomplete passes per dropback (yellow) and completions per dropback (green). Of course, a dropback is simply a pass attempt or a sack. The information is stacked on top of each other for ease of viewing.

pdist2
[continue reading…]

{ 6 comments }

In October 2009, Neil Paine wrote that Eli Manning had seemingly turned the corner, starting with the five-game stretch from week 17 of the 2007 season that ended in the Super Bowl. And since that post, Manning has been even better, with his 2011 season standing out as the best year of his career. I thought it would be fun to chart Eli’s career game-by-game according to ANY/A. Actually, since that chart would be incredibly volatile, I’m going to do it in five- and ten-game increments.

The chart below shows the average of Manning’s ANY/A in each of his last five games (playoffs included) beginning with the fifth game of his career in 2004. Of note: the black line represents the league average ANY/A (which, if we’re talking about the last 2 games of Year N and the first 3 games of Year N+1, is 40% of the Year N league average and 60% of the Year N+1 league average), and the two big purple dots show the two Super Bowl victories (or, more accurately, the Super Bowl win, the prior three playoff wins, and the week 17 game).

weekly ELI
[continue reading…]

{ 1 comment }

Is Joe Flacco elite?

Just a guess, but I think that question will be asked quite a few times over the next couple of weeks. While the inanity of the discussion that usually follows that question is not something I wish to emulate, there’s no particular reason not to take an in-depth look at Flacco’s career. The table below shows Flacco’s performance in six key metrics — all relative to league average (1.00) — for each season of his career:

Flacco career

As you can see, with the exception of his great interception rate — which justifies its own post during this pre-Super Bowl period — Flacco’s career performance has been rather average. His touchdown rate, like those of many quarterbacks, has bounced up and down throughout his career. His sack rate was below average during his first three years, improved significantly in 2011, and landed right at the league average in 2012.

ELITE

That is an elite Fu Manchu.

In the three main statistics — Y/A, NY/A, and ANY/A — Flacco has consistently finished in a tight window around the league average. His ANY/A has been slightly better than his NY/A thanks to that lofty interception rate, but suffice it to say Joe Flacco is, and has been for years, a league average quarterback.

If we look at ESPN’s Total QBR, Flacco ranked 27th as a rookie in 2008, 15th in 2009, and 12th in 2010, signaling a young quarterback improving and on the rise. In 2011, he ranked 14th, perhaps signaling a leveling off, and then this past season, he finished 25th. The positive spin would be that he’s a league-average quarterback, and the negative one (at least prior to this post-season) would have been that he was regressing.

On the other hand, here is how Flacco has performed in the playoffs in each game, as measured by AY/A:

[continue reading…]

{ 12 comments }

Is this a thinly-veiled Brady/Manning post?

Is this a thinly-veiled Brady/Manning post?

Last weekend, I looked at career rushing stats in wins and losses; today I will do the same but for quarterbacks.

I looked at all games, including playoffs, from 1960 to 2011, for all quarterbacks with at least 5,000 career passing yards over that time period. The table below lists the following information for each passer:

– His first year (or 1960, if he played before 1960) and his last year (or 2011, if still active)
– All the franchises he played for (which you can search for in the search box)
– His number of career wins, and his touchdown rate, interception rate, yards per attempt and Adjusted Yards per Attempt (which includes a 20-yard bonus for touchdown passes and a 45-yard penalty for interceptions) in wins [1]Unfortunately, I excluded sack data from this study due to its general unavailability for most of the covered time period.
– His number of career losses, and his touchdown rate, interception rate, yards per attempt and Adjusted Yards per Attempt in losses

The table is sorted by AY/A in wins; unsurprisingly, Aaron Rodgers — who is the career leader in that metric — tops this table, too. In fact, Rodgers is also the leader in AY/A in losses. Note that this table includes all games played by the quarterback, not just his starts.


[continue reading…]

References

References
1 Unfortunately, I excluded sack data from this study due to its general unavailability for most of the covered time period.
{ 0 comments }

I’ve been on a major QB kick lately, and there’s no reason to stop now. Today, I want to look at a method that might tease out a quarterback’s “true talent” better than if we simply use his raw stats from the season.

Three years ago, our colleague Jason Lisk had a post on the old PFR Blog about which rate stats stay consistent when a QB changes teams. Basically, he grabbed QBs who were still in their primes and changed teams, looking at how their key rate stats correlated from one year to the next. Here’s what Jason found:

[…]I looked at the correlation coefficient for our group of 48 passers, for the year N advanced passing score compared to the year N+1 advanced passing score in each category. This should tell us whether the passers who were good in a performance area (or bad) tended to be the ones who remained good in that performance area the following season, even with the uncertainty of team changes (some positive, some negative for the quarterback).

Sack Percentage:  0.31
Completion Percentage: 0.25
Yards Per Attempt:  0.20
Touchdown Percentage: 0.12
Interception Percentage: 0.10

What do those correlations mean, exactly? Well, take sack percentage as an example. In general, a correlation of 0.31 means you can expect 31% of a QB’s difference from the mean to be repeated next year when he changes teams. In other words, you have to regress the QB’s sack rate 69% towards the mean to get the true rate that “belongs” to him. If the average sack rate is 6.1%, and a QB has a rate of 4.0% (like, say, Drew Brees this year), his “true” sack rate is probably something like 5.4% — 31% of the distance between .061 and .040.

The same concept applies to the other stats listed above. Tony Romo’s observed 66.7% completion percentage is really more like 62.5% after regressing to the mean, and so forth. Do that for every QB who had a reasonable number of attempts this year, and you get these rate stats:

(“A-” before a stat means the actual observed rate; “R-” means the regressed rate.)

Now we just need to reconstruct the player’s raw passing line as though he posted those rate stats instead of his actual rates. Cmp%, YPA, TD%, and INT% are easy (just multiply by attempts), and Sack% can be derived via simple algebra:

Sacks_new = (-reg_sk% * Attempts) / (reg_sk% – 1)

(Sack yards can be assumed by multiplying raw sack yards per sack by the new sack total.)

Finally, we plug the new totals into the Adjusted Net Yards Per Attempt formula, and we have a QB stat that is sort of like baseball’s Fielding Independent Pitching (FIP), which also seeks to reduce the noise and teammate interactions in a pitcher’s ERA by reducing his performance to only those elements he has control over — strikeouts, walks, and home runs.

Here are the 2012 leaders in QB-FIP (along with their regressed totals):

{ 3 comments }

These guys are pretty good.

These guys are pretty good.

After posting about SRS-style quarterback ratings on Monday, I was thinking about other things we can do with game-by-game data like that. In his QBGOAT series, Chase likes to compare QBs to the league average, which makes a lot of sense for all-time ratings — you want to reward guys who are at least above-average in a ranking like that. However, if we want seasonal value, perhaps average is too high a baseline.

Over at Football Outsiders, Aaron Schatz has always compared to “replacement level”, borrowing a concept from baseball. I like that approach, but replacement level can be hard to empirically determine. So for the purposes of this post, I wanted to come up with a quick-and-dirty baseline to which we can compare QBs.

To that end, I looked at all players who were not their team’s primary passer in each game since 2010. Weighted by recency and the number of dropbacks by each passer, they performed at roughly a 4.4 Adjusted Net Yards Per Attempt level. This is not necessarily the replacement level, but it does seem to be the “bench level” — i.e., the ANYPA you could expect from a backup-caliber QB across the league.

Using 4.4 ANYPA as the baseline, we get the following values for 2012:

If we weigh each game by how recent the results took place, we get this list:

This kind of thing isn’t exactly the most advanced stat in the world, but it’s pretty good if you want to sort QBs into general groups based on how good they are (the assumption being that a player who never plays is implicitly a bench-level player by definition).

{ 2 comments }

Every hand in the Jets passing game is to blame

Not Don Coryell.

It’s a special edition of Saturday rant day at Football Perspective.

I’m no Mark Sanchez apologist. But that doesn’t mean he’s the only one to blame for the Jets’ passing game struggles.

The Supporting Cast

Jeremy Kerley, Dustin Keller, Chaz Schilens, Stephen Hill, and Jeff Cumberland are the team’s leading receivers. Clyde Gates has started two games at wide receiver. Kerley would be a great #3 receiver, but he’s the Jets #1. Schillens and Gates are best left as fifth receivers, while Stephen Hill is incredibly raw and has struggled most of the year. Keller would be a good tight end on a good passing offense, but is overmatched as the team’s #2 target. I don’t think anyone would disagree that the Jets’ receivers (including stone-hands Shonn Greene) rank in the bottom five of the league.

Mike Tannenbaum

Tannenbaum has come under heavy criticism from Jets fans of late. While I think much of that is probably unfair, there are several areas to point the finger at Tannenbaum — starting with drafting Sanchez in the first place. The Jets general manager listens to eternal optimist Ryan too much when it comes to personnel decisions, which led the Jets to start Wayne Hunter at right tackle last year and enter the pre-season with him, somehow, still entrenched at the spot. The Vlad Ducasse pick has been a bust, leaving Matt Slauson to cover at left guard (you know, when he’s not being rotated out of the game). Trades for Braylon Edwards and Santonio Holmes yielded immediate dividends, but have only added to the disruption in the locker room without helping the 2012 version of the team. Sanchez is playing with one of the worst supporting casts in the league, so the man who picks the talent certainly bears some of the blame.

Rex Ryan

There are very few head coaches who are excellent on both sides of the ball, but Rex Ryan is one of the most specialized head coaches in the NFL. He’s a defensive mastermind — no doubt about that — but he’s as helpless on offense as he is strong on defense. He vowed this year to get more involved in the offense, which should start sending red flags to begin with since 2012 is his fourth season as head coach of the team. To the extent that he has been more hands on in 2012, the results aren’t any better.

Perhaps Ryan is the mirror image of a Gary Kubiak, who took awhile to find the right man to run the other half of his team. But from the standpoint of developing a quarterback, Ryan may even be counterproductive. The red light-yellow light-green light system he gave Sanchez in his rookie season was Ryan’s first attempt to right the ship and a sign of what the coach expects out of the quarterback position. The bottom line is Ryan is focused on playing good defense and running the ball, and as long as his quarterback doesn’t mess up, he thinks his team will win. That’s not the ideal environment for a young quarterback to blossom in, and we learned exactly what Rex thinks about his quarterback when this off-season he chose to hire as his offensive coordinator…

Tony Sparano (hat tip, Brian Schottenheimer)
[continue reading…]

{ 3 comments }

So you're telling me they were 1-15 last year?

An old friend of mine was always mildly irked at the praise thrown at Bill Parcells for turning around moribund franchises. In reality, making a team with a terrible record respectable isn’t all that challenging. Where Parcells added value was in making his good teams great, not in making terrible teams mediocre.

In 1992, one year B.P., the New England Patriots were 2-14, in part thanks to a 1-5 record in one-score games. Throw in some regression to the mean and the first pick in every round of the ’93 draft, and going 5-11 in 1993 wasn’t so much of an accomplishment as it was pre-ordained.

In 1996, one year B.P., the Jets went 1-15. New York was a horrific 0-7 in one-score games. Throw in the #1 pick in every round, and they were an attractive target. Parcells did do a masterful job cleaning up the mess left by Rich Kotite, but getting them to 9-7 looked very impressive in large part thanks to the poor fortunes of the team the prior year.

The Big Tuna again went after the low-hanging fruit again when he took over as the Executive Vice President of Football Operations in Miami (it is here my old friend would get particularly annoyed, noting that Parcells found a way to have his cake and eat it too. If the Dolphins succeeded, Parcells would have “done it again.” Had they failed, well, he wasn’t the coach.) He took over a 1-15 team that was bad but not 1-15 bad; they had faced one of the harder schedules in the league and gone 1-6 in close games. Enter Jake Long, Chad Pennington, and the Wildcat, and the Dolphins went 11-5. Parcells did it again!

In any event, that’s just background. The 2013 Panthers are the real topic today — and they are the lowest hanging fruit any potential coach has seen in decades. Consider:

  • The Panthers are currently 3-9, and little is expected of them going forward. They are now just 9-19 in the Cam Newton era.
  • Despite that, Carolina ranks 4th in Brian Burke’s Advanced NFL Stats efficiency ratings. Now maybe they aren’t the 4th best team in the league, but Brian’s system is purely predictive and minimizes events that shape our views but are unlikely to impact future records. I have no doubt that they’re closer to the 4th best team in the league than the 4th worst, which is where they are by record.
  • Football Outsiders ranks Carolina 18th — which, by the way, still means they’re much better than their record — but even that is misleading. Schatz ranks Carolina 32nd in special teams — a unit that Burke ignores — but instead has them 15th in offensive DVOA and 14th in defensive DVOA. That means excluding special teams the Panthers are above average, and special teams performance is notoriously fickle.
  • So why are the Panthers 3-9? Carolina is currently 0-7 in one-score games.

There’s an even simpler way to show how the Panthers are massively underachieving this year. Net yards per attempt isn’t the only stat in the world, but it’s one of the most important indicators of an offense’s effectiveness. Net yards per attempt is just as important on defense; NY/A differential, the difference between how many net yards you gain per offensive attempt and how many you allow per defensive attempt, is a simple shorthand to highlight the best in the league. Here are the results through 13 weeks (i.e., not counting last night’s game):
[continue reading…]

{ 11 comments }

Scott Kacsmar has been keeping track of 4th quarter comebacks and game-winning drives for some time. As a technical matter, Greg McElroy earned both a 4th quarter comeback and led a game-winning drive in his first game ever yesterday. How rare is that?

The table below shows all the quarterbacks to lead 4th quarter comebacks and game-winning drives. Some of these, like Brian St. Pierre’scomeback win” — and to a large extent, McElroy’s 4QC/GWD — are far from laudable. Still, here is the list:

{ 1 comment }

Ranking NFL quarterbacks by how much ‘it’ they have

Yep, that's it.

2) Tom Brady, New England Patriots. Until further notice, nobody has more ‘it’ than Tom Brady, who has been overflowing with ‘it’ since his first year as a starter. He’s the only active quarterback with three Super Bowl rings. However, since he has lost two Super Bowls to Eli Manning, I guess Manning has more “it.” So…

1) Eli Manning, New York Giants. If to be the man you have to beat the man, well, Eli Manning is now the man. Nobody has ‘it’ in the 4th quarter quite like Eli, which is when ‘it’ becomes really important.

3) Peyton Manning, Denver Broncos. If ‘it’ was Tapenade, Manning would be first on the list.

4) Ben Roethlisberger, Pittsburgh Steelers. With two Super Bowl rings, Roethlisberger arguably has more ‘it’ than Manning, but to be fair, Peyton Manning does hold the record for the most 4th quarter comebacks.

5) Drew Brees, New Orleans Saints. Despite gaudy numbers, Brees kind of doesn’t have that much ‘it’, in my opinion. But I’m not sure who else could go ahead of him.

6) Aaron Rodgers, Green Bay Packers. The last of the quarterbacks with rings, as Rodgers has one of the worst records in history when it comes to 4th quarter comebacks.

7) Tim Tebow, New York Jets. Without question, in possession of more ‘it’ than any quarterback without a Super Bowl ring, and maybe even more than some of the ones who do.

8) Alex Smith, San Francisco 49ers. This dude is loaded with ‘it’ and grit and teammates that hit. He went about 20 games without throwing an interception and he nearly completed more than 100% of his passes a couple of weeks ago.

9) Joe Flacco, Baltimore Ravens. If ‘it’ is Ray Lewis, Haloti Ngata, Ray Rice, Lardarius Webb, and Ed Reed, then Joe Flacco has had ‘it’ in spades for years. Let’s not forget he outplayed Mr. It in the AFC Championship Game last year, a particularly notable feat since both quarterbacks were playing against identical defenses.

10) Robert Griffin III, Washington Redskins. It doesn’t matter that his team loses, he has ‘it’ until the first game he struggles in 2013.
[continue reading…]

{ 8 comments }

Quarterback performance on third and fourth downs

So far this season, teams have converted on 37.2% of all pass plays on third or fourth downs. Looking at success rates on these downs helps to identify which quarterbacks are keeping drives alive for their teams and coming through in the most important situations. For example, Peyton Manning leads the league with an impressive 52.6% rate. How impressive is that?

The table below lists the conversion rates for quarterbacks on passing plays (excluding scrambles) on third and fourth downs; the table is sorted by the far right column, which shows how many third downs over average each quarterback converted. This is calculated by subtracting from the number of actual conversions the number of expected conversions (which is 37.2% multiplied by the number of third down plays):

[continue reading…]

{ 3 comments }

For years, I was an unabashed Philip Rivers supporter. I had no preexisting affinity for the Chargers or Rivers, but in all the metrics I care about, Rivers was always one of the best. In 2008, 2009, and 2010, Philip Rivers led the league in yards per attempt. He finished first in ANY/A in ’08 and second in ’09 and ’10; he finished second in NY/A in ’08 and then first in NY/A in 2009 and 2010. Simply put, going into the 2011 season, no quarterback had been better over the last three years.

Rank Player Tm Gms Cmp Att Cmp% Yds TD Int Rate Sk Y/A SkYds AY/A ANY/A Y/G
1 Philip Rivers SDG 48 986 1505 65.5% 12973 92 33 103.8 88 8.62 545 8.86 8.02 270.3
2 Tom Brady NWE 33 702 1068 65.7% 8374 64 17 102.9 41 7.84 261 8.32 7.78 253.8
3 Drew Brees NOR 47 1224 1807 67.7% 14077 101 50 98.1 58 7.79 412 7.66 7.20 299.5
4 Aaron Rodgers GNB 47 1003 1552 64.6% 12394 86 31 99.4 115 7.99 730 8.20 7.19 263.7
5 Tony Romo DAL 35 771 1213 63.6% 9536 63 30 94.8 61 7.86 360 7.79 7.13 272.5
6 Matt Schaub HTX 43 1012 1537 65.8% 12183 68 37 94.7 80 7.93 524 7.73 7.02 283.3
7 Peyton Manning CLT 48 1214 1805 67.3% 13202 93 45 95.4 40 7.31 251 7.22 6.93 275.0
8 Kurt Warner CRD 31 740 1111 66.6% 8336 56 28 95.2 50 7.50 354 7.38 6.75 268.9
9 Ben Roethlisberger PIT 43 858 1364 62.9% 10829 60 32 92.5 128 7.94 852 7.76 6.53 251.8
10 Eli Manning NYG 48 945 1527 61.9% 11261 79 49 88.3 73 7.37 507 6.97 6.33 234.6
11 Donovan McNabb TOT 43 887 1486 59.7% 10846 59 36 85.4 95 7.30 684 7.00 6.15 252.2
12 Matt Ryan ATL 46 885 1456 60.8% 10061 66 34 86.9 59 6.91 354 6.77 6.27 218.7
13 Kyle Orton TOT 43 901 1504 59.9% 10427 59 33 84.8 90 6.93 562 6.73 6.00 237.0
14 Joe Flacco RAV 48 878 1416 62.0% 10206 60 34 87.9 108 7.21 788 6.97 5.96 212.6
15 Brett Favre TOT 45 923 1411 65.4% 10183 66 48 88.1 86 7.22 599 6.62 5.84 226.3
16 Jay Cutler TOT 47 981 1603 61.2% 11466 75 60 82.9 98 7.15 625 6.40 5.67 244.0
17 Matt Cassel TOT 45 860 1459 58.9% 9733 64 34 83.9 115 6.67 644 6.50 5.62 211.6
18 David Garrard JAX 46 885 1417 62.5% 9951 53 38 84.7 117 7.02 777 6.56 5.56 216.3
19 Jason Campbell TOT 44 836 1342 62.3% 9250 46 29 85.1 114 6.89 759 6.61 5.57 205.6
20 Carson Palmer CIN 36 719 1181 60.9% 7795 50 37 81.4 63 6.60 481 6.04 5.34 216.5
21 Ryan Fitzpatrick TOT 33 603 1040 58.0% 6327 40 34 74.9 83 6.08 465 5.38 4.57 175.8
22 Matt Hasselbeck SEA 35 668 1141 58.5% 7246 34 44 71.2 80 6.35 503 5.21 4.46 207.0

[continue reading…]

{ 14 comments }

Wins with quarterbacks drafted by that team

Good stat today by ESPN’s Adam Schefter, who notes that Kansas City has gone 25 years without winning a game with a quarterback drafted by the Chiefs. This Todd Blackledge-led victory over the Chargers in 1987 was the last time a quarterback drafted by the Chiefs won a game in red and gold.

That’s remarkable, but as always, we need context. The table below looks at all team wins from 1988 to 2012 and shows how many games were won by a quarterback drafted by that team. Note: For purposes of this post, I’m considering John Elway, Jim Everett, Kelly Stouffer, Eli Manning, and Philip Rivers as having been drafted by the Broncos, Rams, Seahawks, Giants, and Chargers, respectively. Additionally, quarterbacks drafted before 1988 count, but only their wins starting in 1988 count for purposes of the table below. The last two columns show, for each, the quarterback with the most wins among those quarterbacks drafted and not drafted by that team.

As bad as the Chiefs record has been, the Saints record isn’t any better. In fact, since Archie Manning’s last game for the Saints, New Orleans has only drafted two quarterbacks – Dave Wilson and Danny Wuerffel – who have started and won a game for the team. JaMarcus Russell couldn’t even break the Raiders list, ending his career with seven wins. Two other interesting notes. Tony Romo is the only undrafted quarterback in the league currently starting. And of the 32 starting quarterbacks, three of them — Michael Vick, Matt Schaub, and Matt Ryan — were drafted by the Falcons.

{ 7 comments }

Have you taken a look at a passing leaderboard lately? Here’s the PFR passing leaderboard sorted by ANY/A; as always, all columns are sortable.


[continue reading…]

{ 1 comment }

More work on POPIP and predicting INT rates

A couple of weeks ago, I wrote about interceptions per incompletion, or POPIP. In that article I showed how a player’s completion percentage is a better predictor of his future interception rate than his actual interception rate. And in this article by Brian Burke, one comment stuck with me:

Griffin has thrown deep, defined as attempts of greater than 15 yards through the air, on only 13% of his attempts, 30th among league quarterbacks. This is also likely the largest factor in his very low interception rate.

That makes sense — quarterbacks throwing short, safe passes should throw fewer interceptions. But this statement is a more important one than you might originally think, thanks to some great research by Mike Clay.

Clay came up with a metric he calls ‘aDOT’ — average depth of target — which measures exactly what you think it does. For each targeted or aimed pass, Pro Football Focus tracks how far from the line of scrimmage the intended target is. What’s makes this stat particularly appealing to me is that it’s very predictable as far as football statistics go. That’s not all that surprising because aDOT is based on a large sample of plays and basically frames how an offense operates.

Clay posted the 10 passers with the largest and smallest aDOT in 2011, which I’ve reproduced below. Note that there are some passes — spikes, throwaways, passes tipped at the line (these are grouped together as ‘other’) — with no target, and therefore are excluded when calculating aDOT. In the far right column, I’ve shown how the player’s aDOT compares to the league average rate of 8.8.

[continue reading…]

{ 2 comments }

One of the most difficult decisions an organization has to make is when to admit its mistakes. The Jaguars drafted Blaine Gabbert with the 10th overall pick in 2011, and his lack of success is even more striking when compared to the rest of the top dozen selections:

Last year, there were three legitimate excuses the Jaguars could proffer to defend Gabbert’s play: he was a rookie, the lockout prevented him from getting proper training, and Jacksonville had the worst set of receivers in the league. Giving up on a first round quarterback after just one season would be silly, especially one where the expectations were that the rookies would struggle. And the cupboard was bare: Jacksonville became the first team since the 2004 Ravens and only the 5th team in the previous 20 seasons to not have a 500-yard wide receiver, so it’s not like Gabbert had a lot to work with. [1]Of course, there is the obvious “chicken or the egg” question involved there. The other four teams on that list? The 2004 Ravens (Kyle Boller), 2003 Lions (Joey Harrington), 1997 … Continue reading

But through five games, little has changed in Jacksonville. The Jaguars should wait to evaluate Gabbert’s career — five games into his second season isn’t a fair sample size — but his production so far have been extremely disappointing:

A few years ago, Jason Lisk wrote this post on when the Lions should have given upon Joey Harrington. One of the most relevant points of that article was Lisk’s supposition

that teams are far more likely to commit errors of holding on to a quarterback for too long, while rarely giving up on a quarterback too early — once they have seen him play any amount of time in a real NFL game. I can think of examples of quarterbacks who were drafted, never started for their original team, and found success elsewhere, but its relatively rare to find a quarterback who started but never had success with his original team, and moved elsewhere to have his first breakout.

There were 70 quarterbacks selected in the first round of NFL drafts between 1978 and 2010. How often did a team give up too early on a good quarterback? [2]Note that for purposes of this post, I am considering Eli Manning, Philip Rivers, Jim Everett, and John Elway as being drafted by the Giants, Chargers, Rams and Broncos. Vinny Testaverde had success outside of Tampa Bay, but the Bucs didn’t give up “early” on him by any means; he played for six years in Tampa with with varying levels of success. The team did give up too early on Steve Young, although he wasn’t included in this study because he was selected in the supplemental draft. Jim Harbaugh had success in Indianapolis, but it’s not like the Bears didn’t know what they had: Harbaugh was in Chicago for the first seven years of his career.

Jeff George had good years outside of Indianapolis, but I wouldn’t say the Colts gave up early on him. He was inconsistent for four years and caused problems off the field; he was finally traded in connection with a holdout. Mike Vick has had success in Philadelphia, but the Falcons obviously had their hands forced when they gave up on him. Ditto Kerry Collins, whose off the field issues left the Panthers with little choice.

With the exception of Steve Young, who Tampa traded after two years — and who may not have ever turned into a star quarterback in Tampa Bay — you’d be hard pressed to find any examples of teams giving up on first round picks too early (with the exception of those released/traded for nonfootball reasons). Chad Pennington had one great year in Miami, but that was after a long career in New York. Doug Williams and Trent Dilfer won Super Bowls with other teams, but Tampa Bay didn’t give up on either quarterback too early by any reasonable definition of the phrase. The reality is, teams will do just about everything before giving up on a first round quarterback too early and as a result, take way too long to move on from a bad investment. And while teams are (understandably) deathly afraid of giving up on a highly drafted quarterback too early, they’re more likely to harm themselves by waiting to move on for too long on a bad investment.

Through six weeks, NFL teams are averaging 6.44 NY/A, meaning Gabbert is averaging only 67% as many net yards per attempt as the average passer. How does that compare historically? The table below shows all drafted quarterbacks who threw at least 250 passes in their second season, and lists their NY/A and NY/A relative to league average during their sophomore years:

If your quarterback plays poorly in his second year, you’re basically hoping he’s Phil Simms (who had his first strong season at age 30) or the good version of Jeff George. Maybe Sam Bradford or [gasp] Tim Tebow, will also become solid starters in the NFL one day. But that’s only one part of the equation, and it’s the minor half. You could have the next Akili Smith or Kyle Boller or David Klingler or Colt McCoy or Rick Mirer or Cade McNown or Joey Harrington, too.

You might think it’s far better to wait a year too long with a first round investment than to cut bait a year too early. Tell that to the Ravens, who after two years of Kyle Boller, chose to wait it out in the 2005 draft and selected Mark Clayton over Aaron Rodgers (why take Rodgers, Cal quarterbacks are terrible!). Detroit selected Joey Harrington with the third pick in the 2002 draft, but as Lisk noted, Detroit could have reasonably “given up” (more on this in a second) on Harrington by the end of the 2003 season. The Lions did not, and selected Roy Williams in the 2004 draft instead of say, Ben Roethlisberger.

And “give up” doesn’t necessarily mean cut or spend a first round pick on another quarterback. Assuming Joe Flacco re-signs with Baltimore, there won’t be any real options in free agency for the Jaguars to address the quarterback position (Jason Campbell is probably the best of the bunch). But they can certainly address the issue in the draft. If a quarterback the Jaguars’ scouts view as elite is available with their (potentially very high) first round pick, then I don’t think you can simply say “let’s give Blaine one more year.” But at a minimum, the Jaguars must spend a pick on a quarterback in the 2013 draft if Gabbert doesn’t improve over the rest of 2012.

References

References
1 Of course, there is the obvious “chicken or the egg” question involved there. The other four teams on that list? The 2004 Ravens (Kyle Boller), 2003 Lions (Joey Harrington), 1997 Buccaneers (Trent Dilfer) and 1992 Bengals (Boomer Esiason/David Klingler) featured four first round quarterbacks who ended up being busts.
2 Note that for purposes of this post, I am considering Eli Manning, Philip Rivers, Jim Everett, and John Elway as being drafted by the Giants, Chargers, Rams and Broncos.
{ 17 comments }

Checkdowns: Patriots Passing Game Struggles

If there was one thing you can count on in New England, it’s that the Patriots passing attack would be more efficient than their opponent’s nearly every week. From 2003 to 2011, New England averaged 6.9 net yards per pass attempt while their defense allowed 6.0 NY/A. But this season, the Patriots passing offense is struggling by New England standards while the pass defense is worse than ever. Take a look: [1]Note that the table below lists team passing yards, which already deducts sack yardage lost

Playing the Jets on Sunday is the perfect medicine for a NY/A-imbalance, but what do you make of New England’s struggles this year?

References

References
1 Note that the table below lists team passing yards, which already deducts sack yardage lost
{ 3 comments }

Extreme Outliers: Rookie Edition

Griffining: Playing for a coach that tries to help you.

Both Andrew Luck and Robert Griffin III have been very successful this year. Griffin ranks 2nd in Y/A, 2nd in AY/A, 4th in NY/A, and 4th in ANY/A, an incredible performance nearly across the board (he’s 23rd in sack rate) by the Redskins rookie. He also is leading the league with a 69.1% completion rate and ranks 5th in passer rating. Luck ranks only 23rd in Y/A, 22nd in AY/A, 21st in NY/A, and 18th in ANY/A, respectable numbers for a rookie but on the surface, little more than that. He does rank 7th in sack rate, which is an excellent sign, but he ranks last in the NFL in completion percentage (in the non-Mark Sanchez division) and only 25th in passer rating.

But there are some other stats out there that paint a different picture. ESPN’s Total QBR ranks Griffin 11th overall — slightly below most of his other metrics — but ranks Luck as the fourth most effective quarterback so far this season. Also, despite Griffin’s edge in most metrics, the Colts and Redskins are essentially tied in three key drive metrics — points per drive, yards per drive and drive success rate — and I don’t think that’s because Donald Brown is so awesome. As Nate Dunlevy pointed out to me, one reason for this is that Luck has accumulated a large number of rushing first downs: Luck is tied for the league lead with Arian Foster on third down rushes that resulted in a first down. And once you account for strength of schedule, Luck vaults to #1 on the QBR list.

But let’s put aside effectiveness for right now. Some advanced metrics show you that they’ve been skinning cats in very different ways:

  • According to Advanced NFL Stats, Luck has thrown a pass 15 yards past the line of scrimmage on 24.3% of his throws, the 5th highest rate in the league. Griffin ranks 32nd with a deep rate of just 12.2%, ahead of only Matt Hasselbeck.
  • If you completely removed Yards After the Catch from the equation, Luck would rank in the top 10 at 4.5 yards per attempt while Griffin would rank 25th with just 3.5 yards per attempt.
  • Griffin ranks third behind just Christian Ponder and Philip Rivers when it comes to percentage of passing yards that are due to YAC, at 58.7%; Luck ranks 32nd, ahead of only John Skelton and Mark Sanchez, with only 33.4% of his yards coming on yards after the catch by his receivers.
  • According to Footballguys.com’s subscriber content, the Colts have targeted their wide receivers on 72.1% of their passes, the second highest rate in the league behind the Rams. The Colts are also last in the league with only 6.4% of their passes aimed at running backs (this also jives with the numbers from Mike Clay of Pro Football Focus.). The Redskins are more middle of the road in these metrics, but Andrew Luck is being forced to rely on his wide receivers with no real receiving threat in the backfield to help him out. As a result, it’s probably not too surprising that his completion percentage is so low.

Luck has also excelled in the two-minute drill and no-huddle situations early this year, although Griffin has been no slouch in those departments, either. But it’s clear that the Colts — rightly or wrongly — aren’t treating Luck with kid gloves. In fact, one could argue that they’re treating him no differently than they did Peyton Manning. Luck is averaging 44.3 pass attempts per game so far this season, second behind only Drew Brees. With a mediocre defense and a bad running game, the Colts are basically putting each game in the hands of Luck to win. Griffin is averaging only 27.8 pass attempts per game right now, and the Redskins have done a fantastic job molding the offense to to suit Griffin’s strengths.

Griffin’s numbers are better right now — ESPN excluded, of course — but that may be a reflection that the Shanaclan is more nurturing than Bruce Arians. Griffin’s success is outstanding, but Luck has been doing just as well under much more challenging conditions.

Update: Jeff Bennett, one of the creators behind ESPN’s Total QB, e-mailed me some notes this morning:

We break rushing out into two categories, scrambles and designed rushes. The quarterback receives more credit for scrambles then designed rushes – the reason being designed rushes are, well, designed to help the quarterback get more yards on the rush. Scrambles are not. Whatever positive or negative that comes from those is mostly on the quarterback.

So back to Luck. He has nine first down rushes this season on scrambles, most in the NFL. Seven of the nine have come on 3rd down, which generally is more important since the alternative to not picking up a 1st down is likely a punt instead of 2nd or 3rd down. No one else in the league has more than three 1st down rushes on scrambles.

Luck’s average pass is traveling 9.8 yards downfield this season. That is the third longest average pass distance in the league (behind Joe Flacco and Jay Cutler). Griffin averages 7.2 yards, a full yard below league average.

The average quarterback this season is getting 56% of their passing yards via “air yards” (meaning 44% of yards are coming after the catch). Griffin has 43% of his yards through the air. Luck has 68%.

{ 3 comments }

In August, I wrote this article examining Drew Brees’ pursuit of Johnny Unitas’ streak of 47 consecutive games with a touchdown pass. Brees tied the record last weekend and is set to break the tie Sunday night. If you missed this article the first time, or just wanted to re-read as we approach the record-setting day, here’s the link.

{ 0 comments }

A couple of weeks ago, I wrote about a method of calculating a team’s win probability at the end of any given quarter, given the pregame Vegas line and the score margin of the game after the quarter in question. Today, I want to break down those numbers in more detail by looking at which teams (and quarterbacks) added the most Win Probability in each stage of the game.

To compute Win Probability Added (WPA) for the purposes of this post, you look at how much the team’s chances of winning changed from one quarter to the next. For instance, here’s how I’d deconstruct Monday night’s game for the winning Bears:

WPA_loc and WPA_vegas are the two components that make up the pregame win expectancy. Chicago was on the road here, which typically deducts about 8% from a team’s base 50% WP right from the get-go (or roughly 2.5-3.0 points of spread), and on top of that they were 3.5-point underdogs, which put their pregame WP another 2.1% lower than you’d expect from an evenly-matched road team. All told, before the opening kickoff, they were already down about 10% in terms of WP.

Then both teams had a scoreless first quarter, which added 1.3% to Chicago’s total under the WPA_1st banner. This happened because, even though they were still tied, there was less time remaining in the game during which Dallas could exert their theoretical talent advantage (the variance of the future was likely to be higher, which always favors the underdog).

Chicago took a 10-7 lead in the 2nd quarter, which tacked on 13.7% of WP, as seen under WPA_2nd. By this point, they had erased their early 10% deficit and were actually favored to win with a WP of 55.1%. A 14-3 3rd period was the killer, though, adding 42% of WP in the WPA_3rd column. Going into the final quarter with a 24-10 lead, the Bears had a 97.1% chance of winning; when they didn’t relinquish that lead, the remaining 2.9% of WP were added under WPA_4th, since the game was over.

And as is the case with every winning team ever, their WPA_tot for the game was +0.500.

See how it works? By using WPA in this manner, we can detect when in the course of the game a team adds or subtracts the most from its chances of victory. We can also add these WPA numbers up across games at the season level, or even for entire careers.

[continue reading…]

{ 13 comments }

Interceptions per Incompletion (or POPIP)

The closest I'm willing to get with a baseball photo.

I leave the baseball analysis to my brothers at baseball-reference.com, but I know enough to be dangerous. There’s a stat called BABIP, which stands for Batting Average on Balls In Play. A “ball in play” is simply any at bat that doesn’t end in a home run or a strikeout. The thinking goes that luck and randomness is mostly responsible for the variance in BABIP allowed by pitchers to opposing batters. Pitchers can control the number of strikeouts they throw and control whether they allow home runs or not, but they can’t really control their BABIP.

Therefore, if a pitcher has a high BABIP, sort of like an NFL team with a lot of turnovers, he’s probably been unlucky. And good things may be coming around the corner. A high BABIP means a pitcher probably has an ERA higher than he “should” and that his ERA will go down in the future. In fact, you can easily recalculate a pitcher’s ERA by replacing the actual BABIP he has allowed with the league average BABIP. And that ERA will be a better predictor of future ERA than the actual ERA. At least, I think. Forgive me if my baseball analysis is not perfect.

Are you still awake? It’s Monday, and I’ve brought not only baseball into the equation, but obscure baseball statistics. Let’s get to the point of the post by starting with a hypothesis:

Assume that it is within a quarterback’s control as to whether he throws a completed pass on any given pass attempt. However, if he throws an incomplete pass, then he has no control over whether or not that pass is intercepted.
[continue reading…]

{ 14 comments }

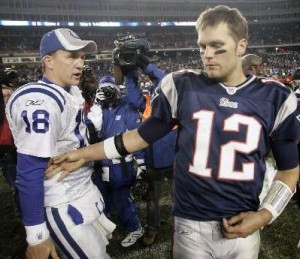
The teacher and the pupil.

Alex Smith has had an incredible career revival since Jim Harbaugh came to San Francisco. The first six seasons of his career, Alex Smith won just 38% of his 50 starts, but he has an incredible 15-3 regular season record since 2011 (83%). From 2005 to 2012, Smith had an ugly 72.1 passer rating, the worst of any quarterback with 1500 attempts over that span. Since Harbaugh came to town, Smith has a 93.6 passer rating, the 7th best mark of any quarterback over that time frame.

But there are two other, related, metrics, that indicate a fundamental shift in Smith’s style of play. In 2011, Alex Smith led the NFL in interception rate, but he also led the league in sacks. Smith threw an interception on just 1.1% of his passes in 2011 but took a sack on 9.0% of his dropbacks; this year, his sack rate has jumped to 10.9% while he has yet to thrown an interception.

Last year, the average quarterback threw an interception on 2.9% of his passes and was sacked on 6.4% of his dropbacks, meaning Smith’s interception rate was just 39% of the league average while his sack rate was 41% higher than league average. Smith also averaged just 197 passing yards per start, 80% of the league average metric.

It’s extremely early, of course, but Smith looks to be on a similar path this year. Which made me wonder: how often does a quarterback [1]For purposes of this study, I also limited the group to quarterbacks since 1978 who played for the same team for both years and who threw at least 200 passes in both years. have a two-year stretch with (1) an excellent interception rate, (2) a bad sack rate, and (3) a below-average amount of passing yards per game? The answer is very rarely.

There’s a lot of information to present, so I’ve overloaded the table below. This lists all quarterbacks since 1978 who over a two-year period had a sack rate at least 30% higher than average, an interception rate of 70% of league average or lower, and were below league average in passing yards per game. After the traditional categories, I’ve listed each quarterback’s sack rate, interception rate and yards per game, and then how their sack rates, interception rates and yards per game compared to league average. The last two columns show the quarterback’s record over those two years.

During Jim Harbaugh’s 4 years in Indianapolis, he was essentially Alex Smith. He had a 9.6% sack rate and a 2.1% interception rate, while averaging under 180 passing yards per game. When discussing Joe Namath, I noted that he almost never took sacks, which by some measures penalized him because it drove down his completion percentage and increased his interception rate. You can put Alex Smith and the Indianapolis version of Jim Harbaugh on one end of a spectrum and Joe Namath on the other. Both interceptions and sacks are bad, but to some extent, quarterbacks can decide whether they want to throw interceptions or take sacks. Smith, under Harbaugh’s tutelage, has clearly chosen the latter.

On a team with a great defense, that can work. Namath’s defenses weren’t always good, but when they were, the Jets were Super Bowl contenders. When the defenses struggled, Namath pressed even more, and ended up throwing even more interceptions. Smith is never asked to do too much, and Harbaugh has surrounded him with enough talent on the other side of the ball to make that a winning formula.

From 1994 to 1996, Jim Harbaugh went just 20-26 with the Colts. In 1997, Harbaugh had the lowest interception rate in the NFL and the second highest sack rate in the league. But the 1997 Colts ranked in the bottom 5 of the NFL in points allowed, passing touchdowns allowed, interceptions forced, rushing yards allowed, rushing touchdowns allowed and yards per carry allowed. The team went 3-13 overall, and 2-9 with Harbaugh, indicating that this conservative philosophy has its limitations.

Often times we use stats as a way to rank players, where more of one stat or less of another means a player is good, and less of one stat and more of another means a player is bad. But stats can also be used descriptively without overarching themes of good or bad. Just like some running backs are big and slow and others are small and fast, some quarterbacks are risky and some are risk-averse.

Harbaugh clearly was a risk-averse player in Indianapolis under Lindy Infante. What about the other players on the list? Conservative and risk-averse were good adjectives to describe Charlie Batch’s first two years in the league. In 1998, he had Barry Sanders, but Batch’s numbers were nearly identical both seasons (of course, you would normally expect some improvement by a quarterback betwen year one and two). It looks like he played things very safe as a rookie on a good team in 1998, and let’s not forget how he got the starting job: Scott Mitchell was benched after throwing a pick-six in overtime. We can safely conclude that Batch was told to avoid interceptions at all costs, for many reasons.

Steve Young led the league in passer rating in ’96 and ’97, and for many reasons, doesn’t really feel like a comparable player to Alex Smith. He had already been a two-time MVP by 1996.

Ken O’Brien was a very accurate quarterback who led the league in interception rate in ’85, ’87 and ’88. But he took a ton of sacks, in part because of a below-average offensive line. At his peak he was better than Smith has been so far — in ’85 he was 2nd in yards per attempt and he was 5th in that metric in ’86 — but there are some similarities between the two players.

From 1982 to 1986, Neil Lomax had a 10.5% sack rate but a tiny 2.8% interception rate; despite the conservative nature, his team went just 30-36-2 over that span. Lomax was outstanding in 1984, but otherwise was a solid but unspectacular player during this span (Lomax made the Pro Bowl in ’87 when he led the league in completions, attempts, and passing yards.) Lomax also benefited from consecutive All-Pro seasons from Roy Green in ’83 and ’84, but poor defenses prevented Lomax from compiling a winning record in St. Louis.

In the early ’80s, Steve Bartkowski had some success under Leeman Bennett, and made the Pro Bowl in ’80 and ’81. During those years, he was at or above average in sack rate and also interception rate, but then his interception rate improved dramatically in ’83 while his sack rate fell off for the rest of his career. A likely explanation is the hiring of Dan Henning that season, who may have emphasized a more conservative approach.

The two years before Harbaugh arrived, Smith had a 6.2% sack rate and a 3.1% interception rate, both numbers which were pretty close to league average. But Alex Smith 2.0 is not trying to prove to the world that he’s the #1 pick who can do everything; this version is concerned with minimizing risks at all costs. So far, it’s been a very successful formula.

References

References
1 For purposes of this study, I also limited the group to quarterbacks since 1978 who played for the same team for both years and who threw at least 200 passes in both years.
{ 4 comments }

[Today is a two-post day at Football Perspective. Check here for my week 2 power rankings, while Neil provides an innovative look at the biggest comebacks of the last 35 years in this post. — Chase

In my last post, I introduced a method of estimating the home team’s pre-game win probability in Excel using the Vegas spread:

p(W) = (1-NORMDIST(0.5,-(home_line),13.86,TRUE)) + 0.5*(NORMDIST(0.5,-(home_line),13.86,TRUE)-NORMDIST(-0.5,-(home_line),13.86,TRUE))

The Comeback ranks as the 2nd most impressive comeback after two quarters, but only 20th overall.

Let me explain the rationale behind the scary-looking equation. The first part represents the probability that the home team ends regulation time with a lead of 1 point or more, using Hal Stern’s finding that the home team’s final margin of victory can be approximated by a normal random variable with a mean of the Vegas line and a standard deviation of 13.86. The second part is the probability that regulation ends in a tie, multiplied by 0.5 (this assumes each team has roughly a 50-50 chance of winning in overtime).

With a small twist, we can also apply this formula within games, to the line-score data for every quarter. Within a game, the home team’s probability becomes:

p(W) = (1-NORMDIST(away_margin+0.5,-home_line*(minleft/60),13.86/SQRT(60/minleft),TRUE))+0.5*(NORMDIST(away_margin+0.5,-home_line*(minleft/60),13.86/SQRT(60/minleft),TRUE)-NORMDIST(away_margin-0.5,-home_line*(minleft/60),13.86/SQRT(60/minleft),TRUE))

This is the same equation as before, but we’re adding in Home_Margin (home team pts minus road team pts for the game, through the end of the quarter in question), reducing the effect of the home Vegas line linearly based on how much time remains in the game, and changing the standard deviation of scoring margin to become:

Stdev = 13.86 / sqrt(60 / n)

where n = the number of minutes remaining in the game.

These changes will help us estimate a team’s chances of winning at the end of each quarter. For instance, Monday night’s game — where the Falcons were a 3-point home favorite over the Broncos — goes from:

To this:

[continue reading…]

{ 7 comments }

The third and fourth most popular quarterbacks in New York this week.

There are few nights as precious as tonight, the official start of the 2012 regular season. Even after tonight, 255 regular season games remain for us to enjoy. As usual, the defending Super Bowl champion hosts the opening game, and it didn’t take the NFL schedule makers long to decide on an opponent. This will be the 6th time in 8 meetings that the Giants and Cowboys will meet on primetime television. And as usual, the media will turn this game into another referendum on Tony Romo and Eli Manning.

Public perception says that Manning is the better quarterback, based largely exclusively on his post-season success and reputation as a clutch quarterback. And there’s a good reason he has such a reputation: Manning has won 8 of his last 9 playoff games and tied NFL single-season records with seven 4th-quarter comebacks and eight game-winning drives in 2011. Romo has a reputation as the chokiest of chokers, is 1-3 in playoff games, and has been less stellar than Manning late in games. While Manning has 21 career 4th quarter comebacks and is 21-22 in games where he had an opportunity for a 4th quarter comeback, Romo is just 13-20 in 4th quarter comeback opportunities. But let’s leave that to the side for now.

Because based on their regular season statistics, Romo absolutely crushes Manning, at least statistically. The gap shrunk significantly in 2011, but Romo’s track record of production and efficiently is considerably more impressive. Manning entered the league in 2004 but struggled his first three years; Romo first started in 2006 and was above average immediately. But let’s just focus on the past five seasons. The table below displays the statistics each quarterback produced from 2007 to 2011. Note that since Romo has missed time due to injury, I have added a third row, which pro-rates Romo’s numbers to 80 starts:
[continue reading…]

{ 38 comments }

The original standard for postseason success.

On Wednesday, I explained the methodology for grading each quarterback in each season. Yesterday, I came up with an all-time career list of the best quarterbacks based on their regular season play. Today, a look at playoff performances.

Using the same formula, we can grade each quarterback in each game and adjust for era [1]Note that I do not have individual playoff sack data prior to 2008, so I am using pro-rated sack numbers based on team sack data.. However, it should be obvious that the sample sizes here are incredibly small, and the stats are even less likely to tell the true story when looking at just one game. Strength of schedule becomes a significant factor here, as well. But, caveats aside, there’s a lot we can do with playoff data. For example, we can rank every quarterback performance in Super Bowl history:


If you type Montana’s name into the search box, you can see that he has the 1st, 4th, 11th and 27th best performance in Super Bowl history. The best performance in a losing effort goes to Jake Delhomme, who shredded the Patriots secondary in the second half of Super Bowl XXXVIII (he began the game 1 for 9 for 1 yard). The worst performance in a winning effort, unsurprisingly, goes to Ben Roethlisberger in Super Bowl XL, although Joe Theismann against the Dolphins gets an honorable mention. Worst performance overall goes to Kerry Collins, although Craig Morton’s 4 interceptions and 39 yards on 15 attempts against his former team in Super Bowl XII could give Collins a run for his money.

What about best championship game performances in the pre-Super Bowl era?


[continue reading…]

References

References
1 Note that I do not have individual playoff sack data prior to 2008, so I am using pro-rated sack numbers based on team sack data.
{ 8 comments }

Yesterday, I explained the methodology behind the formula involved in ranking every quarterback season in football history. Today, I’m going to present the career results. Converting season value to career value isn’t as simple as it might seem. Generally, we don’t want a player who was very good for 12 years to rank ahead of a quarterback who was elite for ten. Additionally, we don’t want to give significant penalties to players who struggled as rookies or hung around too long; we’re mostly concerned with the peak value of the player.

What I’ve historically done — and done here — is to give each quarterback 100% of his value or score from his best season, 95% of his score in his second best season, 90% of his score in his third best season, and so on. This rewards quarterbacks who played really well for a long time and doesn’t kill players with really poor rookie years or seasons late in their career. It also helps to prevent the quarterbacks who were compilers from dominating the top of the list. The table below shows the top 150 regular season QBs in NFL history using that formula, along with the first and last years of their careers, their number of career attempts (including sacks and rushing touchdowns), and their career records and winning percentages (each since 1950). For visibility reasons, I’ve shown the top 30 quarterbacks below, but you can change that number in the filter or click on the right arrow to see the remaining quarterbacks.
[continue reading…]

{ 21 comments }

In 2006, I took a stab at ranking every quarterback in NFL history. Two years later, I acquired more data and made enough improvements to merit publishing an updated and more accurate list of the best quarterbacks the league has ever seen. In 2009, I tweaked the formula again, and published a set of career rankings, along with a set of strength of schedule, era and weather adjustments, and finally career rankings which include those adjustments and playoff performances.

If nothing else, that was three years ago, so the series was due for an update. I’ve also acquired more data, enabling me to tweak the formula to better reflect player performance. But let’s start today with an explanation of the methodology I’m using. To rank a group of players, you need to decide which metric you’re ordering the list by. I’ll get to all of the criteria I’m not using in a little bit, but the formula does use each of the following: pass attempts, passing touchdowns, passing yards, interceptions, sacks, sack yards lost, fumbles, fumbles recovered, rush attempts, rushing yards and rushing touchdowns. Most importantly, the formula is adjusted for era and league.

Two of the best quarterbacks ever.

So where do we begin? We start with plain old yards per attempt. I then incorporate sack data by removing sack yards from the numerator and adding sacks to the denominator [1]I have individual sack data for every quarterback since 1969. For seasons before then, I have team sack data going back to 1949. For seasons before 1950, I ignored sacks; for seasons between 1950 … Continue reading. To include touchdowns and pass attempts, I gave a quarterback 20 yards for each passing touchdown and subtracted 45 yards for each interception. This calculation — (Pass Yards + 20 * PTD – 45 * INT – Sack Yards Lost) / (Sacks + Pass Attempts) forms the basis for Adjusted Net Yards per Attempt, one of the key metrics I use to evaluate quarterbacks.

For purposes of this study, I did some further tweaking. I’m including rushing touchdowns, because our goal is to measure quarterbacks as players. There’s no reason to separate rushing and passing touchdowns from a value standpoint, so all passing and rushing touchdowns are worth 20 yards and are calculated in the numerator of Adjusted Net Yards per Attempt. To be consistent, I also include rushing touchdowns in the denominator of the equation. This won’t change anything for most quarterbacks, but feels right to me. A touchdown is a touchdown.
[continue reading…]

References

References
1 I have individual sack data for every quarterback since 1969. For seasons before then, I have team sack data going back to 1949. For seasons before 1950, I ignored sacks; for seasons between 1950 and 1969, I gave each quarterback an approximate number of sacks, giving him the pro-rated portion of sacks allowed by the percentage of pass attempts he threw for the team. While imperfect, I thought this “fix” to be better than to ignore the data completely, especially for years where one quarterback was responsible for the vast majority of his team’s pass attempts.
{ 13 comments }

This is a starting NFL quarterback in an NFL uniform. Welcome to 2012.

Andrew Luck and Robert Griffin III were drafted as franchise saviors, and have been expected to start on opening day for months; more recently Brandon Weeden in Cleveland and Ryan Tannehill in Miami won starting jobs. Then, last night, Pete Carroll announced that Russell Wilson had beaten Matt Flynn in the Seahawks quarterback battle. Barring injury, we’ll see five rookie quarterbacks starting on opening day for the first time since 1950 (and likely ever). Before Wilson, we were already in record territory, as no more than three teams have ever started the season with rookie quarterbacks since 1950 (and likely ever). In 1969, Roger Staubach, Greg Cook and James Harris were week one starters for the Cowboys, Bengals and Bills. The year before, Greg Landry, Dewey Warren, and Dan Darragh started for the Lions… Bengals and Bills. And in the AFL’s inaugural season, three teams fielded rookie quarterbacks. But on average, less than one rookie quarterback has started a team’s opening game each season since the merger.

Last year, Cam Newton and Andy Dalton were opening day starters, and their success (along with the success of Joe Flacco and Matt Ryan) have undoubtedly made teams become more willing to start rookie quarterbacks. In fact, the youth movement goes beyond just this year’s class: in addition to Newton and Dalton, Jake Locker, Christian Ponder, and Blaine Gabbert will be second-year quarterbacks starting in week one this season. That’s another record, breaking the seven such quarterbacks in 2000. Remember 1999, the Year of the Quarterback in the NFL Draft? Tim Couch, Donovan McNabb, Akili Smith, Cade McNown, and Daunte Culpepper were all high first-round draft picks, and all were sophomore starters in 2000. Shaun King, fresh off a strong late-season run for Tampa Bay, joined the group in week 1 of the 2000, as did Jeff Garcia in San Francisco.

What’s the explanation? Luck, Griffin, and Newton were uber elite talents who were too good to sit. Wilson legitimately won the Seahawks job in training camp and preseason, a rare event in any era for a rookie quarterback. But the rest of the group — Weeden, Tannehill, Dalton, Gabbert, Ponder, and Locker — seem to signal a shift in NFL philosophy. The table below lists all quarterbacks drafted in the top 40 — but not in the top 5 — since 1970, and the first year in their career when they started for their team in week one:
[continue reading…]

{ 2 comments }

I broke down each of the NFL and AFL champions since 1950 into three categories:

  • Pass Efficiency, measured by a modified version of ANY/A. The formula was (Passing Yards + 10*TD – 22.5*INT – Sack Yards)/(Pass Attempts + Sacks). This strikes a middle ground between traditional ANY/A and NY/A.
  • Rushing Success, according to the following formula: (Rushing Yards + 10*RTD + 5*Rushing1stDowns)/(Carries).
  • Defensive Rating, based on the number of offensive touchdowns scored by their opponents.

There are ways to quibble with those categories, and I won’t begrudge anyone who does. After giving each team a rating in each category, I calculated how they compared to the league average in each season. In all cases, the average is 100%, and a number higher than 100% means better.

Here’s what each of the columns mean, from left to right. In 2011, the New York Giants won the Super Bowl; they allowed 43 touchdowns to opposing offenses, averaged 7.6 in my modified version of ANY/A, and averaged 4.9 adjusted yards per carry. The next three columns show how New York ranked relative to league average. By allowing 43 scores, the Giants D was well below average, putting them at 83% of the average mark; they were 25% better than average at passing, but only 86% of league average efficiency in the running game. Since the Giants highest rating came in the passing category, they are listed in the Identity column as a Passing team.
[continue reading…]

{ 8 comments }
Next Posts Previous Posts