≡ Menu

Last week, I wrote about why I was not concerned with Trent Richardson’s yards per carry average last season. I like using rushing yards because rush attempts themselves are indicators of quality, although it’s not like I think yards per carry is useless — just overrated. One problem with YPC is that it’s not very stable from year to year. In an article on regression to the mean, I highlighted how yards per carry was particularly vulnerable to this concept. Here’s that chart again — the blue line represents yards per carry in Year N, and the red line shows YPC in Year N+1. As you can see, there’s a significant pull towards the mean for all YPC averages.

regression ypc

I decided to take another stab at examining YPC averages today.  I looked at all running backs since 1970 who recorded at least 50 carries for the same team in consecutive years. Using yards per carry in Year N as my input, I ran a regression to determine the best-fit estimate of yards per carry in Year N+1. The R^2 was just 0.11, and the best fit equation was:

2.61 + 0.34 * Year_N_YPC

So a player who averages 4.00 yards per carry in Year N should be expected to average 3.96 YPC in Year N+1, while a 5.00 YPC runner is only projected at 4.30 the following year.

What if we increase the minimums to 100 carries in both years? Nothing really changes: the R^2 remains at 0.11, and the best-fit formula becomes:

2.63 + 0.34 * Year_N_YPC

150 carries? The R^2 is 0.13, and the best-fit formula becomes:

2.54 + 0.37 * Year_N_YPC

200 carries? The R^2 stays at 0.13, and the best-fit formula becomes:

2.61 + 0.36 * Year_N_YPC

Even at a minimum of 250 carries in both years, little changes. The R^2 is still stuck on 0.13, and the best-fit formula is:

2.68 + 0.37 * Year_N_YPC

O.J. Simpson typifies some of the issues. It’s easy to think of him as a great running back, but starting in 1972, his YPC went from 4.3 to 6.0 to 4.2 to 5.5 to 5.2 to 4.4. Barry Sanders had a similar stretch from ’93 to ’98, bouncing around from 4.6 to 5.7 to 4.8 to 5.1 to 6.1 and then finally 4.3. Kevan Barlow averaged 5.1 YPC in 2003 and then 3.4 YPC in 2004, while Christian Okoye jumped from 3.3 to 4.6 from 1990 to 1991.

This guy knows about leading the league

This guy knows about leading the league.

Those are isolated examples, but that’s the point of running the regression. In general, yards per carry is not a very sticky metric. At least, it’s not nearly as sticky as you might think.

That was going to be the full post, but then I wondered how sticky other metrics are.  What about our favorite basic measure of passing efficiency, Net Yards per Attempt? For purposes of this post, an Attempt is defined as either a pass attempt or a sack.

I looked at all quarterbacks since 1970 who recorded at least 100 Attempts for the same team in consecutive years. Using NY/A in Year N as my input, I ran a regression to determine the best-fit estimate of NY/A in Year N+1. The R^2 was 0.24, and the best fit equation was:

3.03 + 0.49 * Year_N_NY/A

This means that a quarterback who averages 6.00 Net Yards per Attempt in Year N should be expected to average 5.97 YPC in Year N+1, while a 7.00 NY/A QB is projected at 6.45 in Year N+1.

What if we increase the minimums to 200 attempts in both years? It has a minor effect, bringing the R^2 up to 0.27, and producing the following equation:

2.94 + 0.51 * Year_N_NY/A

300 Attempts? The R^2 becomes 0.28, and the best-fit formula is now:

2.94 + 0.53 * Year_N_NY/A

400 Attempts? An R^2 of 0.26 and a best-fit formula of:

3.18 + 0.50 * Year_N_NY/A

After that, the sample size becomes too small, but the takeaway is pretty clear: for every additional yard a quarterback produces in Year N, he should be expected to produce another half-yard in NY/A the following year.

So does this mean NY/A is sticky and YPC is not? I’m not so sure what to make of the results here. I have some more thoughts, but first, please leave your ideas and takeaways in the comments.

{ 9 comments }

An ordinary hit

An ordinary hit.

Just about every article about Trent Richardson references his unimpressive 3.6 yards per carry average from last season. That stat is pretty meaningless, in my opinion. I suppose if you took a random running back from NFL history, and his YPC average in one random season was 3.6, and I knew nothing else about the player, I suppose I would probably assume that the running back was not (or was not going to become) a star. But Richardson isn’t a random running back from a database, because…

  • His 3.6 YPC average came on 267 carries, which represented 77% of all carries by Cleveland running backs
  • He was a rookie last year
  • He was a high first round pick

Since 1970, only 13 first round rookies have recorded 70% of all running back carries by their team. Two of those players were Richardson and Tampa Bay’s Doug Martin last year. Of that group, Richardson did post the lowest YPC average, but he was within 0.1 YPC of LaDainian Tomlinson. The next two lowest averages belong to Robert Edwards and Emmitt Smith; the former suffered a career-debilitating injury in a beach football game after his rookie season, while the latter ran for the most yards in NFL history.

Yeah, Richardson’s yards per carry average was well below average. But the universe of first round running backs who became workhorses right away as rookies and had a low YPC average consists of a HOF running back, a future HOF running back, and a player who suffered the flukiest of injuries. Richardson has something else in common with Emmitt Smith: after both of their rookie seasons, Norv Turner came on board as offensive coordinator.

But let’s say you don’t want to give Richardson any credit for his draft status. And you’re not in the mood to give him a pass just because he was a rookie. OK. Since 1990, 48 running backs have averaged fewer than 3.8 yards per carry while recording at least 70% of all running back carries for their team. Twenty-six of those players were at least 27 years old, and on the back half of their careers. Here are the other 22 running backs:
[continue reading…]

{ 22 comments }

Franchises Nemeses: Rushing Stats

Yesterday, I looked at the players who threw for the most yards and touchdowns against each franchise. Today I will do the same but with rushing statistics.

But before going on, I’d urge you to take a few minutes and re-read this incredible document our founders signed 237 years ago. It’s great having a day off in the summer to barbecue and celebrate with family and friends, but it’s important to take a few moments and remember what this holiday really means. Like preventing this site from becoming Futbol Perspective.

Let’s again start with a bit of trivia. Do you know which player has rushed for the most yards against any one opponent?

Click Show for the Answer Show


What about the most rushing touchdowns?

Click Show for the Answer Show


Let’s take a look at the players who have rushed for the most yards against each franchise:
[continue reading…]

{ 3 comments }

Some Initial Thoughts Running Backs

Peterson and Foster each finished in the top four in rushing first downs

Peterson and Foster each finished in the top four in rushing first downs.

I’ve spent a lot of time this offseason looking at how to grade wide receivers; today I wanted to get some initial thoughts down on paper on running backs.

I’m short on time today, which means a lot of data and not so much theory. One of the more underrated statistics to measure running backs is the number of first downs they produce. I don’t like using Yards per Carry for running backs because that metric is pretty sensitive to outliers. But by using rushing first downs, perhaps we can smooth things out.

We know that the value of a touchdown is about 20 yards, but what is the value of a rushing first down? Being short on time, I took the easy way out. Pro-Football-Reference has produced Expected Points Added for each team’s running game going back to 2000. I decided to run a regression on the team level to best predict rushing EPA based on four rushing statistics. The R^2 was 0.77, but more importantly, here was the best fit formula:

EPA = -16.6 -0.58*Rush + 0.067*Rush_Yd + 1.43*Rush_TD + 1.08*Rush_FD

What interests me is the relationships between the variables. Rushing touchdowns are considered 21.3 times as valuable as rushing yards, which happens to fit in well with our previous assumptions. But more importantly, this tells us that a rushing first down is worth 16.1 rushing yards. That seems pretty high to me, and I reserve the right to adjust this later, but for now, let’s adjust down and say the value of a rushing first down is 15 yards. Now what?
[continue reading…]

{ 34 comments }

Green Bay didn’t use a first round pick on a running back, but the Packers did spend a second round pick on Alabama’s Eddie Lacy and a fourth round pick on UCLA’s Johnathan Franklin.  How much weight should we put on draft status when one team drafts two running backs just a couple of rounds apart?  One school of thought is that the Packers liked both players and are maximizing their odds of finding a star; another is that Green Bay prefers Lacy and wants him to win the job, since he was their first choice.  Here’s another thing to consider, courtesy of my good buddy Sigmund Bloom: the Packers traded down to grab Lacy and traded up to draft Franklin, indicating that perhaps the Packers were higher on Franklin than you might think.

How rare is it for teams to double dip at the running back position like this? That depends on how you want to categorize what the Packers did. I think a reasonable comparison would be to look at all teams that:

  • Did not draft a running back in the first round but drafted one in the second or third rounds (this excludes combinations like Stepfan Taylor and Andre Ellington); and
  • Then drafted a different running back within the next two rounds

Since 1970, only 34 teams have met those criteria, meaning this is a strategy employed roughly three times every four years. In three instances, a team drafted three running backs that met those two criteria, and we’ll deal with them at the end of this post. I’m going to exclude three teams that drafted fullbacks after selecting halfbacks, as the 2008 Lions (drafted Jerome Felton after Kevin Smith), 2003 Ravens (Ovie Mughelli after Musa Smith), and 1999 Dolphins (Rob Konrad after J.J. Johnson) don’t really fit the intent of the post. That leaves us with 28 pairs of running backs. The table below lists each pair. On the left, you will see the first running back drafted, his round and overall pick, his rookie rushing yards, his rookie fantasy points total (using 0.5 points per reception), and his career rushing yards; on the right, the same information is presented for the second running back drafted. The far right column shows the difference between the two players in terms of fantasy points during their rookie year. For example, Stevan Ridley scored 41 more points than Shane Vereen in 2011, even though the Patriots drafted Vereen first.
[continue reading…]

{ 4 comments }

Why do you need to run the ball when you have this guy?

Why do you need to run the ball when you have this guy?

The Packers have gone 43 consecutive regular season games without having a 100-yard rusher. Not coincidentally, Green Bay drafted Alabama’s Eddie Lacy and UCLA’s Johnathan Franklin in the draft last weekend, hoping that one of those players can bolster the team’s rushing attack.

Brandon Jackson rushed for 115 yards in an overtime loss against the Redskins on October 10, 2010. How long ago was that? Washington’s quarterback that day was Donovan McNabb. Two months later, Jackson rushed for 99 yards in a loss in Foxboro, and Ryan Grant had 92 rushing yards in a September victory in Chicago in 2011, but no Packer has hit the century mark in a regular season game since October 10th, 2010. (It’s worth noting that James Starks rushed for 123 yards in a playoff victory against the Eagles in the 2010 playoffs, but NFL game streaks routinely exclude postseason performances.)

The table below lists all teams since 1960 to go at least 32 games without a 100-yard rusher. Here’s how the second row of the table reads: The Washington Redskins went 72 games without a 100-yard rusher. The team’s last 100-yard rusher came in a game on December 17, 1961, and the streak finally ended on September 24, 1967. The player to break the streak was Bobby Mitchell, and you can see the boxscore from that game in the final column.
[continue reading…]

{ 3 comments }

Is Arian Foster declining?

[House-keeping note: I’ve added the Salary Cap Calculator to the gray header tabs at the top of each page, so you can now easily get there no matter what page you’re on at Football Perspective.]

A quick look at Arian Foster‘s statistics over the last three years paints a picture of a player in decline:

Year G Rsh RshYd RTD YPC YPG C/G Rec RecYd YPR TD YScm RRTD
2010*+ 16 327 1616 16 4.9 101.0 20.4 66 604 9.2 2 2220 18
2011* 13 278 1224 10 4.4 94.2 21.4 53 617 11.6 2 1841 12
2012* 16 351 1424 15 4.1 89.0 21.9 40 217 5.4 2 1641 17


Foster’s declined in rushing yards per game and yards per carry over the last two years, while his value in the receiving game fell off a cliff in 2012. One could reasonably conclude that Foster simply isn’t the same player he used to be, and that he could drop off even more in 2013.  But while the traditional statistics tell one story, what do the advanced metrics say?
[continue reading…]

{ 20 comments }

In the pre-season, I wrote three pieces on Cleveland Browns rookie Trent Richardson.  As part of a thought experiment, I wondered who would lead the NFL in rushing yards from 2012 to 2021? I narrowed my finalists to LeSean McCoy, Beanie Wells (was I drunk?), DeMarco Murray (ouch), Richardson and the rest of the rookies, and then a few college running backs. I concluded that Richardson was the obvious frontrunner, with McCoy, Doug Martin, and Marcus Lattimore (double ouch) as the next best bets. I’m not really sure 2012 helped clarify the issue, although Martin and Alfred Morris certainly raised their chances.

Then in August, I looked at the production of the highest drafted running back in each draft class.  I discovered that slightly fewer than half of the highest drafted running backs led their class [1]Note that this only includes drafted running backs. in rushing yards as a rookie; as you can see, “the field” also turned out to be a better bet than Richardson in 2012:

RkPlayerYearDraftTmGAttYdsY/ATDY/G
1Alfred Morris20126-173WAS1633516134.8113100.8
2Doug Martin20121-31TAM1631914544.561190.9
3Trent Richardson20121-3CLE152679503.561163.3
4Vick Ballard20125-170IND162118143.86250.9
5Bryce Brown20127-229PHI161155644.9435.3
6Bernard Pierce20123-84BAL161085324.93133.3
7Daryl Richardson20127-252STL16984754.85029.7
8David Wilson20121-32NYG16713585.04422.4
9Robert Turbin20124-106SEA16803544.43022.1
10Ronnie Hillman20123-67DEN14843273.89123.4
11Brandon Bolden2012udfaNWE10562744.89227.4
12Lamar Miller20124-97MIA13512504.9119.2
13LaMichael James20122-61SFO4271254.63031.3
14Chris Rainey20125-159PIT16261023.9226.4
15Jeremy Stewart2012udfaOAK4251014.04025.3

In that post, I also noted that the running back drafted first in his class was slightly less successful over the course of his career: only one-third of the highest-drafted running backs finished with the most career rushing yards in their class.

The final post on the topic ended up being more relevant to Alfred Morris than Richardson. In August, I compared how the top rookie running back performed over the rest of his career relative to the other members of his class. From 1992 to 2002, 10 of the 11 backs to lead their class in rushing yards as rookies ended up finishing with the most career rushing yards. But in recent years, that trend has reversed itself: the odds are long that Ben Tate (2011), LeGarrette Blount (2010), Knowshon Moreno (2009 and competing with Arian Foster and LeSean McCoy), or Steve Slaton (2008) will also finish with the best careers from their class.

So where do we stand on Richardson and Morris? A year later, how much credit do we give Richardson for having been the #3 pick in the draft? For Morris, how much do we downgrade him for being a 6th round pick? And how does the presence of Robert Griffin III complicate things?
[continue reading…]

References

References
1 Note that this only includes drafted running backs.
{ 10 comments }

Trivia: Leading rusher in two different Super Bowls

Emmitt Smith was a product of the system, except when the system failed without him.

Emmitt Smith was a product of the system, except when the system failed without him.

A week before the Super Bowl, I asked if you could name the seven wide receivers to start for two different teams that reached the Super Bowl. In the comments to that post, JWL alerted me to a pretty cool piece of Super bowl trivia.

Eight different men have been the leading rusher in multiple Super Bowls. Seven of these men (Ahmad Bradshaw, New York Giants; Antowain Smith, New England Patriots; Terrell Davis, Denver Broncos; Emmitt Smith, Dallas Cowboys; Tony Dorsett, Dallas Cowboys; Franco Harris, Pittsburgh Steelers; and Larry Csonka, Miami Dolphins) pulled off this feat while playing for the same team.

However, one running has been the leading rusher in two Super Bowls for two different teams. He’s the subject of today’s trivia question. Can you name him?

Trivia hint 1 Show


Trivia hint 2 Show


Trivia hint 3 Show


Click 'Show' for the Answer Show

{ 10 comments }

Regular readers surely recall my “What are the Odds of That” post from this summer. In that article, I referenced an obscured Jacoby Jones stat: in 2011, he gained three times as many receiving yards against teams at the back end of the alphabet as he did against the teams he faced in the front of the alphabet. Then I asked, “what are the odds of that?”

This is a very good reason why it’s often inappropriate to apply standard significance tests to football statistics. Surely Jones’ splits would pass any standard significance test, signaling that his wild split was in fact “real” even though we know it wasn’t. With a large enough sample, you would expect to have false positives, which isn’t a knock on standard significant testing. If something is statistically significant at the 1% level, that doesn’t mean you shouldn’t expect to see a false positive if you have 100 different samples…

Some in the statistical community refer to this as the Wyatt Earp Effect. You’ve undoubtedly heard of Wyatt Earp, who is famous precisely because he survived a large number of duels. What are the odds of that? Well, it depends on your perspective. The odds that one person would survive a large number of duels? Given enough time, it becomes a statistical certainty that someone would do just that. Think back to the famous Warren Buffett debate on the efficient market hypothesis. Suppose that 225 million Americans partake in a single elimination national coin-flipping contest, with one coin flip per day. After 20 days, we would expect 215 people to successfully call their coin flips 20 times out of 20. But that doesn’t mean those 215 people are any better at calling coins than you or I am. The Wyatt Earp Effect, the National Coin Flipping Example, and my Splits Happen post all illustrate the same principle. Asking “what are the odds of that?” is often meaningless in retrospect. If you look at enough things, enough players’ splits, enough 4th quarter comeback opportunities, enough coin flips, or enough roulette wheel spins, you will see some things that seem absurdly unlikely.

In December, I highlighted Matt Schaub’s struggles in night games compared to day games as yet another example. Well now, Ray Rice is the latest protagonist in What are the Odds of That? In case you missed it, Rice fumbled twice in Baltimore’s playoff win over Indianapolis, with the Colts recovering both times. Rice has struggled with fumbles in the playoffs in the past, but he’s always been outstanding during the regular season at holding on to the ball. In 2012, he lost just one fumble — which went harmlessly out of bounds — giving him a clean record for the season. So what’s going on? Here’s what Bill Barnwell wrote earlier this week:
[continue reading…]

{ 5 comments }

The good Charles showed up against the Saints

The good Charles showed up against the Saints.

A couple of weeks ago, I heard my buddy and co-worker Sigmund Bloom say on the Footballguys Podcast that Jamaal Charles was having one of the craziest seasons ever. As Sigmund noted, Charles has been an incredibly frustrating fantasy player. This year, he had three games with 10 or fewer rushing yards… and he also became the first player in NFL history with two games with over 225 rushing yards in the same season.

Did you know that Kansas City finished 2012 fifth in carries? Under Todd Haley, Chiefs fans and fantasy football players were constantly frustrated by Thomas Jones, who Haley seemed to always find a way to give an extra ten carries to. This year, under Romeo Crennel, Peyton Hillis was the complementary back, but he was not nearly as predatory. Still, while Charles finally received the lion’s share of the carries, he was once again an inconsistent fantasy player.

Take a look at Charles’ weekly game logs:

G#DateOppResultAttYdsYPCTD
109/09/2012ATLL 24-4016875.440
209/16/2012@BUFL 17-35630.50
309/23/2012@NORW 27-24332337.061
409/30/2012SDGL 20-3717885.181
510/07/2012BALL 6-9301404.670
610/14/2012@TAML 10-3812403.330
710/28/2012OAKL 16-26540.80
811/01/2012@SDGL 13-3112393.250
911/12/2012@PITL 13-16231004.351
1011/18/2012CINL 6-2817875.120
1111/25/2012DENL 9-17231074.650
1212/02/2012CARW 27-21271274.70
1312/09/2012@CLEL 7-30181659.171
1412/16/2012@OAKL 0-159101.110
1512/23/2012INDL 13-202222610.271
1612/30/2012@DENW14533.790

That’s a pretty incredible distribution, but how crazy is it?

I looked at the standard deviation of every game by every player in a season with at least 1,000 rushing yards from 1960 to 2011. As it turns out, Charles has had one of the most inconsistent seasons ever. While he gained 1,509 rushing yards, he had a standard deviation of 71.4 yards. That may not mean anything to you in the abstract, but it would place him as the 4th most inconsistent back since 1960.
[continue reading…]

{ 0 comments }

Trent Richardson thinks this guy was an average running back in losses.

Trent Richardson thinks this guy was an average running back in losses.

Yesterday, I noted that Adrian Peterson is averaging nearly two more yards per rush in losses than wins. He’s also averaging a nearly identical number of rushing yards per game in wins and losses.

As you’re about to see, that’s pretty rare. We all know that wins are correlated with rushing yards, so it should come as no surprise that running backs generally gain more rushing yards in wins than in losses.

I looked at all games, including playoffs, from 1960 to 2011, for all players with at least 3,000 rushing yards over that time period. The table below lists the following information for each player:

— His first year (or 1960, if he played before 1960) and his last year (or 2011, if still active)
— All the franchises he played for (which you can search for in the search box)
— His number of career wins, and his career rush attempts, rushing yards, rushing yards per carry, and rushing yards per game in wins
— His number of career losses, and his career rush attempts, rushing yards, rushing yards per carry, and rushing yards per game in losses

The table is sorted by rushing yards per game in wins. Again, for players like Jim Brown or Peterson, they are included but only their stats from 1960 to 2011 are shown. The table only shows the top 50 players, but the search feature works for the entire table, which includes 281 players. In addition, you can click on the drop arrow and change the number of rows shown.

As always, the table is fully sortable. If you click twice on the far right column, you see the career leaders in rushing yards per game in losses. You probably aren’t surprised to see Barry Sanders at the top, but the presence of the running back formerly known as Dom Davis up there is a bit surprising. Steven Jackson is one of the few players who have averaged over 70 rushing yards per game in losses, which jives with the sixth post in Football Perspective history. In addition, Jackson (at least through 2011) and LaDainian Tomlinson form an interesting example of Simpson’s Paradox: Jackson has a higher career rushing yards per game average in both wins (93.9 to 89.9) and losses (71.1 to 63.2), while Tomlinson has the higher career average overall (78.6 to 78.3).

RkPlayerYearsTeamsPosWRsh_WYd_WYPC_WYd/G_WLRsh_LYd_LYPC_LYd/G_L
1Jim Brown1960--1965cleFB55117665905.6119.82538417064.4468.2
2Terrell Davis1995--2001denRB58141568674.85118.42844418804.2367.1
3Barry Sanders1989--1998detRB75167085265.11113.784148371294.8184.9
4Eric Dickerson1983--1993ram-clt-rai-atlRB74177684114.74113.778136855724.0771.4
5O.J. Simpson1969--1979buf-sfoRB4395048185.0711292144263514.469
6Earl Campbell1978--1985oti-norRB50120954094.47108.270111344183.9763.1
7Adrian Peterson2007--2011minRB3879240025.05105.33868530184.4179.4
8Chris Johnson2008--2011otiRB3677237764.89104.92842619414.5669.3
9Clinton Portis2002--2010den-wasRB58128160514.72104.359101940864.0169.3
10Arian Foster2009--2011htxRB2042820774.85103.91628213054.6381.6
11Emmitt Smith1990--2004dal-crdRB1353036131984.3597.8108172267433.9262.4
12Jamal Lewis2000--2009rav-cleRB74165371934.3597.263101938403.7761
13Walter Payton1975--1987chiRB1132460109754.4697.186155863834.174.2
14Larry Johnson2003--2011kan-cin-was-miaRB4081338424.7396.14362724133.8556.1
15Edgerrin James1999--2009clt-crd-seaRB99225194694.2195.66299536293.6558.5
16Billy Sims1980--1984detRB3060328614.7495.43255423784.2974.3
17Curtis Martin1995--2005nwe-nyjRB96223591344.0995.182146557623.9370.3
18Frank Gore2005--2011sfoRB4793944224.7194.15574333664.5361.2
19Jamaal Charles2008--2011kanRB1621815046.9943429016055.5347.2
20Steven Jackson2004--2011ramRB3776934734.5293.980138856884.171.1
21Shaun Alexander2000--2008sea-wasRB73150666074.3990.55985034104.0157.8
22LaDainian Tomlinson2001--2011sdg-nyjRB104204893464.5689.976125748063.8263.2
23Corey Dillon1997--2006cin-nweRB72139164604.6489.786134752893.9361.5
24Rudi Johnson2001--2008cin-detRB4190136724.0889.65262923633.7645.4
25Eddie George1996--2004oti-dalRB90209478633.7687.46097733543.4355.9
26Wilbert Montgomery1977--1985phi-detRB55101647664.6986.75465225133.8546.5
27Fred Taylor1998--2010jax-nweRB89158876744.8386.272107546344.3164.4
28Jamal Anderson1994--2001atlRB3776731894.1686.24763224233.8351.6
29Gale Sayers1965--1971chiRB2942624925.8585.93651021224.1658.9
30Barry Foster1990--1994pitRB3570429974.2685.62327512304.4753.5
31Curt Warner1983--1990sea-ramRB55113347044.1585.54863623893.7649.8
32Matt Forte2008--2011chiRB3566129854.5285.32739513983.5451.8
33Cookie Gilchrist1962--1967buf-den-miaFB3462528714.5984.43137213813.7144.5
34William Andrews1979--1986atlRB4374936094.8283.94258624394.1658.1
35Marshall Faulk1994--2005clt-ramRB99177483074.6883.989122745743.7351.4
36John Henry Johnson1960--1966pit-otiFB-HB3258926824.5583.83843517183.9545.2
37Tony Dorsett1977--1988dal-denRB1212237101374.5383.868100139853.9858.6
38Jerome Bettis1993--2005ram-pitRB111233392743.9883.593134550623.7654.4
39Priest Holmes1997--2007rav-kanRB61109350774.6583.24972933164.5567.7
40Ricky Watters1992--2001sfo-phi-seaRB91182375524.14836396337203.8659
41Jim Nance1965--1973nwe-nyjRB3057124554.381.86268025853.841.7
42Robert Smith1993--2000minRB63103951464.9581.74151722624.3855.2
43George Rogers1981--1987nor-wasRB53100943264.2981.64577231284.0569.5
44Jim Taylor1960--1967gnb-norFB81146865764.4881.23140115823.9551
45Travis Henry2001--2007buf-oti-denRB3667229064.3280.75281631803.961.2
46Willie Parker2004--2009pitRB5597744364.5480.72740314133.5152.3
47Ray Rice2008--2011ravRB4579236274.5880.62227411944.3654.3
48Maurice Jones-Drew2006--2011jaxRB4577636164.6680.45072232864.5565.7
49Deuce McAllister2001--2008norRB5091340174.480.34754322404.1347.7
50Thurman Thomas1988--2000buf-miaRB1302373103784.3779.87184331383.7244.2
51Terry Allen1991--2001min-was-nwe-nor-ravRB69130355044.2279.86589032633.6750.2
52Fred Jackson2007--2011bufRB2539319805.0479.24042418144.2845.4
53Jonathan Stewart2008--2011carRB2841422175.3679.23531412954.1237
54Franco Harris1972--1984pit-seaRB1362553106824.1878.55577629243.7753.2
55John Riggins1971--1985nyj-wasRB103204880883.9578.579111942603.8153.9
56Tiki Barber1997--2006nygRB80127762694.9178.480105446324.3957.9
57Lydell Mitchell1972--1980clt-sdg-ramRB58110344724.0577.14964522803.5346.5
58Ricky Williams1999--2011nor-mia-ravRB81148662214.1976.8709673868455.3
59Greg Bell1984--1990buf-ram-raiRB3559626414.4375.55068426763.9153.5
60Marshawn Lynch2007--2011buf-seaRB3159223373.9575.44356823384.1254.4
61Stephen Davis1996--2006was-car-ramRB72123454224.3975.36380731013.8449.2
62LeSean McCoy2009--2011phiRB2842721004.9275202259964.4349.8
63Domanick Williams2003--2005htxRB122268983.9774.82854422974.2282
64Hoyle Granger1966--1972oti-norRB2744320134.5474.63835815304.2740.3
65DeAngelo Williams2006--2011carRB3855728335.0974.64345122775.0553
66Rodney Hampton1990--1997nygRB56104841223.9373.65182629693.5958.2
67Ahman Green1998--2009sea-gnb-htxRB89141665454.6273.56375931814.1950.5
68Earnest Jackson1983--1988sdg-phi-pitRB3154422794.1973.54451518883.6742.9
69Lawrence McCutcheon1973--1981ram-den-sea-bufRB75124354624.3972.83842216934.0144.6
70Freeman McNeil1981--1992nyjRB71113251094.51727578233644.344.9
71Rashard Mendenhall2008--2011pitRB3764626434.0971.4172289544.1856.1
72Warrick Dunn1997--2008tam-atlRB98161869964.3271.492116743713.7547.5
73Cedric Benson2005--2011chi-cinRB5092535683.8671.44564724463.7854.4
74Natrone Means1993--1999sdg-jaxRB55100439173.971.23954919483.5549.9
75Gary Brown1991--1999oti-sdg-nygRB4061928414.59713542414763.4842.2
76Michael Turner2004--2011sdg-atlRB76113053914.7770.93837614573.8838.3
77Christian Okoye1987--1992kanRB447803120470.93544717713.9650.6
78Karim Abdul-Jabbar1996--2000mia-cle-cltRB3365123393.5970.93138811883.0638.3
79Garrison Hearst1993--2004crd-cin-sfo-denRB76121053854.4570.95568128404.1751.6
80Joe Morris1982--1991nyg-cleRB63110344604.0470.85044816783.7533.6
81Johnny Johnson1990--1994crd-nyjRB2442816853.9470.24761823933.8750.9
82Thomas Jones2000--2011crd-tam-chi-nyj-kanRB88154161543.9969.999126249503.9250
83Chuck Muncie1976--1984nor-sdgRB5181735544.3569.76585436644.2956.4
84Chuck Foreman1973--1980min-nweRB77132453184.0269.13842614093.3137.1
85Ottis Anderson1979--1992crd-nygRB94163064893.986980103342174.0852.7
86Larry Csonka1968--1979mia-nygRB91138762234.4968.46469125873.7440.4
87Randy McMillan1981--1986cltRB2028213654.8468.36669524843.5737.6
88John Brockington1971--1977gnb-kanRB3663724563.8668.25465123083.5542.7
89Ryan Grant2007--2011gnbRB4567030524.5667.82231312914.1258.7
90Willis McGahee2004--2011buf-rav-denRB66104244154.2466.96185933593.9155.1
91Ron A. Johnson1969--1975cle-nygRB3762924263.8665.64153317293.2442.2
92Joe Cribbs1980--1988buf-sfo-miaRB5583435804.2965.14952319613.7540
93Marcus Allen1982--1997rai-kanRB145222194334.2565.191106841573.8945.7
94Antowain Smith1997--2005buf-nwe-oti-norRB75124848723.9656167425593.842
95Larry Brown1969--1976wasRB69117144413.7964.43546417803.8450.9
96Kevin Jones2004--2008det-chiRB2232614154.3464.34146917613.7543
97Floyd Little1967--1975denRB4573828803.9646782031873.8947.6
98Wendell Tyler1977--1986ram-sfoRB7193145104.8463.54655024434.4453.1
99Ricky Bell1977--1982tam-sdgRB253971588463.53846215913.4441.9
100Abner Haynes1960--1967kan-den-mia-nyjHB4860130465.0763.56043915923.6326.5
101Cadillac Williams2005--2011tam-ramRB3350520944.1563.55056819933.5139.9
102Clem Daniels1960--1968kan-rai-sfoRB5168932364.763.54940116694.1634.1
103Pete Johnson1977--1984cin-sdg-miaRB64102839953.8962.45053818793.4937.6
104Leonard Russell1991--1996nwe-den-ram-sdgRB3154919343.5262.45161520393.3240
105Bam Morris1994--1999pit-rav-chi-kanRB396052423462.13744416363.6844.2
106Rueben Mayes1986--1993nor-seaRB3655522334.02624031412624.0231.6
107Errict Rhett1994--2000tam-rav-cleRB3663522133.4961.54253919303.5846
108Anthony Thomas2001--2007chi-dal-nor-bufRB3962823953.8161.44943115323.5531.3
109James Wilder1981--1990tam-detRB3248119644.0861.486112341603.748.4
110Joseph Addai2006--2011cltRB6294338044.0361.42631012704.148.8
111Marion Butts1989--1995sdg-nwe-otiRB507663067461.35560122623.7641.1
112Matt Snell1964--1972nyjRB4264125734.0161.33543518494.2552.8
113Delvin Williams1974--1980sfo-miaRB5174531154.1861.14758825254.2953.7
114James Brooks1981--1992sdg-cin-cle-tamRB8397650605.18618676731184.0736.3
115Kevin Mack1985--1993cleRB5175331094.13615464524383.7845.1
116Mike Thomas1975--1980was-sdgRB5279631633.9760.82831911483.641
117Neal Anderson1986--1993chiRB6899241304.1660.74960423153.8347.2
118Paul Lowe1960--1969sdg-kanHB6676739985.2160.62822810754.7138.4
119DeShaun Foster2003--2008car-sfoRB4768928334.1160.33332311383.5234.5
120Napoleon Kaufman1995--2000raiRB4651227605.39604646720364.3644.3
121Mike Garrett1966--1973kan-sdgRB6282337124.5159.94147717033.5741.5
122Dave Hampton1969--1976gnb-atl-phiRB3654721443.9259.65558322963.9441.7
123Leroy Kelly1964--1973cleRB92126854654.3159.44953821453.9943.8
124Sam Cunningham1973--1982nweRB5380031333.9259.15261524303.9546.7
125Duce Staley1997--2006phi-pitRB6692338814.258.85262123683.8145.5
126Charlie Garner1994--2004phi-sfo-rai-tamRB6983040354.8658.58278435034.4742.7
127Mike Rozier1985--1991oti-atlRB4565426224.0158.35256020223.6138.9
128Brian Westbrook2002--2010phi-sfoRB8097146604.858.34952922064.1745
129Mark van Eeghen1974--1983rai-nweRB96139355613.9957.94143217143.9741.8
130Julius Jones2004--2010dal-sea-norRB4868427754.0657.84863624723.8951.5
131Marion Barber2005--2011dal-chiRB5978334074.3557.74441415243.6834.6
132James Stewart1995--2002jax-detRB5482831083.7557.65368128954.2554.6
133Eddie Lee Ivery1979--1986gnbRB3540720144.9557.5342448913.6526.2
134Ken Willard1965--1974sfo-crdRB69100339553.9457.35857919633.3933.8
135Mike Pruitt1976--1986cle-buf-kanRB6794438404.0757.37692136053.9147.4
136Marv Hubbard1969--1977rai-detRB6676737734.9257.2242258673.8536.1
137Gerald Riggs1982--1991atl-wasRB6289435443.9657.272111046904.2365.1
138Ronnie Brown2005--2011mia-phiRB4359624484.1156.95058625224.350.4
139Adrian Murrell1993--2003nyj-crd-was-dalRB4463724943.9256.77276528623.7439.8
140Don Perkins1961--1968dalFB-HB5575831074.156.55175430794.0860.4
141Lamar Smith1994--2003sea-nor-mia-carRB5481130433.7556.45856520303.5935
142Mike Anderson2000--2007den-ravRB5871632544.5456.1402509763.924.4
143J.D. Smith1960--1966sfo-dalFB-HB3345118504.156.13641115643.8143.4
144Ted Brown1979--1986minRB5066027994.24565649919073.8234.1
145Dick Bass1960--1969ramFB-HB4759026124.4355.65956725044.4242.4
146Sammy Winder1982--1990denRB80119544433.7255.55242313563.2126.1
147Emerson Boozer1966--1975nyjRB5477429843.8655.35851820924.0436.1
148Ed Podolak1969--1977kanRB4865526304.0254.84742314823.531.5
149Earnest Byner1984--1997cle-was-ravRB111152260643.9854.610275730344.0129.7
150Brandon Jacobs2005--2011nygRB7186238694.4954.53933614414.2936.9
151Roger Craig1983--1993sfo-rai-minRB127165868734.1554.15352921063.9839.7
152Mel Farr1967--1973detRB3137716774.4554.1272929603.2935.6
153Bobby Humphrey1989--1992den-miaRB3342217814.22542234213383.9160.8
154Jim Otis1970--1978nor-kan-crdRB5778230573.9153.65139113353.4126.2
155Chris Warren1990--2000sea-dal-phiRB7087237434.2953.59194840614.2844.6
156Ahmad Bradshaw2007--2011nygRB5256527804.9253.5272469173.7334
157John Stephens1988--1993nwe-gnb-kanRB2841014773.652.85953519633.6733.3
158Gary W. Anderson1985--1993sdg-tam-detRB3642018994.5252.87344915103.3620.7
159Otis Armstrong1973--1980denRB5872130554.2452.73932114084.3936.1
160Mercury Morris1969--1976mia-sdgRB7473738965.2952.6331616824.2420.7
161Kevan Barlow2001--2006sfo-nyjRB3745119464.3152.65058320743.5641.5
162Tom Sullivan1972--1978phi-cleRB2637513593.6252.35148316833.4833
163Reggie Cobb1990--1996tam-gnb-jax-nyjRB2940715143.7252.26267022553.3736.4
164Hewritt Dixon1963--1970den-raiRB-TE5567728614.2352381615533.4314.6
165Altie Taylor1969--1976det-otiRB5471827943.8951.74541714063.3731.2
166Tony Collins1981--1990nwe-miaRB5668228854.2351.55355619623.5337
167Sherman Smith1976--1983sea-sdgRB3540317924.4551.25343117284.0132.6
168Justin Fargas2003--2009raiFB2528712784.4551.16554020913.8732.2
169Edgar Bennett1992--1999gnb-chiRB6489932643.63514737912893.427.4
170Terry Metcalf1973--1981crd-wasRB-WR4649923414.6950.93628212164.3133.8
171Calvin Hill1969--1981dal-was-cleRB96114548844.2750.95439515593.9528.9
172Michael Vick2001--2011atl-phiQB6545932877.1650.65129721657.2942.5
173MacArthur Lane1968--1978crd-gnb-kanRB5260226204.3550.46755118843.4228.1
174Larry Kinnebrew1983--1990cin-bufRB3745818634.0750.44032812873.9232.2
175Gerry Ellis1980--1986gnbRB4647923144.8350.35435014994.2827.8
176Barry Word1987--1993nor-kan-minRB4554122354.1349.7242238593.8535.8
177Johnny Roland1966--1973crd-nygRB4050119683.9349.24742714583.4131
178Herschel Walker1986--1997dal-min-phi-nygRB8496241224.2849.1106102042354.1540
179Curtis Dickey1980--1986clt-cleRB3038314673.8348.95155325454.649.9
180Keith Lincoln1961--1968sdg-bufFB-HB4744022945.2148.83830812554.0733
181Boobie Clark1973--1980cin-otiRB4860123113.8548.1312258373.7227
182Clarence Davis1971--1978raiRB7375935114.6348.1251666253.7725
183Michael Pittman1998--2008crd-tam-denRB6978233154.24488166524993.7630.9
184Tom Woodeshick1963--1972phi-crdRB3134614834.2947.85045619224.2138.4
185Tyrone Wheatley1995--2004nyg-raiRB6781831853.8947.56149218783.8230.8
186Charley Tolar1960--1966otiFB4657621733.7747.24235411833.3428.2
187Frank Pollard1980--1988pitRB5255124484.4447.15044717723.9635.4
188Lorenzo White1988--1995oti-cleRB5461225384.15475952619683.7433.4
189Ron Dayne2000--2007nyg-den-htxRB5469325373.66474232012713.9730.3
190Walter Abercrombie1982--1988pit-phiRB4551621134.09474236914233.8633.9
191Harvey Williams1991--1998kan-raiRB5363224873.9446.95541115283.7227.8
192Don Calhoun1974--1981buf-nweRB5557725324.39463928810443.6326.8
193Greg Hill1994--1999kan-ram-detRB5357924394.2146281967954.0628.4
194Roland Harper1975--1982chiRB3439815543.945.74036415014.1237.5
195Rob Carpenter1977--1986oti-nyg-ramRB7690434493.8245.44835412463.5226
196Dexter Bussey1974--1984detRB5757825714.4545.17662825514.0633.6
197Wray Carlton1960--1967bufHB-FB4347219354.1453833814024.1536.9
198John David Crow1960--1968crd-sfoHB-TE5253923244.3144.74535514254.0131.7
199Mike Alstott1996--2006tamRB89100239483.9444.47946914813.1618.7
200Dalton Hilliard1986--1993norRB6576228643.7644.14438313643.5631
201Joe Washington1977--1985sdg-clt-was-atlRB6467228194.19446254220763.8333.5
202Wilbur Jackson1974--1982sfo-wasRB3637115744.2443.76060823053.7938.4
203Nick Pietrosante1960--1967det-cleFB5052021854.243.73630612414.0634.5
204Mario Bates1994--2000nor-crd-detRB3844016443.7443.35341614393.4627.2
205Les Josephson1964--1974ramRB5855225014.5343.1352006283.1417.9
206Reggie Bush2006--2011nor-miaRB4542919384.5243.13634914384.1239.9
207Rocky Bleier1968--1980pitRB8586136024.1842.4362077403.5720.6
208Chris Brown2003--2009oti-htxRB3230213524.4842.33844217814.0346.9
209James R. Jones1983--1992det-seaFB-TE3742915553.62427557520243.5227
210Charlie H. Smith1968--1975rai-sdgRB6672127513.8241.7221737154.1332.5
211Don Woods1974--1980sdg-sfoRB2933812053.5741.64042518824.4347.1
212Wayne Morris1976--1984crd-sdgRB4749619513.9341.56439914323.5922.4
213LaMont Jordan2001--2009nyj-rai-nwe-denRB5346721804.6741.16046917703.7729.5
214Ernie Green1962--1968cleHB-FB6455626214.7141271346544.8824.2
215Doug Kotar1974--1981nygRB3132412533.8740.45857621273.6936.7
216Dorsey Levens1994--2004gnb-phi-nygRB104102841824.0740.24838014753.8830.7
217Charles White1980--1988cle-ramRB5148720394.19405130310683.5220.9
218Craig Heyward1988--1998nor-chi-atl-ram-cltRB7164728374.38407240715183.7321.1
219Reuben Droughns2001--2008det-den-cle-nygRB5047819934.1739.94745916383.5734.9
220Johnny Hector1983--1992nyjRB5856923064.0539.86348920074.131.9
221Harold Green1990--1998cin-ram-atlRB4744218664.2239.77872025543.5532.7
222Amos Marsh1961--1967dal-detHB-FB3126412224.6339.45241216554.0231.8
223Dave Osborn1965--1976min-gnbRB8288632323.6539.44735213123.7327.9
224Cid Edwards1968--1975crd-sdg-chiRB2923511434.8639.4494181670434.1
225Tom Matte1961--1972cltRB9494237003.9339.44329811473.8526.7
226John L. Williams1986--1995sea-pitFB8173931724.2939.27553119393.6525.9
227Ladell Betts2002--2010was-norRB5248120164.1938.86035613553.8122.6
228Walt Garrison1966--1974dalRB8777733194.2738.1372369754.1326.4
229Michael Bennett2001--2010min-kan-tam-sdg-raiRB4742417884.22386044020084.5633.5
230Wendell Hayes1963--1974dal-den-kanRB625872349437.95840114453.624.9
231Willie Ellison1967--1974ram-kanRB5549020624.2137.52624810164.139.1
232Essex Johnson1968--1976cin-tamRB4839917894.4837.36532914614.4422.5
233Jim Kiick1968--1977mia-denRB8079129723.7637.23431310563.3731.1
234Stump Mitchell1981--1989crdRB5143918904.3137.16451425735.0140.2
235John Fuqua1969--1976nyg-pitRB5752421014.0136.93723910874.5529.4
236Robert Newhouse1972--1983dalRB115103042374.1136.84230411983.9428.5
237Curtis McClinton1962--1968kanFB-TE5851721344.1336.8322429784.0430.6
238Leroy Hoard1990--1999cle-rav-car-minRB7667727964.1336.87039213973.5620
239Merril Hoge1987--1994pit-chiRB5650520274.0136.25435913593.7925.2
240Charlie Harraway1966--1973cle-wasRB6258822403.8136.1342759213.3527.1
241Larry Garron1960--1968nweHB-FB5245718774.1136.1372609193.5324.8
242Correll Buckhalter2001--2010phi-denRB6249022224.5335.8482229594.3220
243Erric Pegram1991--1997atl-pit-sdg-nygRB5856420673.6635.64132714504.4335.4
244Carl Garrett1969--1977nwe-chi-nyj-raiRB5043517524.03356460424784.138.7
245Rickey Young1975--1983sdg-minRB5852820323.85357347216053.422
246Greg Pruitt1973--1984cle-raiRB8861430785.01357157725174.3635.5
247Darrin Nelson1982--1992min-sdgRB7358325454.3734.97648320674.2827.2
248Lenny Moore1960--1967cltRB-WR5846720114.3134.7332479863.9929.9
249Donny Anderson1966--1974gnb-crdRB6859423493.9534.55758922563.8339.6
250Kenneth Davis1986--1994gnb-bufRB7760326564.434.55433313714.1225.4
251Tommy Mason1961--1971min-ram-wasRB6154421023.8634.55542418554.3833.7
252Chester Taylor2002--2011rav-min-chi-crdRB8672629534.0734.37047019324.1127.6
253Tony Nathan1979--1987miaRB8963630474.7934.2452149504.4421.1
254Dominic Rhodes2001--2010clt-raiRB7057823874.1334.14033413063.9132.7
255Timmy Brown1960--1968phi-cltRB5139017244.4233.85346320054.3337.8
256Dick Hoak1961--1970pitRB-WR4341314203.44337963823073.6229.2
257Bill Mathis1960--1969nyjFB-HB6661521643.5232.86041713803.3123
258Earl Gros1962--1970gnb-phi-pit-norFB4434814414.1432.85245516733.6832.2
259Bill Brown1961--1974chi-minRB9689331383.5132.77770924613.4732
260Anthony Johnson1990--2000clt-nyj-chi-car-jaxRB5348217123.5532.37437113893.7418.8
261Jess Phillips1968--1977cin-nor-rai-nweRB6244419804.4631.96145116013.5526.2
262Terry Kirby1993--2002mia-sfo-cle-raiRB6853821564.0131.75130510193.3420
263Ronnie Bull1962--1971chi-phiRB6052018963.6531.64932712483.8225.5
264Norm Bulaich1970--1979clt-phi-miaRB7255222754.1231.64630011953.9826
265John Cappelletti1974--1983ram-sdgRB7767624103.5731.3341836243.4118.4
266Sammy Morris2000--2011buf-mia-nwe-dalRB6544319894.4930.66529410733.6516.5
267Pete Banaszak1966--1978raiRB11386734533.9830.6401856373.4415.9
268Cullen Bryant1973--1987ram-seaRB9571827463.8228.9522449653.9518.6
269Maurice Morris2002--2011sea-detRB7653521694.0528.57637416004.2821.1
270Randall Cunningham1985--2001phi-min-dal-ravQB9848627015.5627.67333424757.4133.9
271Tony Galbreath1976--1987nor-min-nygRB7950421244.2126.99054420213.7222.5
272Matt Suhey1980--1989chiRB8460222573.7526.9592698453.1414.3
273Kordell Stewart1995--2005pit-chi-ravQB7641019924.8626.25420411645.7121.6
274Steve Young1985--1999tam-sfoQB12555032365.8825.96026815975.9626.6
275Steve McNair1995--2007oti-ravQB10047924885.1924.97224514575.9520.2
276Donovan McNabb1999--2011phi-was-minQB10645823915.2222.67422914886.520.1
277Kevin Faulk1999--2011nweRB12565327434.221.95429912894.3123.9
278Preston Pearson1968--1980clt-pit-dalRB11860723803.9220.25837713313.5322.9
279Keith Byars1986--1998phi-mia-nwe-nyjFB-TE11953718933.5315.97931811543.6314.6
280John Elway1983--1998denQB16359822793.81149226615535.8416.9
281Fran Tarkenton1961--1978min-nygQB13139017104.3813.111729219346.6216.5

[continue reading…]

{ 4 comments }

Adrian Peterson’s amazing, except when the Vikings win

Adrian Peterson is having an incredible season. He’s likely to hit the 2,000-yard mark on Sunday, and he’s also chasing Eric Dickerson’s single-season rushing record. But his splits this year are…interesting.

The table below shows Adrian Peterson’s game logs. These display his traditional statistics, along with his Win Probability added, Expected Points Added, and Success Rate, all courtesy of Advanced NFL Stats; finally I have added the Vikings SRS score for that particularly game (on the season, Minnesota has an SRS of +3.0).

G#OppW/LScoreRshYdsYPCTDRecYdsWPAEPASR(%)SRS
1JAXW26-2317844.9230.172.550-12.2
2INDL20-2316603.8020-0.02-2.240-5.7
3SFOW24-1325863.4021-0.1-2.433.318.3
4DETW20-13211024.90200.051.8407.5
5TENW30-717885.2015-0.12-1.533.39.3
6WASL26-3817794.6050-0.061.642.3-5.9
7ARIW21-14231536.7160.120.433.30.8
8TAML17-36151238.214-0.070.743.8-22.9
9SEAL20-301718210.72110.379.552.45.7
10DETW34-24271716.3150.04-0.7254.5
11CHIL10-28181086030-0.030.860-7.8
12GNBL14-2321210101100.4210.443.51.5
13CHIW21-143115452160.242.345.511.2
14STLW36-22242128.8100.216.945.816.8
15HOUW23-625863.404-0.1-525.924.5
Total31418986112151.1225.140.23

A robot and a vegan walk into a bar...

A robot and a vegan walk into a bar...

Peterson has only had two games this season where he averaged fewer than 3.5 yards per carry. Those two games were, without question, the two most impressive wins of the year for the Vikings. Peterson had identical stat lines of 25 carries/86 yards/0 touchdowns in shocking upsets over the 49ers and Texans.
[continue reading…]

{ 2 comments }

Checkdowns: Some Bo Jackson stats

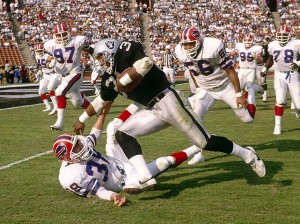
The Bills get to know Bo.

Tonight ESPN aired You Don’t Know Bo, another excellent documentary in its 30 for 30 series. It’s often said that Bo Jackson’s greatness can’t be captured by statistics. While that’s undoubtedly true, there are still some ways to use Jackson’s numbers to give a glimpse into the type of player he was. A few years ago, Jason Lisk talked about Bo in this podcast and noted that Bo had the longest rush in the NFL in three of the four seasons he played. Jackson and O.J. Simpson remain the only two players to record the league’s longest rush in three different NFL seasons.

There are other ways to capture what Bo did in his brief career. Because he was busy being a baseball player, Bo missed the first third of the season each year. If we look at the data starting in week 7, from 1988 to 1990, Bo compares pretty favorably to the elite running backs of his day. Over that span he ranked third in rushing yards while averaging over five yards per carry:

Rank Player From To Tm G Att Yds Y/A TD
1 Eric Dickerson* 1988 1990 CLT 30 606 2536 4.18 19
2 Thurman Thomas* 1988 1990 BUF 30 519 2221 4.28 16
3 Bo Jackson 1988 1990 RAI 30 423 2143 5.07 11
4 James Brooks 1988 1990 CIN 30 383 2082 5.44 16
5 John Stephens 1988 1990 NWE 31 523 1989 3.80 10
6 Herschel Walker 1988 1990 TOT 30 494 1985 4.02 13
7 Barry Sanders* 1989 1990 DET 20 370 1968 5.32 19
8 Neal Anderson 1988 1990 CHI 29 455 1951 4.29 14
9 Roger Craig 1988 1990 SFO 27 445 1874 4.21 12
10 Earnest Byner 1988 1990 TOT 31 438 1697 3.87 14

[continue reading…]

{ 9 comments }

Running back success rate

Grading running backs can be tricky; rushing yards tell much of the story but remain a function of opportunity (itself an indicator of talent). Yards per carry sounds nice but often is more misleading than revealing. Last year at Smartfootball.com I analyzed team rushing games using rush success rate, and I will do the same today. Success rate has been around for awhile – The Hidden Game of Football wrote about it in the late ’80s and Football Outsiders has been tracking it for close to a decade. Everyone has their own unique definition, it seems; here is mine.

C.J. Spiller is a success.

  • I started with every play from scrimmage where a running back was credited with a carry. I then removed all instances of 3rd or 4th down carries where the back needed to gain more than 5 yards for a first down, since the primary goal in these situations usually isn’t to get the first down. However, on the rare occasions where a running back did convert for the first down, those plays were kept in the data set. This has only happened 20 times this season.
  • On 3rd and 4th down, a success is a rush that gains a first down (or touchdown). A failure is every carry that does not result in a first down.
  • On 2nd down, a success is achieved when the player gains at least 50% of the yards needed for the first down. This means that 2nd-and-8 runs are failures unless they pick up 4 yards; on 2nd-and-7, the running back must also gain at least 4 yards. A rush for one yard on 2nd-and-3 is a failure, and so on.
  • On 1st down, a running back is credited with a successful carry if he gains at least 40% of the yards needed; therefore, four yards are required on 1st-and-10 before the running back is given credit. On 1st and goal from the 5, a two-yard gain would be considered a success.

The league average success rate by these rules is 49.8%. The table below lists all running backs with at least 50 carries, along with their number of rushes (which excludes the excluded carries), number of successful runs, and their success rate. The table is sorted by the far right column, which shows how many successes over 50% of their runs the player had. In the event of a tie, the player with more carries was ranked higher.
[continue reading…]

{ 19 comments }

Trivia of the Day – Saturday, October 27th

Last week, I noted that Calvin Johnson was trying to become just the third player since 1970 to lead the NFL in receiving yards in consecutive seasons. The rushing crown is much more likely to go to the same player; in fact, ten rushing champions since 1973 also led the league in rushing yards in the prior season.

Maurice Jones-Drew led the league in rushing in 2011, but isn’t going to repeat in 2012. Who was the last player to win the rushing crown in consecutive years?

Trivia hint 1 Show


Trivia hint 2 Show


Trivia hint 3 Show


Click 'Show' for the Answer Show

{ 0 comments }

www.notacompiler.com.

Career statistics can be very misleading, since a player can hang around for a bunch of meaningless years but really pad his totals. Six years ago, Doug came up with a system that only counted the receiving yards a player recorded after his first 1,000 receiving yards each season.

I’m going to do something similar for running backs, but instead will focus on individual game performances. I have game logs for every running back (post-season included) for every game since 1960. What I did was zero out all rushing yards in games where a player had 50 or fewer rushing yards; in the remaining games, I only gave those runners credit for the rushing yards they gained after their first 50 rushing yards. The “RYov50” column shows the running back’s career rushing yards after removing the first 50 rushing yards he had in every game; the next column shows each player’s career rushing yards (since 1960, including post-season), and the first “Perc%” column shows the ratio of the “RYov50” column to the career rushing yards. A higher percentage means the player spent most of his time as the lead back for his team, while a lower percentage indicates that the player spent significant time in a committee and/or stuck around for several years past his prime. Obviously for still active players, the percentage column could be misleading as they may not have entered the decline portion of their careers just yet.

The #50YG column shows how many games the player had over 50 rushing yards, and the next column shows what percentage of games the running back gained over 50 yards. For players like Jim Brown, this study only includes his seasons starting in 1960, and for active players, 2012 data is *not* included:
[continue reading…]

{ 11 comments }

Trivia of the Day – Sunday, September 9th

The eyes have it.

Welcome back, NFL. The first of 17 great Sundays is upon us, and this is always one of my favorite days of the year. I’ll even put up with the garbage that is pre-game and post-game shows to watch football from 9 in the morning until after midnight. I’m sure many of you will do the same, so good luck to whomever you’re rooting for today.

In Friday’s post, I noted that Anquan Boldin gained 217 receiving yards in week 1 of the 2003 season, trailing only Frank Clarke (1962) for most receiving yards on opening weekend.

But as you get ready for today’s actions, chew on this trivia question. Which player gained the most rushing yards in week 1 of an NFL season? Like yesterday, I’ve given you a special hint with this mystery photo.

Trivia hint 1 Show


Trivia hint 2 Show


Trivia hint 3 Show


Click 'Show' for the Answer Show

{ 0 comments }

I broke down each of the NFL and AFL champions since 1950 into three categories:

  • Pass Efficiency, measured by a modified version of ANY/A. The formula was (Passing Yards + 10*TD – 22.5*INT – Sack Yards)/(Pass Attempts + Sacks). This strikes a middle ground between traditional ANY/A and NY/A.
  • Rushing Success, according to the following formula: (Rushing Yards + 10*RTD + 5*Rushing1stDowns)/(Carries).
  • Defensive Rating, based on the number of offensive touchdowns scored by their opponents.

There are ways to quibble with those categories, and I won’t begrudge anyone who does. After giving each team a rating in each category, I calculated how they compared to the league average in each season. In all cases, the average is 100%, and a number higher than 100% means better.

Here’s what each of the columns mean, from left to right. In 2011, the New York Giants won the Super Bowl; they allowed 43 touchdowns to opposing offenses, averaged 7.6 in my modified version of ANY/A, and averaged 4.9 adjusted yards per carry. The next three columns show how New York ranked relative to league average. By allowing 43 scores, the Giants D was well below average, putting them at 83% of the average mark; they were 25% better than average at passing, but only 86% of league average efficiency in the running game. Since the Giants highest rating came in the passing category, they are listed in the Identity column as a Passing team.
[continue reading…]

{ 8 comments }

McFadden begs you not to touch him.

Darren McFadden has missed games due to injury in each of his four seasons in the NFL. But he earns the label “injury prone” instead of “bust” thanks to his incredible production the past two years. In 2010 and 2011, McFadden totaled 2,432 yards from scrimmage and 15 touchdowns in 20 games while averaging 5.3 yards per carry and 10.0 yards per reception.

But is the injury prone label fair? From a rearview standpoint, it certainly is. But the label carries with it the perception that he will continue to be injury prone. Is that fair?

From a statistical standpoint, we’re really limited by sample size. In the past two decades, only a handful of young running backs have been as productive as McFadden despite dealing with significant injury issues. Ricky Williams played in 12 and 10 games his first two seasons, and earned the injury prone label before three straight 16-game seasons. Steven Jackson missed games here and there early in his career, and in fact still has just two 16-game seasons in his career. But Jackson is no longer considered injury prone and has also registered three 15-game seasons.

Fred Taylor resided for years at the intersection of talented and injury prone, earning colorful nicknames like ‘Fragile Fred’ and ‘Fraud Taylor.” He played in only 40 games in his first four seasons, but still scored 37 touchdowns, averaged 4.7 yards per carry, and averaged 106 yards from scrimmage per game. He would play in 16 games each of the next two seasons, before missing games due to injury every other season for the rest of his career.

Cadillac Williams played in 14 games in each of his first two seasons, and things only got worse from there. He played in just 10 games the next two seasons, before playing in 16 games in both 2009 and 2010. Julius Jones missed significant time in each of his first two seasons, but then played in 16 games in each of his next two years. On the other hand, Kevin Jones’s career went 15-13-12-13-11 in terms of games played. Robert Smith was a track star on the gridiron and often seemed as tough as one. In his first two seasons as the starter with the Vikings, he wound up being inactive half of the time each year. In 1997 and 1998, he played in 14 games, but Smith would only play one 16-game season in the NFL: his last one.

But back to McFadden. Let’s start with some baseline about what the anti-McFadden would look like. From 1990 to 2010, there were 91 [1]This excludes Robert Edwards, Jamal Lewis and Terry Allen, each of whom would suffered a season-ending injury prior to the start of the following season. running backs, age 25 or younger, who rushed for at least 1,000 yards and played in 16 games. Only 38 of those 91 running backs (42%) played in 16 games the next season, while the group averaged 13.9 games played in the following year. The median was 15 games played, with 58% of running backs playing in 15 or 16 games.
[continue reading…]

References

References
1 This excludes Robert Edwards, Jamal Lewis and Terry Allen, each of whom would suffered a season-ending injury prior to the start of the following season.
{ 1 comment }

Expect more MJD-style holdouts in the future

Jones-Drew's problems go back to how he was viewed as a college prospect.

The Maurice Jones-Drew holdout is slightly different than the typical holdouts we see every summer. As a 27-year-old running back, Jones-Drew is seeking his last big contract. But with a new owner and regime in Jacksonville, management is understandably hesitant to give a large contract to a player who already has two years remaining on his deal. The difference between Jones-Drew and most players is that this is his last chance to cash in. If he plays out his contract, even if he plays well the next two seasons, he’s unlikely to get a huge deal in 2014.

Would that be fair? I would hope that some of those writers who argued in favor of reducing rookie contracts would find such a result unjust, as a talented, star player should be rewarded with a big contract. [1]This is obviously shtick, but I do find it hypocritical for owners to argue against paying “unproven” players and then to argue against paying aging players who “have little … Continue reading But even if he performs well in 2012 and 2013, by 2014, Jones-Drew would be a 29-year-old runner who had just endured five years of punishment as a workhorse running back. No team would sign him to a large contract at that point, as he could not be expected to continue to produce at such a high level.

When it comes to running backs, it is understood that they must try to maximize their salaries when they are young, as big paydays for older runners are few and far between. But in this situation, some have argued that since this is Jones-Drew’s second contract, he should honor his deal (or, alternatively, that we should be less sympathetic to his cause). In 2009, Jones-Drew signed his second contract, and the argument goes that unlike a rookie contract — where players have almost no leverage — Jones-Drew already had his bite at the apple. But that argument ignores the fact that Jones-Drew’s rookie contract remains part of his current predicament.
[continue reading…]

References

References
1 This is obviously shtick, but I do find it hypocritical for owners to argue against paying “unproven” players and then to argue against paying aging players who “have little left” in the tank. Players should be paid for what we expect them to produce, and the “unrpoven” argument is and always has been a red herring.
{ 9 comments }

The best rookie season and best career from the class of '89.

Yesterday, I looked at how frequently the highest drafted rookie running back ended leading his draft class in rushing yards. Today, we’ll examine how often the best rookie running back ends up being having the most career rushing yards among the members from his class.

I performed this same exercise at wide receiver, and concluded that as great as A.J. Green was last season, the odds were stacked against him leading the 2011 rookie receiver class in career receiving yards. [1]From 1978 to 2008, only three of the 31 wide receivers with the best rookie seasons ended up with the most receiving yards from their class. For whatever reason, there simply is not a strong correlation between rookie performance and career performance for wide receivers. Is the same true at the running back position?

There was an eleven-year stretch from ’92 to ’02, when Ricky Watters, Jerome Bettis, Marshall Faulk, Curtis Martin, Eddie George, Corey Dillon, Fred Taylor, Edgerrin James, LaDainian Tomlinson, and Clinton Portis each led their class in rushing yards both as rookies and over the course of their careers. The lone exception came in 2000, when Mike Anderson nudged by Jamal Lewis to lead the ’00 class in rookie rushing yards, while Lewis ended with the most career rushing yards. If I had written this article a decade ago, I would have thought that unlike at the receiver position, there was an extremely strong correlation between rookie and career performance for the top running backs.

But since then, things have changed. Domanick Williams (Larry Johnson), Kevin Jones (Steven Jackson), Cadillac Williams (Frank Gore), Joseph Addai (Maurice Jones-Drew), Steve Slaton (Chris Johnson), and Knowshon Moreno (Arian Foster) led all rookies in rushing yards but have been passed in the career category by another back from the same rookie class. It’s too early to get a handle on the last two draft classes, although I certainly wouldn’t take even odds on either Ben Tate or LeGarrette Blount finishing with the most career rushing yards of any running back who entered the league in either 2010 or 2011.

The table below shows the top rookie running backs and the top career running backs from each class since 1978.
[continue reading…]

References

References
1 From 1978 to 2008, only three of the 31 wide receivers with the best rookie seasons ended up with the most receiving yards from their class.
{ 0 comments }

An ordinary running back.

Last month, I wondered whether previous Justin Blackmons — i.e., the first receiver selected in the draft — lived up to their lofty draft status. There have been 42 drafts since 1970, but only five times has the highest selected wideout gained the most receiving yards among all rookie receivers. The long-term odds were slightly better, though, as nearly a quarter of those highest selected receivers ended up with the most receiving yards in his draft class.

So how do things look at the running back position? The Bills drafted Willis McGahee knowing he would miss his entire rookie season, while Bo Jackson chose to play baseball instead of playing with the Buccaneers. Ki-Jana Carter and Larry Stegent suffered season-ending injuries in the pre-season of their rookie years, making them inapplicable for our purposes, assuming Richardson stays healthy. What about the other 38 running backs who were the first at their position selected in the draft since the merger?

Over 40% of those highest drafted running backs led their class [1]Note that this only includes drafted running backs. in rushing yards as a rookie, while exactly half gained at least 75% as many rushing yards as the the most productive rookie running back. That may not be particularly impressive in the abstract, but represents a much better track record than we saw at the wide receiver position. On the other hand, recent history has not been particularly great: in the past 10 years, arguably every top rookie running back outside of Adrian Peterson disappointed, as even Moreno failed to meet the expectations of many.

YearRunning BackTeamPickCollegeRush Yds% of LeaderTop Rookie
2011Mark IngramNOR28Alabama4740.53DeMarco Murray
2010C.J. SpillerBUF9Clemson2830.42Ryan Mathews
2009Knowshon MorenoDEN12Georgia9471.00Knowshon Moreno
2008Darren McFaddenOAK4Arkansas4990.39Steve Slaton
2007Adrian PetersonMIN7Oklahoma13411.00Adrian Peterson
2006Reggie BushNOR2USC5650.52Joseph Addai
2005Ronnie BrownMIA2Auburn9070.77Cadillac Williams
2004Steven JacksonSTL24Oregon St.6730.59Kevin Jones
2003Willis McGaheeBUF23Miami (FL)----Domanick Williams
2002William GreenCLE16Boston Col.8870.59Clinton Portis
2001LaDainian TomlinsonSDG5TCU12361.00LaDainian Tomlinson
2000Jamal LewisBAL5Tennessee13640.92Mike Anderson
1999Edgerrin JamesIND4Miami (FL)15531.00Edgerrin James
1998Curtis EnisCHI5Penn St.4970.41Fred Taylor
1997Warrick DunnTAM12Florida St.9780.87Corey Dillon
1996Lawrence PhillipsSTL6Nebraska6320.46Eddie George
1995Ki-Jana CarterCIN1Penn St.----Curtis Martin
1994Marshall FaulkIND2San Diego St.12821.00Marshall Faulk
1993Garrison HearstPHO3Georgia2640.18Jerome Bettis
1992Tommy VardellCLE9Stanford3690.65Vaughn Dunbar
1991Leonard RussellNWE14Arizona St.9591.00Leonard Russell
1990Blair ThomasNYJ2Penn St.6200.66Emmitt Smith
1989Barry SandersDET3Oklahoma St.14701.00Barry Sanders
1988Gaston GreenRAM14UCLA1170.10John Stephens
1987Alonzo HighsmithHOU3Miami (FL)1060.16Christian Okoye
1986Bo JacksonTAM1Auburn----Rueben Mayes
1985George AdamsNYG19Kentucky4981.00George Adams
1984Greg BellBUF26Notre Dame11001.00Greg Bell
1983Eric DickersonRAM2SMU18081.00Eric Dickerson
1982Darrin NelsonMIN7Stanford1360.20Marcus Allen
1981George RogersNOR1South Carolina16741.00George Rogers
1980Billy SimsDET1Oklahoma13031.00Billy Sims
1979Ottis AndersonSTL8Miami (FL)16051.00Ottis Anderson
1978Earl CampbellHOU1Texas14501.00Earl Campbell
1977Ricky BellTAM1USC4360.43Tony Dorsett
1976Chuck MuncieNOR3California6591.00Chuck Muncie
1975Walter PaytonCHI4Jackson St.6790.74Mike Thomas
1974Bo MatthewsSDG2Colorado3280.28Don Woods
1973Otis ArmstrongDEN9Purdue900.09Boobie Clark
1972Franco HarrisPIT13Penn St.10551.00Franco Harris
1971John RigginsNYJ6Kansas7690.70John Brockington
1970Larry StegentSTL8Texas A&M----Duane Thomas

Richardson is the favorite to be the most productive rookie running back, although “the field” appears to be a more enticing proposition. But Cleveland drafted Richardson for what he can do for the next five or ten years, which will ultimately be much more significant than how he performs in 2012. Even if the highest drafted running back is unlikely to lead his draft class in rushing yards as a rookie, is he more likely (than the field) to lead his draft class in career rushing yards?
[continue reading…]

References

References
1 Note that this only includes drafted running backs.
{ 11 comments }

Trivia of the Day – Saturday, August 4th

Congratulations to the six members of the Pro Football Hall of Fame Class of 2012: Curtis Martin, Dermontti Dawson, Chris Doleman, Cortez Kennedy, Willie Roaf, Jack Butler

Tonight, those six men will be inducted into the Hall of Fame, a must-see event for any football fan. You can also read the Hall of Fame Candidate Profiles that Jason Lisk and I wrote for the PFR Blog a couple of years ago, including profiles on Martin, Dawson, Doleman, and Kennedy.

On to Saturday’s trivia…

Peterson needs to make more defenders cry if he wants to up his career averages.

Jim Brown had a magnificent career, averaging 104.3 yards per game during his 118-game career. Brown retired as the all-time leading rusher in both yards and yards per game. While he’s since been passed in the rushing yards category, Brown remains the only player (minimum 20 games) to average over 100 rushing yards per game for his career. Barry Sanders rushed for 15,228 yards in the first 152 games of his career, putting him just north of the century average. But in his 153rd and final game he gained only 41 yards, ending his career with a 99.8 rushing yards per game average.

Adrian Peterson has rushed for 92.5 yards per game so far in his career, although that number is likely to go down by the time he retires. The Vikings star is currently fourth on the career rushing yards per game list, which leads us into today’s trivia question:

After Jim Brown and Barry Sanders, which player has averaged the most career rushing yards per game?

Trivia hint 1 Show


Trivia hint 2 Show


Trivia hint 3 Show


Click 'Show' for the Answer Show

{ 2 comments }

Trivia of the Day – Sunday, July 29th

One of the five most versatile running backs of the last 30 years -- P.K.

Yesterday’s question focused on which leading wide receiver led the NFL in yards per reception. Today, we’ll look at running backs in a similar light.

Carolina’s Cam Newton led the league in yards per carry in 2011, which isn’t that unusual. Michael Vick led the league in that category in five of the last ten seasons, and it wouldn’t be shocking to see Robert Griffin III, Newton, or Vick lead the NFL in yards per carry in 2012. But today’s trivia is focused on running backs.

Darren Sproles not only led the Saints in rushing yards, but he averaged an incredible 6.9 yards per carry last season. Sproles may be the game’s most dominant space player, but he fell 13 carries shy of the 100 carries necessary to qualify for the yards-per-carry crown. So which qualifying running back led the league in yards per carry in 2011?

Trivia hint 1 Show


Trivia hint 2 Show


Trivia hint 3 Show


Click 'Show' for the Answer Show

{ 0 comments }

Bill Barnwell wrote an interesting article where he tried to identify the best running back in football. His article made me wonder: which player will gain the most rushing yards over the next decade?

It probably makes sense to start with a look at history. I suspect you would have been able to guess that LaDainian Tomlinson had the most rushing yards from 2002 to 2011, but what about from 1982 to 1991? Or from 1960 to 1969? The table below shows each leader in rushing yards for every ten year period, along with their age and NFL experience during their first season during the relevant period.

YearsRush YdsPlayerBeg AgeBeg Exp.
1932--19413860Clarke Hinkle231
1933--19423529Clarke Hinkle242
1934--19433132Tuffy Leemans22--
1935--19443132Tuffy Leemans23--
1936--19453132Tuffy Leemans241
1937--19462529Pug Manders24--
1938--19472813Steve Van Buren18--
1939--19483758Steve Van Buren19--
1940--19494904Steve Van Buren20--
1941--19505533Steve Van Buren21--
1942--19515860Steve Van Buren22--
1943--19525860Steve Van Buren23--
1944--19535860Steve Van Buren241
1945--19545416Steve Van Buren252
1946--19554817Joe Perry19--
1947--19565337Joe Perry20--
1948--19575791Joe Perry21--
1949--19586549Joe Perry22--
1950--19597151Joe Perry233
1951--19606599Joe Perry244
1952--19616597Joe Perry255
1953--19627459Jim Brown17--
1954--19639322Jim Brown18--
1955--196410768Jim Brown19--
1956--196512312Jim Brown20--
1957--196612312Jim Brown211
1958--196711370Jim Brown222
1959--19689843Jim Brown233
1960--19698514Jim Brown244
1961--19707257Jim Brown255
1962--19716074Leroy Kelly20--
1963--19726885Leroy Kelly21--
1964--19737274Leroy Kelly221
1965--19747262Leroy Kelly232
1966--19758123O.J. Simpson19--
1967--19769626O.J. Simpson20--
1968--197710183O.J. Simpson21--
1969--197810776O.J. Simpson221
1970--197910539O.J. Simpson232
1971--198010051O.J. Simpson243
1972--198110339Franco Harris221
1973--198210204Walter Payton19--
1974--198311625Walter Payton20--
1975--198413309Walter Payton211
1976--198514181Walter Payton222
1977--198614124Walter Payton233
1978--198712805Walter Payton244
1979--198811410Walter Payton255
1980--198911226Eric Dickerson20--
1981--199011903Eric Dickerson21--
1982--199112439Eric Dickerson22--
1983--199213168Eric Dickerson231
1984--199311451Eric Dickerson242
1985--19949346Eric Dickerson253
1986--199510172Barry Sanders18--
1987--199611725Barry Sanders19--
1988--199713778Barry Sanders20--
1989--199815269Barry Sanders211
1990--199913963Emmitt Smith211
1991--200014229Emmitt Smith222
1992--200113687Emmitt Smith233
1993--200212949Emmitt Smith244
1994--200311719Emmitt Smith255
1995--200413366Curtis Martin221
1996--200512614Curtis Martin232
1997--200611462Curtis Martin243
1998--200711607Edgerrin James20--
1999--200812121Edgerrin James211
2000--200912490LaDainian Tomlinson21--
2001--201013404LaDainian Tomlinson221
2002--201112448LaDainian Tomlinson232

Steve Van Buren in the middle of his most famous performance.

Tomlinson entered the league in 2001, but he was so productive in his first nine years that he also led the league in rushing yards gained from 2000 to 2009. O.J. Simpson, Eric Dickerson and Barry Sanders each led the league in rushing yards for ten year periods … when they spent the first three seasons of those decades playing college ball. Jim Brown was even more impressive, as he led the NFL in rushing yards from 1953 to 1962, even though he was just 17 years old in 1953 and did not enter the league until 1957.

But Steve Van Buren has them all beat: he entered the league in 1944, but led all players in rushing from 1938 to 1947. As you may recall, he’s still the Eagles franchise leader in rushing touchdowns. We can also look at the leaders over the last nine seasons, although obviously the ten-year windows are not closed in these cases:

YearsRush YdsPlayerBeg AgeBeg Exp.
2003--201110765LaDainian Tomlinson243
2004--20119120LaDainian Tomlinson254
2005--20118420Steven Jackson222
2006--20117374Steven Jackson233
2007--20116752Adrian Peterson221
2008--20115645Chris Johnson231
2009--20114417Chris Johnson242
2010--20112930Maurice Jones-Drew255
2011--20111606Maurice Jones-Drew266

So what can we make of the results? The average running back was just a hair under 22 at the start of his ten year period. Nearly half of all running backs were not yet in the NFL at the start of their ten year run, although that is likely to change now. Those players were in other football leagues, serving their country, or in college, but all three of those factors are less prevalent now. Star running backs leave college a year or two earlier than they did a generation ago, which will make it slightly less likely that a player will not be in the NFL at the start of the next ten-year run.

Fourteen players were rookies at the start of their great stretch, and another 10 were second year players, making nearly 80% of the players having just one year or less of experience in the summer before the start of their streak. What does that mean for the stretch from 2012 to 2021? Trent Richardson is the ideal candidate, as the new Browns running back just turned 21. Last year’s Alabama running sensation, Mark Ingram, was 22 in 2011, while Dion Lewis and Jacquizz Rodgers were the top 21-year-old running backs last season.

The rushing champ from 2012 to 2021?

No running back started his 10-year stretch atop the leaderboard at the age of 26, and only Hall of Famers Steve Van Buren, Joe Perry, Jim Brown, Walter Payton, Eric Dickerson and Emmitt Smith were 25 at the start of a streak. That makes it pretty easy to rule out Maurice Jones-Drew, Matt Forte, Adrian Peterson and Chris Johnson, all of whom will be 27 in 2012. Ray Rice (25 in 2012), Arian Foster (26), Marshawn Lynch (26) and Ryan Mathews (25) are probably suckers’ bets, too.

LeSean McCoy, Beanie Wells and DeMarco Murray all are entering their age 24 season, making them perhaps the best hope among the young runners with NFL experience. On the other hand, along with Richardson, Doug Martin, David Wilson, Ronnie Hillman and Lamar Miller made the 2012 draft strong at the position. In the NFC West, Isaiah Pead and Kendall Hunter (or LaMichael James) could be the future for their teams for the next decade. As always, it’s too early to say.

In the collegiate ranks, South Carolina’s Marcus Lattimore is expected to be the cream of the 2013 class, with Auburn transfer Michael Dyer and Wisconsin’s Montee Ball also in the mix. And based on past history, we can’t count out sophomores Malcolm Brown or De’Anthony Thomas. If you had to pick which player will lead the league in rushing yards from 2012 to 2021, Trent Richardson is the obvious choice. After him, I’d probably be pretty evenly split among McCoy, Martin and Lattimore.

{ 6 comments }

Franchise leaders — rushing stats

Yesterday, we took a look at the franchise leaders in various passing categories. Let’s do the same for running backs today. The first list shows the leaders in career rushing yards for each franchise; the last column shows the last year that running back played for that franchise:

TeamYardsRunning BackLast Yr
STL9093Steven Jackson
SFO7625Frank Gore
CAR5047DeAngelo Williams
SDG12490LaDainian Tomlinson2009
GNB8322Ahman Green2009
JAX11271Fred Taylor2008
NOR6096Deuce McAllister2008
SEA9429Shaun Alexander2007
KAN6070Priest Holmes2007
NYG10449Tiki Barber2006
BAL7801Jamal Lewis2006
NYJ10302Curtis Martin2005
IND9226Edgerrin James2005
HOU3195Domanick Williams2005
TEN10009Eddie George2003
CIN8061Corey Dillon2003
DAL17162Emmitt Smith2002
DEN7607Terrell Davis2001
MIN6818Robert Smith2000
BUF11938Thurman Thomas1999
DET15269Barry Sanders1998
OAK8545Marcus Allen1992
TAM5957James Wilder1989
ATL6631Gerald Riggs1988
CHI16726Walter Payton1987
ARI7999Ottis Anderson1986
WAS7472John Riggins1985
PHI6538Wilbert Montgomery1984
PIT11950Franco Harris1983
NWE5453Sam Cunningham1982
MIA6737Larry Csonka1979
CLE12312Jim Brown1965

[continue reading…]

{ 3 comments }

Is Matt Forte an elite running back?

Let’s flash back to December 1, 2011. At the time, Chicago Bears star Matt Forte was having the best season of his career and making a claim to being one of the league’s top five running backs. He was leading the league in yards from scrimmage. He was averaging 5.0 yards per rush. He also ranked in the top three in both receptions and receiving yards by a running back. He had gained 1,475 yards from scrimmage through 11 games, the second most in Bears history.

Forte sprained the medial collateral ligament in his right knee in week 13, costing him the remainder of the season. He has been in disputes with the Bears over his contract for the last two years, but that’s not the focus of this article today. For whatever reason, I’ve often struggled with the notion of Forte being an elite player.

Actually, I know the exact reason. There are two of them. First, Forte was not an elite running back prospect and seems to have average physical skills for a starting running back. He wasn’t a high draft pick and doesn’t have elite measurables (his 40-yard dash time was good, but his metrics in the other tests were underwhelming). This, of course, is just about meaningless when discussing a player who has been in the league for four years. Plenty of players have had average measurables and great careers at the running back position, and it’s not difficult to think of players drafted later than Forte who have turned into great backs.
[continue reading…]

{ 3 comments }

A closer look at running back aging patterns

Frank Gore is 29 years old and has been the featured back of the 49ers since 2006. Steven Jackson turns the same age in three weeks, and has been beaten and bruised while playing on bad teams his whole career. Michael Turner had his 30th birthday in February, and has accumulated 300 carries in three of the last four years. Fred Jackson (31) and Willis McGahee (31 in October) have had varying degrees of wear and tear during their careers, and are both competing with younger backs on their roster.

We know the wheels will fall off for these players. But do we know when? And how severe the drop-off will be? Each running back is unique, with his own genetics, history, and supporting cast. It’s difficult to find true comparisons to any one running back, let alone a group of runners. Still, we can try to identify the general aging pattern of top tier running backs.

I looked at all running backs who entered the league in 1990 or later, rushed for at least 5,000 rushing yards, averaged at least 40 rushing yards per game for their careers, and are retired. There were 36 such running backs.

Now we need a metric to measure running back productivity. Generally, I don’t think people worry about running backs failing to be factors in the passing game as they age; Kevin Faulk set a career high in receiving yards at age 32. I don’t think the focus is on touchdown production, either, and we all remember Jerome Bettis still being a short-yardage force even when he was well past his prime. No, when people discuss running backs hitting a wall and deteriorating, the focus is on declining rushing yards and rushing yards per carry. One metric I’ve used before is called “Rushing Yards Over 2.0 Yards Per Carry” or RYO2.0, for short. As the name implies, a running back gets credit for his yards gained over 2.0 yards per carry, so 300 carries for 1000 yards is worth 400 marginal yards, as is 1,060 yards on 330 carries. Essentially, we’re looking at just rushing yards with a small adjustment depending on the player’s yards per carry average.

I calculated the RYO2.0 for each of the 36 running backs at ages 22 through 34. The red line represents the average RYO2.0 for the group at each age for all 36 backs; the green line represents the average RYO2.0 only for those backs who were active in the league at that age.

Running Back production by age


[continue reading…]

{ 10 comments }

Steven Jackson is the Ollie Matson of the 21st century. What does that mean? Before we answer that, take a look at Steven Jackson’s impressive career:

Rushing Receiving
Year Age Tm Att Yds TD Y/A Rec Yds Y/R TD YScm RRTD
2004 21 STL 134 673 4 5.0 19 189 9.9 0 862 4
2005 22 STL 254 1046 8 4.1 43 320 7.4 2 1366 10
2006* 23 STL 346 1528 13 4.4 90 806 9.0 3 2334 16
2007 24 STL 237 1002 5 4.2 38 271 7.1 1 1273 6
2008 25 STL 253 1042 7 4.1 40 379 9.5 1 1421 8
2009* 26 STL 324 1416 4 4.4 51 322 6.3 0 1738 4
2010* 27 STL 330 1241 6 3.8 46 383 8.3 0 1624 6
2011 28 STL 260 1145 5 4.4 42 333 7.9 1 1478 6
Career 2138 9093 52 4.3 369 3003 8.1 8 12096 60

[continue reading…]

{ 6 comments }
Next Posts