≡ Menu

Bad Teams Doing Well In Good Divisions

In 2012, the Rams went 4-1-1 in the NFC West, but 3-7 against the rest of the NFL. The NFC West was pretty good that year, which made that even more remarkable: St. Louis had the best record in intradivision games of any NFC West team, but the worst interdivision record.

Then, last year, the Rams did it again, going 4-2 against the NFC West (best record, tied with Arizona) but a division-worst 3-7 against the rest of the NFL.

How often does it happen that a team does this? Perhaps more frequently than you might think. The Bills swept the Dolphins and Jets last year, but were swept by New England. Meanwhile, the Patriots dropped a game to both Miami and New York. But while the Patriots (8-2), Jets (7-3), and Dolphins (5-5) fared better against non-AFC East competition last year, the Bills went 4-6 outside of the division.

Since 2002, it has happened 24 times. Take a look:

YearTmDivIntra W%Inter W%Div Strength
2008NYJAFCEast0.6670.5000.650
2002ATLNFCSouth0.6670.5500.638
2015BUFAFCEast0.6670.4000.600
2005WASNFCEast0.8330.5000.600
2012STLNFCWest0.7500.3000.575
2015STLNFCWest0.6670.3000.575
2002NWEAFCEast0.6670.5000.575
2002NYJAFCEast0.6670.5000.575
2012CARNFCSouth0.5000.4000.550
2012TAMNFCSouth0.5000.4000.550
2012NORNFCSouth0.5000.4000.550
2009NYGNFCEast0.6670.4000.550
2009CINAFCNorth1.0000.4000.525
2009MIAAFCEast0.6670.3000.500
2011KANAFCWest0.5000.4000.475
2010OAKAFCWest1.0000.2000.475
2006GNBNFCNorth0.8330.3000.450
2011PHINFCEast0.8330.3000.450
2006ARINFCWest0.6670.1000.425
2013DETNFCNorth0.6670.3000.425
2006CARNFCSouth0.8330.3000.425
2013DALNFCEast0.8330.3000.400
2010SFONFCWest0.6670.2000.325
2014ATLNFCSouth0.8330.1000.263

The standard bearer for the most Rams team of the post-2002 era? All four AFC East teams won at least 7 games, and the division was 65% (24-16) of its interdivision games that year, the 2nd best season in AFC East history (1999). In those games, the Bills, Dolphins, and Patriots all went 7-3, while the Jets (with Brett Favre) went 5-5. You might think that means the Jets would have struggled in division games, but New York went 4-2, as did New England and Miami, while Buffalo went 0-6.

{ 4 comments }

Tony Galbreath, A Forgotten Record Holder

Galbreath with the Saints

Galbreath with the Saints

Throughout his playing career, Walter Payton was chasing the ghost of Jim Brown.  At the end of the 1981 season, Payton was in 5th place on the career rushing list.  By ’82, he was in 4th; after ’83, he was up to 3rd place. Then, in 1984, Payton passed both Francos Harris and Brown to move into the top spot on the career rushing yards list.

But at the same time that he was chasing a much more flesh-and-blood figure: Saints/Vikings/Giants running back Tony Galbreath. Let’s jump in a time machine back to 1982. At that time, just seven players had at least 75+ career rushing attempts and 375+ career receptions. Three were Hall of Famers Bobby Mitchell, Charley Taylor, and Elroy Hirsch, but all three players made the HOF in large part because of their work as wide receivers. All three players entered professional football as running backs.

Crazy Legs switched after four years (and just one with the Rams) to become a wide receiver on the high-flying Rams of the early ’50s. Taylor was a running back his first two seasons — and a Pro Bowl one at that — but switched positions midway through the 1966 season and remained at wide receiver the rest of his career. Mitchell was stuck behind Brown in Cleveland, but it wasn’t until he was traded to Washington after his fourth season that he become a receiver.

A fourth member of the 75/475 list was Bobby Joe Conrad. who played with the Cardinals in the ’60s. He also switched positions early in his career, and turned into a star receiver almost immediately. As a result, only three true running backs were on the list: Lydell Mitchell, Rickey Young, and Joe Morrison. A star with the Giants in the ’60s, Morrison retired in 1972; he was still the career leader in receptions by a running back a decade later, with 395 receptions. Mitchell, a borderline HOF running back with the Colts, got up to 376 before retiring. Through age 29, he had 355 receptions and had topped 55 catches in each of his last five years; while he would have seemed like a lock to break Morrison’s record, he caught just two more passes the rest of his career.

That leaves Young, a fullback with the Chargers and Vikings. He caught a league-high 88 passes in ’78, and was at 387 receptions as of 1982. He turned 30 in 1983, his final season in the NFL, but caught another 21 passes, breaking Morrison’s record and retiring as the running back catch king, with 408 grabs. But Morrison didn’t retire with an easy stomach: both Payton and Galbreath were hot on his tails.

As of 1983, Payton, who entered the league in 1975, had 328 receptions. But Galbreath was already at 364 receptions, despite entering the NFL a year later. In ’84, Galbreath became just the second pure running back to hit the 400-catch mark; by ’85, Payton had become the third, and Galbreath had supplanted Morrison as the running back catch king. After ’86, Payton had really narrowed the gap: he had 459 career receptions, while Galbreath was at 464. Who would win up as the all-time running back catch king? That left the 1987 season as the battle ground for the highest of stakes: both Payton and Galbreath would retire after the season.

In the season opener, the duo squared off, with all eyes watching the race with a secondary battle between the Giants and Bears taking place. Payton caught three passes, giving him 462 for his career; Galbreath had just one, upping his total to 465.

By November 8th, Payton had closed the gap entirely: both players stood with 475 career receptions. The next week, Payton had a Pyrrhic victory: his Bears lost in Denver, but he became the running back catch king with the first of his three receptions that day (Galbreath had none). [continue reading…]

{ 5 comments }

In 2013, Brandon Marshall caught 100 passes and 12 touchdowns for the Chicago Bears and made the Pro Bowl. His teammate, Matt Forte, also made the Pro Bowl on the basis of 1,933 yards from scrimmage and 12 scores of his own.

Marshall had 109 receptions and tied for the league-lead with 14 touchdowns last year as a member of the Jets, and earned another Pro Bowl nod. Forte had a down year, but is only one year removed from an 1,846 yards from scrimmage season. With Forte now in New York, the players are teammates again. And, if both make the Pro Bowl this year, they will join a pretty rare group: teammates who made the Pro Bowl for multiple franchises. In fact, only four players of teammates have ever done it.

Reggie White made the Pro Bowl 13 times in his career, including in 1988, 1989, and 1990 for the Eagles.  In those years, his teammate, tight end Keith Jackson, also earned trips to Honolulu.  White went to Green Bay in ’93 and made the Pro Bowl in each of his six seasons with the Packers.  In ’95, Jackson reunited with White in Green Bay, and the duo made the Pro Bowl together again in 1996.

Guard Randall McDaniel made 12 Pro Bowls in his career; every year of his 14 year career, in fact, other than his first and last seasons. In ’98 and ’99, he was joined by the man playing next to him on the line, Vikings center Jeff Christy. After the ’99 season, both players left for Tampa Bay, and the duo made the Pro Bowl their first season with the Bucs, too. [continue reading…]

{ 9 comments }

Trivia: Home/Road Wins in Division Games

Assume Team A and Team B are in the same division. In the first regular season matchup, Team A plays Team B at home, and wins. If this is all you know, how likely would you say Team A is to win in the rematch?

On one hand, we now know that Team A has to travel on the road for the rematch, and road teams win about 43% of the time. But we also have some evidence that Team A is better than Team B, so how does that impact things? And what about the idea that it’s hard to sweep a team — does that play into things?

I looked at all division matchups from 1970 to 2015. There were 1,297 times when the home team won the first matchup among division opponents — let’s call that team, Team A. What was Team A’s record in the rematch on the road at Team B?

Take a second to think about it.

….

[continue reading…]

{ 9 comments }

Brad Oremland noted in his last post that Stanley Morgan is the only player in history to average more than 19 yards per catch in a career with at least 500 receptions, and that such distinction will probably stand forever. Brad’s likely right: given today’s environment, Vincent Jackson and Calvin Johnson are the two preeminent deep threats of the last decade with at least 500 catches, and Jackson (16.97) and Johnson (15.89) were far shy of that mark.

That’s a fun bit of trivia, but let’s expand it. You can use reception cut-offs to come up with lots of Yards per Catch Kings. Here’s an exhaustive one:

  • Jerry Rice is the all-time leader in yards per reception (14.78) among players with at least 1,079 receptions.
  • Terrell Owens (14.7811 to Rice’s 14.7805) is the all-time leader in yards per reception among players with at least 1,025 receptions.
  • Isaac Bruce is the career leader in YPR, at 14.85, among players with at least 983 receptions.
  • Randy Moss (15.57) is the only player to average 15 yards per reception and record 820+ receptions.

[continue reading…]

{ 18 comments }

Who Is The Most Jeff Fisher Coach of All-Time?

It’s easy to make fun of Jeff Fisher, who has a reputation for being the very definition of mediocre. A search for “Jeff Fisher 7-9” on Twitter will send you down the rabbit hole. But do the numbers back it up? Is Fisher as average as it gets?

He has won 6 or 7 games in his last five seasons, and went 8-8 in the season before that. In 10 of his 20 full seasons as a head coach, he’s won 7 or 8 games. But Fisher did go 13-3 three times, and won double digit games three other times. So how do we measure how “Jeff Fisher” a coach is?

The key, I think, is being average. Mike Mularkey has a 4-21 record over the last 10 years. He went 2-14 with the Blaine Gabbert/Maurice Jones-Drew/Justin Blackmon Jaguars in 2012, and then 2-7 as the interim head coach for the Titans last year. We don’t want to count that as being “Jeff Fisher-like.” [continue reading…]

{ 8 comments }

We’ve been talking a bit about Charlie Joiner over the past few days. Here’s a good comment from Brad O, where he called Joiner “the best receiver on the best passing team this side of Dan Marino.”

Brad is right in that Joiner generally played on very good passing teams. That wasn’t the case during his years in Houston, but beginning in 1974, Joiner generally played on top-5 passing teams for over a decade. With the Bengals and Ken Anderson, Joiner’s team ranked 4th in value added over average in 1974, defined as (ANY/A minus league-average ANY/A) multiplied by team pass attempts. The next year, his Bengals led the league in passing Value. [continue reading…]

{ 17 comments }

Torry Holt and 700+ Receiving Yards in Every Season

In yesterday’s post, Torry Holt played in the NFL for 11 seasons. His rookie year, he gained 788 yards for the ’99 Rams; his last year in St. Louis, he gained 796 yards. In fact, Holt’s 2007 season remains the last time any Rams receiver had 800 yards in a season.

In Holt’s final year, 2009, he gained 722 yards with the Jaguars. Holt was never a compiler: his 13,382 career receiving yards has very little “junk” in them. So here’s some Sunday trivia: he’s the only player in NFL history to have retired with at least 10 seasons with 700+ receiving yards and zero seasons without 700+ receiving yards.

Some other notable players:

  • Sterling Sharpe only played for seven seasons, but his minimum year was even better; Sharpe gained 791 yards as a rookie, 961 in 1991, and over 1,000 yards in every other season.  Ditto Calvin Johnson who had 756 yards as a rookie, 984 in 14 games in 2009, and over 1,000 yards in his other seven seasons.  Holt, Sharpe, and Johnson are the only retired players with at least 700 yards in 7+ seasons, and zero seasons below that threshold.
  • Keyshawn Johnson played for 11 years, and had 600+ yards in each of them. Rob Moore played for ten seasons, and had at least 600 receiving yards in each of them.  Eddie Brown hit that mark for each of his seven seasons. No other retired player but those three, Holt, Sharpe, and Johnson played multiple seasons and had at least 600 receiving yards each year. [1]Yes, Art Weiner played for one season and had 722 receiving yards, and Sylvester Morris had 678 yards in his lone season.
  • Larry Fitzgerald had played for 12 seasons, and never fallen below 780 yards.  His former teammate, Anquan Boldin has played for 13 seasons, and never fallen below 623 yards.

References

References
1 Yes, Art Weiner played for one season and had 722 receiving yards, and Sylvester Morris had 678 yards in his lone season.
{ 11 comments }

I’ve got no time today, so just a fun checkdown. Here is a look at the franchise record-holders in rookie receiving yards.

TeamReceiverYearYards
Oakland RaidersAmari Cooper20151070
Carolina PanthersKelvin Benjamin20141008
Buffalo BillsSammy Watkins2014982
New York GiantsOdell Beckham20141305
San Diego ChargersKeenan Allen20131046
Jacksonville JaguarsJustin Blackmon2012865
Cincinnati BengalsA.J. Green20111057
Atlanta FalconsJulio Jones2011959
Baltimore RavensTorrey Smith2011841
Denver BroncosEddie Royal2008980
Philadelphia EaglesDeSean Jackson2008912
Kansas City ChiefsDwayne Bowe2007995
New Orleans SaintsMarques Colston20061038
Detroit LionsRoy Williams2004817
Tampa Bay BuccaneersMichael Clayton20041193
Arizona CardinalsAnquan Boldin20031377
Houston TexansAndre Johnson2003976
Miami DolphinsChris Chambers2001883
Cleveland BrownsKevin Johnson1999986
Minnesota VikingsRandy Moss19981313
New England PatriotsTerry Glenn19961132
New York JetsKeyshawn Johnson1996844
St. Louis RamsEddie Kennison1996924
Seattle SeahawksJoey Galloway19951039
Indianapolis ColtsBill Brooks19861131
Washington RedskinsGary Clark1985926
San Francisco 49ersJerry Rice1985927
Dallas CowboysBob Hayes19651003
Tennessee TitansBill Groman19601473
Pittsburgh SteelersJimmy Orr1958910
Chicago BearsHarlon Hill19541124
Green Bay PackersBilly Howton19521231

Please leave your thoughts in the comments.

{ 3 comments }

Are the Cardinals in Their Glory Years, Too?

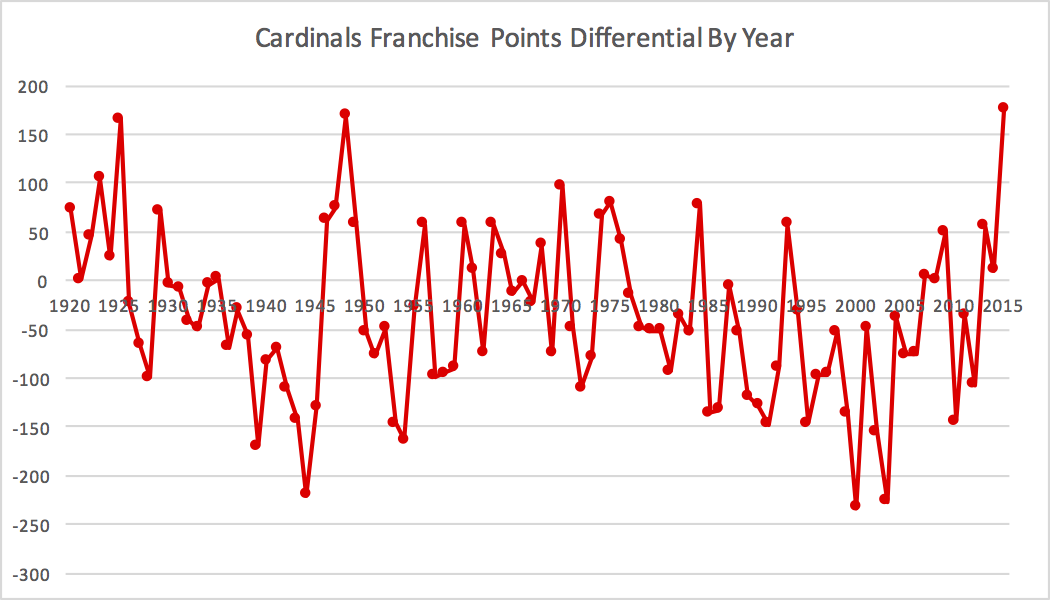
Over the weekend, I wrote that the Bengals are currently in their glory years. Is the same true of the Cardinals? Last year, Arizona outscored opponents by 176 points, even after being outscored by 30 points in the meaningless season finale. That mark narrowly edged the ’48 team (+169) for the best margin in franchise history (of course, it did not win on a per-game basis):

cards pd [continue reading…]

{ 1 comment }

This tweet, sent out on Monday by Jimmy Kempski, caught my eye:

Entering last season, the Cowboys had Greg Hardy (34 career sacks prior to 2015) and Jeremy Mincey (26).  Both players are now free agents, although it is possible one or both returns to Dallas in 2016.  But if the Cowboys don’t add anyone, that would mean inside linebacker Rolando McClain — who has 9.5 career sacks — would be the Cowboy with the most career sacks. The same goes for cornerback Orlando Scandrick, also stuck on 9.5 [continue reading…]

{ 1 comment }

Yesterday, I looked at the players with the most yards from scrimmage in a season among players who had just one-game seasons. Today, let’s do the same but for quarterbacks.  The table below shows all players with at least 150 passing yards, and is sorted by AY/A: [continue reading…]

{ 3 comments }

Star Players for 1 Game Seasons

Catchy title, I know. Bill Barnwell sent out a pair of tweets on Cleveland Cavs player Dahntay Jones, who played in just one game this season but logged 42 minutes. Barnwell used the Basketball-Reference Play Index to note that it was the most time any player had seen in a single game, among the group of players who played in exactly one game in a season.

So, naturally, I started wondering about one-game superstars in the NFL. Courtesy of PFR, the table below shows all players with at least 60 yards from scrimmage in a season in which they played in just one game: [continue reading…]

{ 12 comments }

Yesterday, I looked at the career leaders in fourth quarter/overtime game-winning field goals. It’s fun — in a purely trivial way — to see which kickers have made the most game-winners, but that’s only half the story. What about which kickers have missed the most key field goals?

I looked at all field goal attempts since 1994 that came when the game was tied or the kicking team was trailing by 1 or 2 points. I did not make any adjustments for era, or distance, or weather, since this is a trivia post on a Sunday in May. That said, man was Todd Peterson good at missing key field goals. Like, really, really good.

He missed 17 of his 34 field goal attempts in this situation; not only was that 50% rate the worst for any kicker with more than five misses, but his 17 misses truly lapped the field. [continue reading…]

{ 0 comments }

On Thursday, I looked at the quarterbacks with the most game-winning touchdown passes that came in the fourth quarter or overtime. Yesterday, I did the same for all touchdowns scored, either as a running touchdown, receiving touchdown, or otherwise. Three years ago, I looked at the same concept but for field goals: today, we revisit that post.

At the time, Morten Andersen was the career leader with 35, while Adam Vinatieri was hot on his trails with 30. Well, Vinatieri didn’t have a single game-winning field goal after the third quarter of any game in 2013 or 2014, but he then did it three times in two months last year (against Jacksonville in overtime from 27 yards, a 55-yarder against the Broncos with 6 minutes left, and a 43-yarder in the final minute against Atlanta.

Of his 33 game-winning field goals, 16 have been from 40+ yards away, with five of those being from 50+ yards, while his average game-winning field goal has come from 37.1 yards: [continue reading…]

{ 5 comments }

Three years ago, I looked at the players who have scored the most game-winning touchdowns in NFL history. Let’s be clear: tracking things like game-winning touchdowns is only interesting in a trivial sort way, but hey, it’s May.

Yesterday, I looked at which players had the most game-winning touchdown passes, so today we look at all other scores (whether rushing, receiving, via fumble recovery or later, or even non-offensive TDs). I looked at all games, regular and postseason, in all leagues, from 1940 to 2015 (and playoff games from pre-1940), and counted all touchdowns scored that put the player’s team ahead for good (with one exception: I did not count touchdowns scored when down by 7 and the team successfully went for two afterwards).

The table below lists all players with at least four such touchdowns. As he was three years ago, Marcus Allen stands alone with 10 game-winning touchdowns, including one via fumble recovery. [continue reading…]

{ 4 comments }

Three years ago, I looked at the career leaders in 4th quarter (and overtime) game-winning touchdown passes. That post is ready for an update, and there’s been some interesting movement at the top of the charts.

As a reminder: tracking things like game-winning touchdowns is only interesting in a trivial sort way. I looked at all games, regular and postseason, in all leagues, from 1940 (and before 1940 for postseason games) to 2015, and counted all touchdowns scored that put the player’s team ahead for good (with one exception: I did not count touchdowns scored when down by 7 and the team successfully went for two afterwards). The table below shows all players with at least 4 such game-winning touchdown passes.

Incredibly, Johnny Unitas is still the record-holder in this category. In 23 games, Unitas threw a touchdown pass in the fourth quarter to win the game for the Colts. His first came against Washington in 1956, with his last coming 14 years later against the Bears. The table below provides a link to all 23 such fourth-quarter, game-winning touchdown throws by Unitas: [continue reading…]

{ 20 comments }

Tom Brady and Drew Brees ended the 2015 season in a pretty remarkable place: both have 428 touchdown passes, tied for the third most in NFL history.  Both threw their first touchdown pass in 2001, which makes it easy — and fun! — to compare the two players.  The graph below shows the number of career touchdown passes for each player over every week since 2001:

brady brees td

Brady took an early edge, both because he started earlier (he had 18 touchdowns in 2001; Brees had 1) and played better earlier (Brees had 28 touchdowns in ’02 and ’03 combined; Brady had that many just in ’03).  And, of course, Brady’s scorched-earth 2007 season helped see him take his biggest lead.  Consider that through 2007, Brees had thrown fewer than 30 touchdown passes in each of his first seven seasons. Since then? Brees has thrown more than 30 touchdowns in all eight seasons! [continue reading…]

{ 7 comments }

Consecutive Playoff Losses For a Franchise

From 1993 to 2015, the New York Islanders lost eight consecutive playoff series, beginning with a loss in the conference finals to Montreal in 1993, and culminating in a heartbreaking, 7-game series loss last year to Washington. Last night, the Isles came from behind and defeated Florida, to win the series, four games to two.

So the streak stopped at eight for the Islanders; as it turns out, the longest streaks for consecutive playoff losses in NFL history is also at eight, with two of those streaks being active. [continue reading…]

{ 6 comments }

Yesterday, I wrote how the NBA seemed to undervalue the three-point shot for many years. While the 3-point shot was consistently the better EV play, and the ratio of three-point shots to overall shots was increasing, it didn’t seem to increase quickly enough. As pointed out in the comments, one could make a pretty similar claim about pass/run ratio in the NFL.

It’s a little misleading to start things in 1970, since that’s really the beginning of the dead air era in football history. Pass efficiency was very high in the late ’40s and parts of the ’60s, so a chart beginning in 1970 would inaccurately imply a linear progression of the passing game. That said, because first down data is spotty the farther back we go, and because of the complexity involved in deciding how to treat the AFL, I’m going to limit myself today to the period from 1970 to 2016. [continue reading…]

{ 5 comments }

NBA 3-Point Attempts and Going For it On 4th Down

In overly simple terms (ignoring things like fouls, rebounds, game theory, etc.), the expected value of a 2-point field goal attempt is the 2-point field goal percentage multiplied by 2, and the expected value of a 3-point field goal attempt is the 3-point field goal percentage multiplied by 3. Here’s a look at the EV for both 2-point and 3-point attempts in every NBA season going back to 1979-1980, courtesy of basketball-reference:

nba

The inflection point came right around 1990; after that, the 3-point shot was associated with a higher expected value, and since ’97-’98, the 3-point shot has about 12% more EV than a 2-point shot. Now, I know just about nothing about the NBA and even less about NBA analytics, but it’s easy to draw a couple of conclusions from this chart. One would be that teams should be taking more 3-pointers, even though “traditional coaches” have not been fans of the 3-point shot. It’s easy to look at this chart and dismiss it, and say that a team shouldn’t take a bunch of 3 pointers just because the math says it makes sense. On the other hand, you have the Golden State Warriors. [continue reading…]

{ 11 comments }

Quarterbacks Going 1-2 in the NFL Draft, Part II

A year ago, I wrote that quarterbacks going with the first two picks in the NFL Draft was a pretty unusual thing. From 1967, the start of the common draft, through 2011, it happened just four times. Since then, it has happened two more times, and now will apparently happen in 2016, too, after the Eagles sent way too many draft picks to the Browns for the right to pick second overall. We can save for another day how this was a shrewd move by Cleveland — if nothing else, the Browns do have a history of getting a boatload to move down, including in trades for Sammy Watkins and Julio Jones — and a head-scratcher for the Eagles.

This move also opens up San Diego as the team “in control” of the draft, non-QB edition. The Chargers will now take the first non-QB off the board. Unfortunately, that’s a lot less exciting than it sounds, although it may come with it the ability to extract some trade value, potentially from the Cowboys at #4. Let’s take a look at the six times since 1967 that quarterbacks went 1-2, and who was the first non-QB taken. [continue reading…]

{ 6 comments }

You probably heard that Kobe Bryant has retired from the NBA. In his final game, he put up a whopping 60 points, albeit on a modern record 50 shot attempts. On twitter, Topher_Doll asked me what were some of the greatest final games in NFL history.

Since 1970, there have been 37 times where a player eclipsed 100 yards from scrimmage in his final game. This includes Calvin Johnson, but not Johnny Manziel, who rushed for over 100 yards in his last game but is not exactly out of the NFL just yet. The record-holder is Domanick Williams (formerly Davis) of the Houston Texans, who had a very successful but short career that was ended by a knee injury. [continue reading…]

{ 14 comments }

Yesterday, I looked at the Pythagenpat records for all teams since 2000. Since I crunched all that data, I thought it would be fun to look at the biggest outlier teams.

The 2003 Steelers were not very good. Pittsburgh went 6-10, scoring 200 points and allowing 327 points. Because of regression to the mean, the ’04 Steelers were expected to be a little better, and finish with 7.2 wins. Instead, behind a rookie Ben Roethlisberger and an outstanding running game and defense, the Steelers went 15-1, exceeding expectations by 7.8 wins.

Last year’s Panthers also went 15-1, and have a similar story. Cam Newton, the AP MVP, was more of the driving force, of course, but a great running game and defense powered the team. But based on a mediocre ’14 season, Carolina was expected to win only 7.8 games, so the 2015 Panthers exceeded expectations by 7.2 wins.

The third biggest outlier? That would be the ’07 Patriots, who went 16-0 with a projection of just 9.5 wins. The next year, New England was projected to win 10.99 games, and… went 11-5.

The table below shows each team since 2000, and their number of projected and actual wins. The table is sorted by the difference column: [continue reading…]

{ 2 comments }

Over the last week, I’ve looked at the biggest quarterback declines and quarterback turnarounds when it comes to career records. But there were some limitations in those studies, so today, I want to use a new method.

I assigned 20 games of .500 play — i.e., a 10-10 record — to each quarterback’s record after every start of his career. Then I checked to see which quarterbacks had the biggest declines/improvements in record/rest-of-career record using these metrics.

Let’s take Marc Bulger as an example. He started 95 games in his career. At one point, he was 28-11, which is a 0.718 winning percentage. For the rest of his career, he went 13-43, for a 0.232 winning percentage. If we add 20 games of .500 play to his first stint, that makes him 38-21, which translates to a 0.644 winning percentage. For his rest of career, his record would go down as 23-53, a 0.303 adjusted winning percentage. That’s an adjusted winning percentage decline of 0.341, the most of any quarterback in history. [continue reading…]

{ 10 comments }

Jim Brown, Bobby Boyd, and Retiring Early

The GOAT.

The GOAT.

Jim Brown is the standard bearer for athletes who retired too young, and for very good reason. Brown led the NFL in rushing yards, rushing touchdowns, yards from scrimmage, and total touchdowns in his final season in 1965, all while averaging 5.3 yards per run and 9.6 yards per reception. With D’Brickashaw Ferguson choosing to retire “early” yesterday, on the heels of Calvin Johnson doing the same thing, I decided to run a quick query on the players who were best in the final season of their career.

The table below shows all players who had at least 10 points of Approximate Value in the final season of their career (Megatron had 10 points of AV in 2015; Ferguson had 9) and whose last season came in 2014 or earlier. [1]Note that Patrick Willis had just 3 points of AV in his final year in the NFL.  As it turns out, Brown ranks tied for first on this list, next to Colts defensive back Bobby Boyd.

Here’s how to read the table below. Boyd’s last season came in 1968 with Baltimore.  Playing left cornerback, he accumulated 21 points of AV that year at the age of 31. He received a number of awards that season: he was 1st-team All-Conference (that’s what the + sign means) according to the Sporting News, and a 1st-team All-Pro choice by the AP, Pro Football Writers, NY Daily News, Pro Football Weekly, and the UPI. [continue reading…]

References

References
1 Note that Patrick Willis had just 3 points of AV in his final year in the NFL.
{ 7 comments }

Fran Tarkenton, Warren Moon, and Career Turnarounds

Getting 62 wins is much easier the second time around

Getting 62 wins is much easier the second time around

A couple of days ago, I looked at the quarterbacks with the best records before ultimately finishing their careers with losing records. Today, the reverse, and we start with Hall of Famer Fran Tarkenton, who has a fascinating career split.

Tarkenton went 124-109-6 in his 18-year career with the Vikings and Giants. His first 62 wins took him a long time; at age 32, he was 62-86-4 after a week 6 loss to the Bears in 1972. At 24 games under .500 and with a career 0.421 winning percentage, Tarkenton was a five-time Pro Bowler with little to show for it and zero career playoff appearances.

But for the rest of his career, he won another 62 games, and he did so much quicker, going 62-23-2. That’s 41 games over .500 and a 0.724 winning percentage. That’s extremely impressive, of course, enough to make Tarkenton have a career 0.531 winning percentage. And, among quarterbacks who finished their career at .500 or better, Tarkenton is the only quarterback to ever be 24 games below .500 at any point in his career.

Although one could argue that Warren Moon had an even more remarkable career turnaround. I’ve written before about the terrible Oilers franchise that Moon joined in the mid-’80s. After 43 games, Moon had a 10-33 record. While it took Tarkenton 152 games to get to 24 games below .500, Moon was one shy of that mark in over 100 fewer games! At that point, the odds of Moon — then 30 years old — finishing his career with a winning record would have been seen as astronomically low. Yet he did just that, going 92-68 over the remainder of his career. [continue reading…]

{ 2 comments }

The under-appreciated Jim Hart

The under-appreciated Jim Hart

Yesterday, I noted that Cleveland Browns quarterback Bernie Kosar had a 39-23-1 career record after the 1989 season, but actually finished his career with a losing record. That sounded pretty wild to me, so I wanted to investigate further.

Kosar’s Browns defeated the Steelers in the 1990 season opener, which brought his career record to 40-23-1, or 17 games over .500. But Kosar went just 13-31 over his final 44 games; after a 0.633 winning percentage in his first 64 games, he posted a 0.295 winning percentage for the remainder of his career.

So I wondered, among quarterbacks who finished their career with a .500 record or worse, does Kosar hold the record for most games above .500 at any one point? As it turns out, that honor goes to Jim Hart. Younger fans likely know very little about Hart, but he’s one of the better quarterbacks not in the Hall of Fame. He spent 18 years with the Cardinals, and made the Pro Bowl in four straight seasons from ’74 to ’77. By 1981, he ranked third all time in career passing yards and ninth in passing touchdowns. He made it into the top 50 on Brad Oremland’s list, and snuck into the top 30 on my list.

But if you look at the raw numbers, you’re likely to be unimpressed. That’s because the bulk of his career took place during the ’70s, but also because he retired with an 87-88-5 record. But as of November 20th, 1977, Hart had a 69-47-5 record, a 0.591 winning percentage. Of course, it was all downhill from there for Hart, who went just 18-41 (0.305) for the rest of his career. [continue reading…]

{ 10 comments }

Bob Ford, a longtime fan of Pro-Football-Reference and Football Perspective, has contributed a 2-part guest post on Yards Per Carry Leaders. Bob is the owner and founder of GOATbacks.com, which looks at the greatest running backs of all time. Thanks to Bob for yesterday’s and today’s articles!


Yesterday, I looked at the YPC leaders for the 46 seasons since the merger was completed, 1970-2015 at the 100/120/180-carry cutoffs. Today, a look at the YPC leaders since 1970 at three higher thresholds. [continue reading…]

{ 16 comments }

Bob Ford, a longtime fan of Pro-Football-Reference and Football Perspective, has contributed a 2-part guest post on Yards Per Carry Leaders. Bob is the owner and founder of GOATbacks.com, which looks at the greatest running backs of all time. Thanks to Bob for today’s (and tomorrow’s) article!


I’ve been curious about YPC leaders over the years, particularly as they’re sorted through increasing numbers of carries. Over the next two days, I will look at the YPC leaders using six different carry minimum thresholds: 100, 120, and 150 today, and 180, 220, and 280 carries tomorrow. These cutoffs weren’t arrived at in an analytically rigorous way, just through instinct and personal judgment. I ran a number of different carry thresholds and simply tried to keep my statistical eyes peeled; in my view, these are at least 6 of the minimums where interesting changes seemed to emerge.

As a general rule, though not an absolute one, I’m in the camp that regards YPC as, at best, a questionable stat when it comes to assessing skill and performance, and at worst a misleading and even bunkum stat, to borrow a term from Chase and the crew over at Intentional Rounding. Don’t get me wrong, I’m not suggesting YPC is useless. In fact in some narrow contexts I think it’s even key. But I think it’s woefully overused and over relied on, and I do regard it with suspicion when it comes to assessing rushing and running back value and effectiveness, particularly in “real-game” situations. I think the same holds for mobile quarterbacks, too.

I decided to look at YPC leaders for the 46 seasons since the merger was completed, 1970-2015. Again, no special reason, just to make things more manageable. This would probably get really interesting if we included all pre-merger seasons, but I didn’t do that here. If anyone does, kudos. At any rate, here are the YPC leaders since 1970, sorted at 6 different carry thresholds. [continue reading…]

{ 1 comment }
Next Posts Previous Posts