≡ Menu

Denver has scored at a historic rate

Denver has scored at a historic rate.

Today’s insane statistic comes courtesy of RJ Bell: the difference between Denver and the #2 team in points per game is larger than the difference between the #2 and #31 teams. The Broncos are averaging 39.8 points per game this season, 11.6 points more than the (surprisingly second-ranked) Bears. And Chicago is averaging just 9.9 more points per game than the Jets, the #31 ranked scoring team.

That is, well, crazy. The record for points per game in a season is 38.8, set by the 1950 Rams. The 2007 Patriots are second at 36.8, and both of those teams scored slightly more points through ten games than the 2013 Broncos. So while Denver is on pace to break the scoring record, some regression to the mean over the final six games should be expected.

If the Broncos want to set the record for most points scored relative to the second highest scoring team in the league, Peyton Manning and company have some work to do. That mark is held by the ’41 Bears, who averaged 36.0 points per game, 12.5 more than the Packers that year. Second and third on that list are the ’07 Patriots (8.4) and ’50 Rams (8.3), so Denver has a realistic shot of setting the modern record.

I’ll be honest: as dominant as the Broncos offense has been, I’m a little surprised to see them so far ahead of the competition in points scored. After all, consider:

  • The Eagles have just 19 fewer yards than the Broncos, and Nick Foles actually leads Manning in both passer rating and Adjusted Net Yards per Attempt;
  • In PFR’s Expected Points Added, the Broncos offense is at 14.7 EPA-added per game, while the Saints offense is at 11.3. That’s a relatively small difference considering the fact that Denver has scored 12.1 more points per game than New Orleans.
  • The Chargers have a higher completion percentage than the Broncos and six fewer turnovers, but have averaged 17 fewer points per game.
  • The Packers are actually a hair ahead of Denver in yards per play (6.3531 to 6.3529), but have scored two fewer touchdowns per game.

So what’s going on? I’m perfectly fine with Denver being general run-of-the-mill dominant, but the team’s points scored numbers makes it seem like the Broncos might be the greatest offensive machine ever. I think I’ve identified the two reasons to explain the gap:

Red Zone success

Philadelphia has scored a touchdown just 46% of the time the Eagles made it into the red zone, which ranks 28th in the league. San Diego isn’t much better at 50% (22nd). The Saints are at 52.5% (20th), and the Packers are down at 30th at 43%. So some excellent offenses are really struggling in the red zone, which gives them disproportionately low points per game averages. Oh, and Denver? They’re at 79.1%, by far the highest rate in the league. It’s not unusual for a great offense to dominate in the red zone — the ’07 Pats were at 70% — but what is unusual is seeing the other top offenses struggle there.

I have red zone data going back to 1997, and the highest ever performance was set by Kansas City in 2003. The Trent GreenPriest HolmesTony Gonzalez Chiefs scored a touchdown on 77.8% of all red zone opportunities (42 out of 54), so the Broncos (34 out of 43) could break that record this year. More likely, though, is that the Broncos go from otherworldly in the red zone to just great, which would drop the team’s points per game average.

Number of Drives

The Broncos are averaging 2.85 points per drive, while the Saints are #2 at 2.46. That’s not a huge difference — the gap between #2 and #7 is slightly bigger. The difference, as you can deduce, is that the Broncos are averaging 13 drives per game while the Saints are at just 11.3 drives per game. Why is that? New Orleans’ average drive takes 2:56 minutes, the third-longest in the league (and San Diego is #1 at 3:13), while the Broncos are in the bottom five at 2:17 (the Eagles are last at 2:02). That Chip Kelly edge is erased, though, because Philadelphia’s opponents average 2:48 per drive, the third highest rate in the league. Denver’s opponents take just 2:18 per drive, the third lowest (just a second ahead of Detroit and eight seconds longer than Kansas City).

The Broncos defense is not great, but it does rank 6th in completion percentage allowed. Combine that with the fact that Denver ranks 4th in percentage of opponent plays that are passes, and incomplete passes occur on 25% of all plays run by Broncos opponents, the second-highest rate in the league behind Kansas City. That’s not surprising for a team with such a high Game Script, but it does stop the clock from running for long stretches, which gives Denver’s offense more possessions The Chargers are 28th in this statistic (18%), which is one reason why San Diego is dead last in offensive drives (10.2 per game).

But there’s another reason why Broncos’ opponents tend to have short drives: Denver leads the league in 20+ yard plays allowed at 54. As a result, teams don’t end up with many clock-chewing drives against Denver: opponents tend to gain big yards quickly or throw incomplete passes. That increases the number of drives for the Broncos, which (one could argue) inflates the success of the team’s offense. It’s all relative, of course — Denver is still #1 in points per drive by a wide margin — but it’s worth recognizing that Denver has scored 75% more points per game than an average of the other 31 teams, but “just” 62% more on a per-drive basis. That accounts for about 3 points per game. Add in the insane success in the red zone, and the lack of success there by the other top teams, and you have the reasons for the crazy stat at the top of today’s post.

Manning Record Watch Update

After six games, I analyzed how likely Manning was to break the single-season touchdown record. At the time, he had 22 touchdowns, and the formula projected him to throw 2.99 TDs/G the rest of the way to finish with 52 touchdowns, narrowly breaking Tom Brady’s record.

Now? Manning has 34 touchdowns, as his pace has only slightly declined. What does that mean? To calculate Manning’s odds using Bayes Theorem we need to know four things:

1) His Bayesian prior mean (i.e., his historical average): 2.38, as this number wouldn’t change from the original post.

2) His Bayesian prior variance (the variance surrounding his historical average): Again, no change here, so we use 0.0986.

3) His observed mean: Instead of 3.667, we will use 3.4.

4) His observed variance: This one involves just a little bit of work. What I suggested we do last time is calculate the number of passing touchdowns per game Manning averaged in the first six (now ten) games of each season since 2000, along with his average over the rest of the season (then, 8-10 games, now, 4-6 games). Then we take the difference of the variances of each column, as we did in step two.

YearTD/G Thru 10ROY GTD/G ROYDiff
20002.1620.1
20011.861.330.47
20021.961.330.57
20031.961.670.23
20043.552.80.7
20052420
2006261.830.17
20071.653-1.4
20081.751.8-0.1
20092.143-0.9
2010262.17-0.17
20122.462.170.23
Variance0.220.31

Manning’s variance over the rest of the season is 0.3052 TDs/G, while his variance through ten games is 0.2214; the differential there is 0.0838, which is the variance of our current mean.

Once you have your number for these four variables, then you substitute those numbers into this equation:

Result_mean = [(prior_mean/prior_variance)+(observed_mean/observed_variance)]/[(1/prior_variance)+(1/observed_variance)]

Or, using our numbers:

[(2.38 /0.0986) + (3.4 / 0.0838)] / [(1/0.0986) + (1/0.0838)]

which becomes

[24.14 + 40.57] / (22.08) = 2.93

This picture will never get old

This picture will never get old.

After averaging 3.667 TDs/G over 6 games, we projected Manning to average 2.99 TDs/G the rest of the year. Since he averaged “only” 3 touchdowns per game over his next four games, we downgrade him from 2.99 to 2.93. Of course, we already had a significant regression factored into his future projection — we dropped him by 0.67 TDs/game from his average, which is the point of using Bayes Theorem. So while he’s at “only” 3.4 TDs/G on the season after 10 games, since he’s played at that level for longer, he only loses about half a touchdown per game over his projection the rest of the way.

That gives Manning 17-18 touchdowns, which puts him at a season-ending projection of 51-52 touchdowns. He’s still more likely than not to break the record, although obviously this analysis ignores lots of elements like strength of schedule. And with a visit to Kansas City and a game against the Titans (who have allowed a league-low 7 touchdowns through the air), perhaps he’s actually an underdog to even tie Brady at 50.

{ 3 comments }

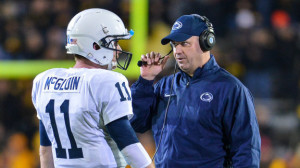
O'Brien teaches McGloin how to throw a football

O'Brien teaches McGloin how to throw a football.

Two weeks ago, Jeff Tuel became the Buffalo starting quarterback after Thaddeus Lewis (who was replacing an injured EJ Manuel) couldn’t play against the Chiefs due a ribs injury. Today, former Penn State quarterback Matt McGloin will start for the Raiders, as Terrelle Pryor will miss the game against the Texans due to an injured knee.

This is a mind-boggling development for fans of college football. McGloin was a walk-on at Penn State who co-starred with four-star recruit Rob Bolden in one of the least-competent quarterback battles in recent memory. In 2010 and 2011, the duo seemingly alternated every other week, which was about how long it took for one of them to lose the job. Among the 90 quarterbacks who threw for at least 3,000 yards over that two-year period, McGloin ranked 87th in completion percentage. Then, Bill O’Brien arrived, and McGloin turned into a real quarterback, and led the Big 10 in both passing yards and passing touchdowns.

McGloin joins Tuel, Max Hall, and Matt Moore as the only undrafted free agent rookies to start a game at quarterback in the last ten years. The table below is a bit overinclusive: it includes all undrafted quarterbacks who started a game during the first season in which they played a game. That’s not quite the same thing as starting as a rookie, of course, but it’s the best I can do. Brock Berlin, for example, went undrafted in 2005, so he wouldn’t count, but he appears on the list below. To help you filter through the “sat around for a few years but didn’t get into a game/played in another league” issue, I’ve included an age column.
[continue reading…]

{ 2 comments }

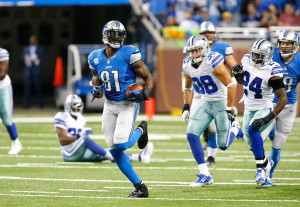
Calvin Johnson And Getting Tackled At the One

Johnson was tackled twice at the 1 against Dallas

Johnson was tackled twice at the 1 against Dallas.

In the last two years, Calvin Johnson has been tackled at the one yard line an incredible seven times. Ronnie Brown is the only other player to record such a dubious feat even four such times since 2012, and Eric Decker, Roddy White, and Tony Gonzalez are the only other players to get tackled on three different receptions just shy of the goal line.

Johnson has the most receptions in the league over that time frame, but Wes Welker is only one catch behind him… and he has just one reception where he was tackled at the one-yard line. Of course, that’s only for data over the last year and a half.

Since 1999, 25 players have had at least seven receptions where they were tackled at the one-yard line. As it turns out, Brian Finneran fantasy owners have been the most unlucky, as Finneran was tackled seven times at the 1-yard line on 238 career receptions.
[continue reading…]

{ 2 comments }

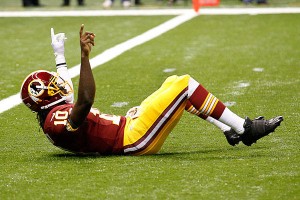
RG3 led a game-winning drive in week 7

RG3 led a game-winning drive in week 7.

After a week six in which no team won with a negative Game Script, only the Jets won with a negative Game Script in week seven, and that was in overtime. Only two quarterbacks led fourth-quarter comebacks this week: Robert Griffin III and Thaddeus Lewis. Three more quarterbacks — Andy Dalton, Ben Roethlisberger, and Geno Smith — led game-winning drives in tie games, but in general, it was a pretty uneventful week for comebacks. Overall, it’s been a quit few weeks in the NFL when it comes to fourth quarter craziness: the largest deficit entering the 4th quarter by a winning team in weeks 5, 6, and 7 was just five points.

Just like last week, Alex Smith and the Chiefs pulled out a late win in a game with a near-even Game Script. None of the 13 other games this week (excluding Jets/Patriots, Chiefs/Texans, and noting that the Saints and Raiders had byes) had a Game Script of fewer than 2 points.
[continue reading…]

{ 6 comments }

The Legion of Boom Has Long-Term Effects

The Legion of Boom Has Long-Term Effects.

In week 1, the Seahawks beat the Panthers. In week two, the Panthers lost to the Bills.

In week 2, Seattle crushed San Francisco. In week three, the 49ers lost to Indianapolis.

In week 3, the Seahawks suffocated the Jaguars; in week four, Jacksonville lost to the Colts.

In week 4, Seattle won at Houston; in week five, Houston was embarrassed by the 49ers.

In week 5, the Seahawks played a tight game with Andrew Luck’s Colts, but lost 34-28. In week six, Indianapolis was upset in San Diego.

In week 6, Seattle defeated the Titans; in week seven, Tennessee lost against San Francisco.

As a result, NFL teams are 0-6 this year in games played the week after facing Seattle. Surely this is because of the physical style employed by the Seahawks, and not a quirky stat aided by the fact that four of those games came against the 49ers and Colts. Carolina nearly ended this streak before it began, but was too bruised up to prevent EJ Manuel from finding Steve Johnson alone in the end zone with six seconds left, giving the Bills a 24-23 win. And while at first glance, the Colts loss in San Diego is your classic let-down/look-ahead sandwich (after beating Seattle in week 5 and getting ready for the Peyton Manning return in week 7), the truth is, Indianapolis was just incapable of mustering the physical temerity necessary to beat the rugged Chargers.

Seattle beat the Cardinals in week seven, but the circumstances ensure that this streak will continue to be discussed. If Arizona loses to Atlanta in week eight, that would run the record to 0-7; if the Cardinals win, well, they had an extra three days of rest, so teams would still be winless in games on normal rest after playing the punishing Seahawks.

The “record” for worst record by teams after playing Team X the prior week is 1-13, with the ’97 Packers being Team X. The lone win came when the Vikings, after losing in Green Bay in week four, rebounded to overcome Ty Detmer and the Eagles in week five. You might think there’s something legitimate here — after all, the Packers had Brett Favre, Reggie White, and were the defending Super Bowl champions. Perhaps teams were so “up” to play Green Bay that they were very prone to let downs the following weeks. I’m not convinced.
[continue reading…]

{ 7 comments }

(I originally posted this at the S-R Blog, but I thought it would be very appropriate here as well.)

Just a quick hit of a post to let you know that tonight’s MNF matchup between the 0-6 Giants and the 1-4 Vikings is, in fact, the worst ever this late in the season by combined winning percentage:

game_idhomeWLTPFPAroadWLTPFPAyear_idweek_numgame_datecomb_wpctcomb_pt_diffwinner
201310210nygnyg060103209min1401251582013710/21/2013.091-12.6NULL
197512150sdgsdg1110148282nyj39022137819751312/15/1975.167-12.1sdg, 24-16
199411210otioti190147218nyg37017122019941211/21/1994.200-6.0nyg, 13-10
197211060nwenwe25092220clt160941451972811/6/1972.214-12.8clt, 24-17
197011020pitpit2407194cin150931561970711/2/1970.250-7.2pit, 21-10
198110190detdet240118126chi150891331981710/19/1981.250-4.3det, 48-17
199710200cltclt06088155buf3301221591997810/20/1997.250-8.7buf, 9-6
201211260phiphi370162252car28018424320121211/26/2012.250-7.5car, 30-22
200001030atlatl4110251351sfo41102664191999171/3/2000.267-8.4atl, 34-29
200512190ravrav490171253gnb310025525520051512/19/2005.269-3.2rav, 48-3
198310240crdcrd250137218nyg2501261561983810/24/1983.286-7.9tie (20-20)
201112120seasea570216246ram210014029620111412/12/2011.292-7.8sea, 30-13
201011290crdcrd370188292sfo37016021920101211/29/2010.300-8.2sfo, 27-6
200911160clecle17078209rav44020615420091011/16/2009.313-4.9rav, 16-0
198011240nornor0110181341ram74029422819801211/24/1980.318-4.3ram, 27-7
201112050jaxjax380138200sdg47024927520111312/5/2011.318-4.0sdg, 38-14
198312120tamtam2120212345gnb77039640719831512/12/1983.321-5.1gnb, 12-9
198711020daldal330135134nyg150991421987711/2/1987.333-3.5dal, 33-24
199910250pitpit33011793atl150741531999710/25/1999.333-4.6pit, 13-9
200211180ramram450194196chi27018223220021111/18/2002.333-2.9ram, 21-16
200511210gnbgnb270201184min45015422820051111/21/2005.333-3.2min, 20-17
200012040nwenwe390192253kan57028327420001412/4/2000.333-2.2nwe, 30-24
200412130otioti480231294kan48034132620041412/13/2004.333-2.0kan, 49-38
200712100atlatl390171272nor57026627920071412/10/2007.333-4.8nor, 34-14
199112090miamia760256275cin211021137419911512/9/1991.346-7.0mia, 37-13
197311260sfosfo370180232gnb35213819819731111/26/1973.350-5.6sfo, 20-6
197811130cincin190110184rai64019316419781111/13/1978.350-2.3rai, 34-21
200711260pitpit730269145mia010018327420071211/26/2007.350+1.7pit, 3-0
199311290cltclt370154233sdg46016419519931311/29/1993.350-5.5sdg, 31-0
198010270nyjnyj160114164mia430991441980810/27/1980.357-6.8nyj, 17-14
199710270miamia520143124chi0701011991997910/27/1997.357-5.6chi, 36-33
199811020phiphi16079162dal4301741151998911/2/1998.357-1.7dal, 34-0
201211050nornor250190216phi3401201552012911/5/2012.357-4.4nor, 28-13
198311070detdet450202188nyg26116621419831011/7/1983.361-1.9det, 15-9
199111250ramram380181256sfo56021815519911311/25/1991.364-0.5sfo, 33-10
199211300seasea110073218den74017520719921311/30/1992.364-8.0sea, 16-13
200812010htxhtx470252293jax47022424020081312/1/2008.364-2.6htx, 30-17
197111150sdgsdg350150179crd3501351491971911/15/1971.375-2.7sdg, 20-17
197910290atlatl350160181sea3501721811979910/29/1979.375-1.9sea, 31-28
200611130carcar440137163tam26010217320061011/13/2006.375-6.1car, 24-10
200711120seasea440167141sfo26010418620071011/12/2007.375-3.5sea, 24-0
201211120pitpit530191164kan17013324020121011/12/2012.375-5.0pit, 16-13
199010290pitpit340109128ram2401641731990810/29/1990.385-2.2pit, 41-10
201212170otioti490271386nyj67024530620121512/17/2012.385-6.8oti, 14-10
197012070otioti371177249cle56023623619701212/7/1970.386-3.3cle, 21-10
197711210waswas540126132gnb2708315219771011/21/1977.389-4.2was, 10-9
200311170sfosfo450202152pit36017621720031111/17/2003.389+0.5sfo, 30-14
201011220sdgsdg450239197den36020325220101111/22/2010.389-0.4sdg, 35-14
199410170denden140108146kan32090801994710/17/1994.400-2.8kan, 31-28
199911290sfosfo370163281gnb55019220919991211/29/1999.400-6.8gnb, 20-3

It is not, however, the worst by combined PPG margin. That honor belongs to this 1972 game between the 2-5 Patriots and the 1-6 Colts (Baltimore ended up winning 24-17):

game_idhomeWLTPFPAroadWLTPFPAyear_idweek_numgame_datecomb_wpctcomb_pt_diffwinner
197211060nwenwe25092220clt160941451972811/6/1972.214-12.8clt, 24-17
201310210nygnyg060103209min1401251582013710/21/2013.091-12.6NULL
197512150sdgsdg1110148282nyj39022137819751312/15/1975.167-12.1sdg, 24-16
199710200cltclt06088155buf3301221591997810/20/1997.250-8.7buf, 9-6
200001030atlatl4110251351sfo41102664191999171/3/2000.267-8.4atl, 34-29
201011290crdcrd370188292sfo37016021920101211/29/2010.300-8.2sfo, 27-6
199211300seasea110073218den74017520719921311/30/1992.364-8.0sea, 16-13
198310240crdcrd250137218nyg2501261561983810/24/1983.286-7.9tie (20-20)
201112120seasea570216246ram210014029620111412/12/2011.292-7.8sea, 30-13
201211260phiphi370162252car28018424320121211/26/2012.250-7.5car, 30-22
197011020pitpit2407194cin150931561970711/2/1970.250-7.2pit, 21-10
199112090miamia760256275cin211021137419911512/9/1991.346-7.0mia, 37-13
198010270nyjnyj160114164mia430991441980810/27/1980.357-6.8nyj, 17-14
201212170otioti490271386nyj67024530620121512/17/2012.385-6.8oti, 14-10
199911290sfosfo370163281gnb55019220919991211/29/1999.400-6.8gnb, 20-3
197910150nyjnyj240128174min3301071421979710/15/1979.417-6.8nyj, 14-7
200611130carcar440137163tam26010217320061011/13/2006.375-6.1car, 24-10
199411210otioti190147218nyg37017122019941211/21/1994.200-6.0nyg, 13-10
200611060seasea430149177rai250921482006911/6/2006.429-6.0sea, 16-0
199710270miamia520143124chi0701011991997910/27/1997.357-5.6chi, 36-33
197311260sfosfo370180232gnb35213819819731111/26/1973.350-5.6sfo, 20-6
199311290cltclt370154233sdg46016419519931311/29/1993.350-5.5sdg, 31-0
198312120tamtam2120212345gnb77039640719831512/12/1983.321-5.1gnb, 12-9
201211120pitpit530191164kan17013324020121011/12/2012.375-5.0pit, 16-13
200911160clecle17078209rav44020615420091011/16/2009.313-4.9rav, 16-0
200712100atlatl390171272nor57026627920071412/10/2007.333-4.8nor, 34-14
199910250pitpit33011793atl150741531999710/25/1999.333-4.6pit, 13-9
201211050nornor250190216phi3401201552012911/5/2012.357-4.4nor, 28-13
198110190detdet240118126chi150891331981710/19/1981.250-4.3det, 48-17
198011240nornor0110181341ram74029422819801211/24/1980.318-4.3ram, 27-7
197711210waswas540126132gnb2708315219771011/21/1977.389-4.2was, 10-9
199510230nwenwe15069160buf510136951995810/23/1995.500-4.2nwe, 27-14
200611270seasea640203219gnb46018525220061211/27/2006.500-4.2sea, 34-24
201112050jaxjax380138200sdg47024927520111312/5/2011.318-4.0sdg, 38-14
200412060seasea650239223dal47019328920041312/6/2004.455-3.6dal, 43-39
198711020daldal330135134nyg150991421987711/2/1987.333-3.5dal, 33-24
200711120seasea440167141sfo26010418620071011/12/2007.375-3.5sea, 24-0
199010220clecle24098139cin4201541531990710/22/1990.500-3.3cin, 34-13
201110310kankan330105150sdg4201411362011810/31/2011.583-3.3kan, 23-20
197811060cltclt360120230was72018613519781011/6/1978.556-3.3clt, 21-17
200711190denden450153238oti63017815220071111/19/2007.556-3.3den, 34-20
197012070otioti371177249cle56023623619701212/7/1970.386-3.3cle, 21-10
200511210gnbgnb270201184min45015422820051111/21/2005.333-3.2min, 20-17
200512190ravrav490171253gnb310025525520051512/19/2005.269-3.2rav, 48-3
200512120atlatl750277237nor39018329520051412/12/2005.417-3.0atl, 36-17
200211180ramram450194196chi27018223220021111/18/2002.333-2.9ram, 21-16
199410170denden140108146kan32090801994710/17/1994.400-2.8kan, 31-28
197211130sdgsdg251152203cle5301411341972911/13/1972.469-2.8cle, 21-17
197710310crdcrd330124122nyg330911261977710/31/1977.500-2.8crd, 28-0
200512260nyjnyj3110189298nwe95032228920051612/26/2005.429-2.7nwe, 31-21
{ 9 comments }

On Tuesday, I look at the quarterbacks who have thrown the most pick sixes. As a follow-up, I wondered: what’s the record for pick sixes by a defensive player against a quarterback? Rod Woodson is the career leader in interception return scores with twelve, but only two of those came against the same quarerback (Steve McNair, thirteen years apart). As it turns out, there have been at least three defensive players who have scored interception returns against the same quarterback.


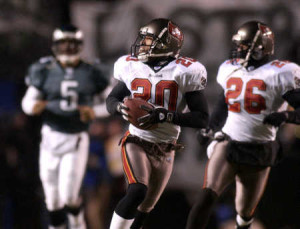
The first of three pick sixes.

The first of three pick sixes.

1) Ronde Barber vs. Donovan McNabb

Perhaps the most famous play of Barber’s career was his 92-yard pick six to clinch the 2002 NFC Championship Game in Philadelphia. The Eagles, trailing by 10, had driven down to the Tampa Bay 10-yard line with just under four minutes left in the game.  But Barber fooled McNabb into an easy interception, and raced down the right sideline for the game-clinching score. That was the second turnover of the day for Barber, who forced a McNabb fumble on a sack in the third quarter.

In 2006, Barber took back two McNabb passes for touchdowns in a defensive battle in Tampa Bay. The first pick six produced the only points in the first half, while the second gave the Bucs a 17-0 lead. But McNabb responded with three touchdowns, with the final one coming on a 52-yard reception by Brian Westbrook with less than a minute remaining. That gave the Eagles a 21-20 lead, which would have held…. except Matt Bryant hit a 62-yard field goal as time expired to give Tampa Bay the win. Philadelphia won the total yards battle 506-196, marking just the fourth time a team gained over 500 yards, allowed fewer than 200 yards, and still lost.

2) Bobby Bell vs. Charley Johnson
[continue reading…]

{ 2 comments }

Jets, Falcons pull off rare feat

Is a left-arm-only Geno better than Sanchez?

Next on First Take: Is a left arm only Geno better than Sanchez?

Under Mark Sanchez, the Jets were never very good at completing passes, because of, well, Mark Sanchez. The Jets ranked 29th, 30th, 24th, and 30th from 2009 to 2012 in completion percentage. Over that four year period, no team completed fewer passes (1,080) or had a lower completion percentage (55.2%) than the Jets. But as bad as the Jets offense has been at completing passes, the defense was even more extreme at preventing completions. Over the last four full years, the top two single seasons in completion percentage allowed were recorded by the ’09 and ’10 Jets. The 2011 Jets ranked 4th in completion percentage allowed, while last year’s team ranked second. From 2009 to 2012, no team allowed fewer completions (1,069) or at a lower rate (52.6%) than the Jets. In fact, the 2nd best team at completion percentage allowed over that period, the Packers at 56.9%, were closer to the 18th best team in opponent’s completion percentage than they were to the Jets.

If you average the completion percentages of the Jets and their opponents over that four year period, you get an average completion percentage in Jets games of 53.8%, easily the lowest rate in the league (Arizona, Kansas City, and Oakland are next at 57.6, 57.7, and 57.7%).

Under Geno Smith and without Darrelle Revis, things hadn’t changed much.  Through four weeks, the Jets defense ranked — you guessed it, 1st in completion percentage allowed at 51.4%, while the Jets offense ranked 26th in completion percentage.

Switching gears for a second, only three games in NFL history had ever seen both teams complete 80% of their passes in a single game. What were the odds, then, that the 2013 Jets would be involved in the fourth such game? I have no idea, but I know they were really, really, really low. Yet on Monday Night against the Falcons, that’s exactly what happened.
[continue reading…]

{ 6 comments }
Preseason Superstar

Preseason Superstar.

Without Aaron Hernandez and Rob Gronkowski, we all thought the Patriots desperately needed a tight end. Out of thin air appeared Zach Sudfeld, a Gronkowski clone in the eyes of…. those who wanted to see Gronkowski. After getting praised by just about every football writer in August, Sudfeld disappointed with the Patriots once the games began to count. Last week, the Patriots defeated the Falcons in Atlanta, and Sudfeld made a key play in the game…. by failing to field an onside kick. In four games, Sudfeld did not record a catch, and was released by the Patriots on Thursday. On Friday, he had been claimed by the New York Jets, who play on Monday Night Football this week against the Falcons. If he plays, it will be Sudfeld’s second consecutive prime time game in Atlanta.

By my count [1]There is a very good chance that my count is low; the PFR database does not contain every game for a player, just every game where a player recorded a statistic. So if any offensive lineman pulled … Continue reading, there are only four five players since 1960 who played for different teams, against the same team, in consecutive weeks of a season.

[Update: As was pointed out to me by RaiderJoe_FO, in 2006, Hank Poteat played against the Dolphins in consecutive weeks for the Patriots and the Jets, in the middle of the Belichick/Mangini cold war.]

Before Poteat, the most recent was kicker Tony Zendejas (we previously chronicled the Zendejas family here). In week 7 of the 1995 season, Zendejas kicked for the Falcons against the Rams; in week 8, he was back in St. Louis kicking for the 49ers.

The most famous trade in NFL history has an under-reported side story: after picking up 89 yards from scrimmage for the Cowboys in Lambeau Field in week 5 of the 1989 season, Herschel Walker played the Packers a week later as a member of the Vikings. This time, he rushed for 148 yards on 18 carries, proving that trades should never be judged after one week.

Theotis Brown was a star at UCLA in the 1970s, but the fullback fell out of favor with the Cardinals in 1981. After struggling as a blocker for Ottis Anderson, Brown lost a fumble in a game against the Giants in week six. St. Louis traded him to Seattle just before the trade deadline, which allowed Brown to also face New York in week seven.

The final instance occurred in 1971, and it involves former wide receiver Eric Crabtree.  Crabtree was a solid player in the AFL for Denver and Cincinnati — he gained 2,172 receiving yards and caught 17 touchdowns in the final three seasons of the league — but was washed up by age 27. After struggling through the start of the 1970 season, Paul Brown waived him after a loss in Houston.  A week later, Crabtree would host the Oilers as a member of the Patriots. He recorded just one catch in each game, and ’71 was his final season in the league. Crabtree’s post-football career is a sadly familiar story about the dangers of concussions.

References

References
1 There is a very good chance that my count is low; the PFR database does not contain every game for a player, just every game where a player recorded a statistic. So if any offensive lineman pulled off this trick, they almost certainly wouldn’t be captured here.
{ 2 comments }

Quarterback Alumni

Yep.

Yep.

In week four, Tom Brady, Matt Cassel, and Brian Hoyer started at quarterback, and all three exited Sunday with a victory.  Cassel and Hoyer are former Patriots quarterbacks, which got me to thinking about quarterback alumni. It isn’t that unusual for there to be three starting quarterbacks who all have ties to one team: over the past few years, Matt Ryan has been joined by former Falcons Matt Schaub and Michael Vick as starting quarterbacks in many weeks.  And at various times over the past few seasons (and in week five), Bengals fans have seen Andy Dalton, Carson Palmer, and Ryan Fitzpatrick as starters.

Which made me wonder: what is the record for most starting quarterbacks in a single week who all once played for the same franchise? As it turns out, the answer is six. In week 6 of the 2007 season, the following men who once donned a Dolphins jersey started at quarterback: Brian Griese in Chicago, Damon Huard for the Chiefs, Gus Frerotte for the Rams, Daunte Culpepper for the Raiders, Joey Harrington for the Falcons, and yes, Cleo Lemon for the Dolphins. Think about that: of the thirteen games played that week, nearly half involved a starting quarterback who had previously played for the Dolphins! The group went 1-5, with Huard’s Chiefs providing the sole win.

In the first two weeks of the ’02 season, six different quarterbacks with Washington ties were starters: Shane Matthews in Washington, Frerotte in Cincinnati, Trent Green in Kansas City, Rodney Peete in Carolina, Rich Gannon in Oakland, and Brad Johnson in Tampa Bay.

In the last few years, the closest any team has come to matching that record was in week 8 of the 2011 season, when A.J. Feeley (St. Louis), Drew Brees, Philip Rivers, and Charlie Whitehurst (Seattle) — all men who had worn Chargers jerseys — were starters. That week, Feeley’s Rams pulled off one of the biggest upsets in recent history, defeating Brees’ Saints. Don’t feel bad if you don’t recall Feeley’s days with San Diego: Nick Saban traded him in the middle of the ’05 season, but Feeley simply sat on the bench behind Brees and Rivers.

{ 0 comments }

Brady needs to channel another Tom (Flores) this season

Brady needs to channel another Tom (Flores) this season

As Jason Lisk and I wrote about before the season, Tom Brady and Ben Roethlisberger have become something of the poster children so far this year when it comes to veteran QBs working with inexperienced and otherwise less-than-notable receiving groups. And, lo and behold, each has put up career-low RANY/A marks through 2 games. But how do their receiving corps rank relative to those of other teams so far this year, and how do they stack up historically?

To take a stab at answering these questions, I turned to True Receiving Yards. For each player who debuted in 1950 or later, I computed their Weighted Career True Receiving Yards for every year, as of the previous season, to get a sense of how experienced/accomplished they’d been going into the season in question. Then, I calculated a weighted averaged of those numbers for every receiver on a given team, using TRY during the season in question as the weights. For example, here are the 2013 Patriots receivers:

PlayerAgeDebutTRY% of TmAt-the-time WCTRY
Julian Edelman27200913938%615.7
Danny Amendola2820097220%1541.9
Kenbrell Thompkins2520135615%0.0
Shane Vereen2420114412%110.9
Aaron Dobson2220134312%0.0
Michael Hoomanawanui25201051%278.8
James Develin25201341%0.0
Weighted Average560.7

The way to read that is: Julian Edelman has accounted for 38 percent of the Pats’ TRY so far. Going into the season, he had a career Weighted TRY of 615.7, so he contributes to 38% of the 2013 Pats’ weighted average with his 615.7 previous career weighted TRY; Danny Amendola contributes to 20% of the team weighted average with his 1541.9 previous career weighted TRY; etc. Multiply each guy’s previous weighted career TRYs by the percentage of the team’s 2013 TRY he contributed, and you get a cumulative weighted average of 560.7 — meaning the average TRY of a 2013 Pats receiver has been gained by a guy who had a previous career weighted TRY of 560.7.

Is that a low number? Well, here are the numbers for all of the 2013 team receiving corps (not including Thursday night’s Eagles-Chiefs tilt), inversely sorted by weighted average (asterisks indicate rookies):

[continue reading…]

{ 3 comments }

This guy's 1982 Chargers sure come up a lot when we do lists like these.

This guy's 1982 Chargers sure come up a lot when we do lists like these.

More than a decade ago (on a side note: how is that possible?), Doug wrote a series of player comments highlighting specific topics as they related to the upcoming fantasy football season. I recommend that you read all of them, if for no other reason than the fact you should make it a policy to read everything Doug Drinen ever wrote about football, but today we’re going to focus on the Isaac Bruce comment, which asked/answered the question:

Is this Ram team the biggest fantasy juggernaut of all time?

“This Ram team,” of course, being the 1999, 2000, & 2001 Greatest Show on Turf St. Louis Rams. At the time, Doug determined that those Rams were not, in fact, the best real-life fantasy team ever assembled, by adding up the collective VBD for the entire roster. They ranked tenth since 1970; the top 10 were:

1. 1. 1975 Buffalo Bills – 550 Simpson (281) Ferguson (98) Braxton (83) Chandler (44) Hill (42)

2. 1982 San Diego Chargers – 542 Chandler (190) Fouts (126) Winslow (121) Muncie (92) Brooks (10) Joiner (1)

3. 1994 San Francisco 49ers – 514 Young (208) Rice (140) Watters (98) Jones (67)

4. 1995 Detroit Lions – 478 Mitchell (136) Moore (132) Sanders (121) Perriman (87)

5. 1984 Miami Dolphins – 470 Marino (243) Clayton (145) Duper (76) Nathan (6)

6. 1998 San Francisco 49ers – 467 Young (200) Hearst (137) Owens (81) Rice (46) Stokes (1)

7. 1986 Miami Dolphins – 456 Marino (210) Duper (94) Clayton (76) Hampton (61) Hardy (13)

8. 2000 Minnesota Vikings – 452 Culpepper (170) Moss (123) Smith (87) Carter (70)

9. 1991 Buffalo Bills – 449 Thomas (157) Kelly (143) Reed (80) Lofton (51) McKeller (17)

10. 1999 St. Louis Rams – 435 Faulk (184) Warner (179) Bruce (71)

As an extension of Chase’s recent post on the The Best Skill Position Groups Ever, we thought it might be useful to update Doug’s study in a weekend data-dump post. I modified the methodology a bit — instead of adding up VBD for the entire roster, for each team-season I isolated the team’s leading QB and top 5 non-QBs by fantasy points (using the same point system I employed when ranking the Biggest Fluke Fantasy Seasons Ever). I then added up the total VBD of just those players, to better treat each roster like it was a “real” fantasy team.

Anyway, here are the results. Remember as well that VBD is scaled up to a 16-game season, so as not to short-change dominant fantasy groups from strike-shortened seasons (:cough:1982 Chargers:cough:).
[continue reading…]

{ 1 comment }

Tony Gonzalez is good at not fumbling

Gonzalez has made 13 Pro Bowls.

Gonzalez has made 13 Pro Bowls.

Do you remember Robert Thomas? He was selected by the Rams with the 31st overall pick in the 2002 draft. He started 30 games at linebacker for the team in three years, grabbed a cup of coffee in Green Bay, and then had three forgettable years with the Raiders during the nadir of the Al Davis era.

In week 16 of the 2006 season, the 7-7 Chiefs traveled to Oakland to face the 2-12 Raiders. Kansas City held a 10-6 lead when they took possession with 11:38 left in the second quarter. Trent Green completed a short pass to the right side of the field to Tony Gonzalez, who was tackled by Thomas. In the process, Thomas jarred the ball loose from Gonzalez, and Kansas City’s second-string tight end, Kris Wilson, pounced on the ball and recovered, keeping possession for the Chiefs. Kansas City eventually won 20-9, and clinched the playoffs by winning the following week against Jacksonville. Oakland finished 2-14 and was rewarded with JaMarcus Russell.

Thomas’ fumble wouldn’t even register as a footnote in the game recap, let alone seven years later. But here’s the thing: from the start of the 2000 season until that play began, Gonzalez had caught 547 passes and fumbled zero times. Since that fumble, Gonzalez has caught 526 receptions… and zero fumbles. Thomas’ forced fumble was the only time since 2000 that Gonzalez has ever let the ball hit the ground.

That crazy stat comes courtesy of Bill Barnwell on this podcast. After hearing about it, I decided to see look up career fumble rates. Excluding the postseason, Gonzalez has 6 career fumbles while recording 1242 receptions, 2 rushes, and one pass attempt. That’s a fumble rate of under half-a-percent per touch! That’s the second best rate of any player to enter the league since 1950, minimum 1,000 touches (defined as every time a player touched the ball).

Who is number one? The guy who can’t stop fumbling in the NFL playoffs. Before presenting the list of the players with the top 100 fumble rates, let me get in a quick disclaimer. Fumble rates, in general, are declining. And the fumble rates are dramatically different on returns relative to running plays, which have different fumble rates than quarterbacks on pass plays, which is way higher than the fumble rates on a reception by a receiver. But hey, if you just want a list of fumbles per touch, ignoring context, check out below:
[continue reading…]

{ 4 comments }

Yesterday, I set up a method for ranking the flukiest fantasy football seasons since the NFL-AFL merger, finding players who had elite fantasy seasons that were completely out of step with the rest of their careers. I highlighted fluke years #21-30, so here’s a recap of the rankings thus far:

30. Lorenzo White, 1992
29. Dwight Clark, 1982
28. Willie Parker, 2006
27. Lynn Dickey, 1983
26. Robert Brooks, 1995
25. Ricky Williams, 2002
24. Jamal Lewis, 2003
23. Mark Brunell, 1996
22. Vinny Testaverde, 1996
21. Garrison Hearst, 1998

Now, let’s get to…

The Top Twenty

20. RB Natrone Means, 1994

Best Season
yeargrushrushydrushtdrecrecydrectdVBD
1994163431,35012392350103.0
2nd-Best Season
yeargrushrushydrushtdrecrecydrectdVBD
199714244823915104012.9

Big, bruising Natrone Means burst onto the scene in 1994 as a newly-minted starter for the Chargers’ eventual Super Bowl team, gaining 1,350 yards on the ground with 12 TDs. In the pantheon of massive backs, he was supposed to be the AFC’s answer to the Rams’ Jerome Bettis, but Means was slowed by a groin injury the following year and never really stayed healthy enough to recapture his old form. The best he could do was to post a pair of 800-yard rushing campaigns for the Jaguars & Chargers in 1997 & ’98 before retiring after the ’99 season.

19. WR Braylon Edwards, 2007

Best Season
yeargrecrecydrectdVBD
200716801,28916107.7
2nd-Best Season
yeargrecrecydrectdVBD
20101653904715.4

The 3rd overall pick in the 2005 Draft out of Michigan, Edwards seemingly had a breakout 2007 season catching passes from fellow Pro Bowler Derek Anderson. But both dropped off significantly the next season, and Edwards was sent packing to the Jets in 2009. He did post 904 yards as a legit starting fantasy wideout in 2010, but he has just 380 receiving yards over the past 2 seasons, and it’s not clear he’ll ever live up to those eye-popping 2007 numbers again.
[continue reading…]

{ 6 comments }

I prefer cooking in a Garrison  Hearst replica jersey

I prefer cooking in a Garrison Hearst replica jersey.

There’s nothing like a truly great fluke fantasy season. Because they can help carry you to a league championship (and therefore eternal bragging rights — flags fly forever, after all), a random player who unexpectedly has a great season will often have a special place in the heart of every winning owner. And even if you only use their jerseys as makeshift aprons to cook in, fluke fantasy greats are a part of the fabric of football fandom. That’s why this post is a tribute to the greatest, most bizarre, fluke fantasy seasons of all time (or at least since the 1970 NFL-AFL merger).

First, a bit about the methodology. I’m going to use a very basic fantasy scoring system for the purposes of this post:

  • 1 point for every 20 passing yards
  • 1 point for every 10 rushing or receiving yards
  • 6 points for every rushing or receiving TD
  • 4 points for every passing TD
  • -2 points for every passing INT

I’m also measuring players based on Value Based Drafting (VBD) points rather than raw points. In a nutshell, VBD measures true fantasy value by comparing a player to replacement level, defined here as the number of fantasy points scored by the least valuable starter in your league. For the purposes of this exercise, I’m basing VBD on a 12-team league with a starting lineup of one QB, two RBs, 2.5 WRs, and 1 TE. That means we’re comparing a player at a given position to the #12-ranked QB, the #24 RB, the #30 WR, or the #12 TE in each season. If a player’s VBD is below the replacement threshold at his position, he simply gets a VBD of zero for the year.
[continue reading…]

{ 2 comments }

The one constant in the Cardinals passing game

The one constant in the Cardinals passing game.

When Tom Brady takes the field as the Patriots starting quarterback in week 1, it will be his 12th consecutive appearance as New England’s opening-week starter. That’s the longest streak in the league, with Eli Manning (9 in 2013), Drew Brees (8), Philip Rivers (8), Tony Romo (7), and Matt Schaub (7) being the only other quarterbacks to start for the same team in each week one since 2007.

On the other hand, the Cardinals will be trotting out their fifth different week 1 starter in as many seasons. Arizona fans hope Carson Palmer will be the right man to finally replace Kurt Warner, after Derek Anderson (2010), Kevin Kolb (2011), and John Skelton (2012) failed. If Chad Henne starts the opener for Jacksonville, that will make it four different quarterbacks in four straight years for the Jaguars (following Blaine Gabbert, Luke McCown, and David Garrard). Palmer’s old team, the Raiders, is the only other team with three different starters the last three years (Matt Flynn, Palmer, and Jason Campbell).

The longest streak of consecutive week one starters is a tie between a pair of Class of ’83 teammates. John Elway started in week 1 every season of his sixteen year career, while Dan Marino started every week 1 from 1984 until 1999. Our games started data only goes back to 1960, but I doubt we would find a sorrier pre-1960 streak than the Chicago Bears from 1998 to 2006. Over a nine-year period, Chicago never had the same quarterback start in week 1 in consecutive years. The full list, beginning in ’98: Erik Kramer, Shane Matthews, Cade McNown, Matthews again, Jim Miller, Kordell Stewart, Rex Grossman, Kyle Orton, and Grossman again. The Ravens, from ’97 to ’03, had seven different week-one starters: Vinny Testaverde, Jim Harbaugh, Scott Mitchell, Tony Banks, Elvis Grbac, Chris Redman, and Kyle Boller, and that doesn’t include Trent Dilfer.

Brandon Weeden is bringing some stability to the Browns quarterback position: if by some chance Jason Campbell steals the job in preseason, he would be Cleveland’s seventh week one starting quarterback in seven years (Charlie Frye in 2007, Derek Anderson, Brady Quinn, Jake Delhomme, Colt McCoy, Weeden, and Campbell). The table below shows each team’s week 1 starters in each of the last ten seasons, along with the projected starter in 2013 according to Footballguys.com (with EJ Manuel (Buffalo), Chad Henne (Jacksonville), Nick Foles (Philadelphia) and Mark Sanchez (New York, for the fifth straight year) projected to win the four open camp jobs.)
[continue reading…]

{ 5 comments }

Why did I have to play with Matt  Moore?

Why did I have to play with Matt Moore?

While reading the always excellent Football Outsiders Almanac, I was reminded that Brandon Marshall has had 1,000-yard seasons playing with Jay Cutler, Kyle Orton, Chad Henne, and Matt Moore (and, of course, Cutler again in Chicago). That’s pretty impressive for a player in his twenties, although regular readers know that I’m a big fan of Marshall.

Two other active players have gained 1,000 yards with four different quarterbacks. For the remainder of this post, I’ll be defining a receiver’s “quarterback” as the quarterback on his team each season who threw for the most passing yards. One of them is pretty obvious: the annually great Tony Gonzalez hit the 1,000-yard mark with Elvis Grbac, Trent Green, Damon Huard, and Tyler Thigpen (but not Matt Ryan). The third player might be a bit more difficult to guess:
[continue reading…]

{ 4 comments }

Wes Welker and playing with two HOF QBs

Last summer, I wrote a post on the percentage of each player’s receiver yards that came from each quarterback. Aaron Schatz asked the following trivia question yesterday that made me think of that old post.

Wes Welker will become the fourth player to catch passes from both Tom Brady and Peyton Manning. Can you name the first three?

Click Show for the Answer Show


That got me to thinking about other players who have played with Hall of Fame quarterbacks. There are 23 modern era quarterbacks in the Hall of Fame. Brett Favre, Kurt Warner, Manning, Brady, and Drew Brees are Hall of Famers in spirit, and Aaron Rodgers isn’t far behind those guys. That’s 29: I threw in Ken Anderson to get us to an even 30.

I then checked to see how many players caught touchdown passes from more than one of those players. The most common pairings were from quarterbacks on the same team: Joe Montana and Steve Young (9), Norm Van Brocklin and Bob Waterfield (8), Sonny Jurgensen and Van Brocklin (6), and Favre and Rodgers (6).

But there were some pretty interesting ones on the list, too. Assuming Warner makes the Hall of Fame, Amp Lee will be the only player in NFL history to catch touchdowns from four Hall of Fame quarterbacks (Warner, Montana, Young, and Warren Moon). Currently, Lee is one of five players to catch passes from three quarterbacks in the Hall of Fame:
[continue reading…]

{ 3 comments }

Trivia: NFL Head Coaches

In light of Shattenjager’s great post yesterday about Marion Campbell, I thought we should do some NFL head coach trivia today centered around losing.

Let’s start with a tough one. With 165 losses, which coach has lost the most games in NFL history?

Trivia hint 1 Show


Trivia hint 2 Show


Trivia hint 3 Show


Click 'Show' for the Answer Show

Obviously, there’s something to be said for losing a lot of games. That’s kind of like throwing the most interceptions in NFL history, a mark that Brett Favre holds. Let’s move on to a rate-based trivia question.

Which coach has the worst winning percentage in NFL history, minimum 50 games coached? It’s not Campbell or Joe Bugel, who at 30% are tied for the fourth worst record.

Trivia hint 1 Show


Trivia hint 2 Show


Trivia hint 3 Show


Click 'Show' for the Answer Show

What if we move to current coaches? Which of the 32 active head coaches has the most losses? No hints here:
[continue reading…]

{ 4 comments }

Sid Luckman did it twice. Two Packers quarterbacks, Arnie Herber and Irv Comp, did it with help from Don Hutson. Sammy Baugh did it as a rookie in 1937.

In five out of eleven seasons from 1936 to 1946, the league leader in passing yards also won the NFL championship. Otto Graham led the AAFC in passing yards in ’47, ’48, and ’49, and the Browns won the championship each of their four seasons in the AAFC. But since then, only two quarterbacks have led the league in passing yards in the same season as winning a title. Can you name them?

Click Show for Answer Show

Want to take a look at the list of all 95 players to lead their league in passing and their team’s final results? Click the “Show” button below:

All Passing Leaders Show

Of course, you already knew that passing yards wasn’t strongly correlated with winning. But what about being the league’s most valuable player? This year, the Miami Heat won the NBA title and LeBron James was the MVP (for the second straight year). But in the NFL, it’s much rarer for a player to pull off that feat: Adrian Peterson won MVP, but the Minnesota Vikings weren’t very close to winning the Super Bowl. Can you name the last player to win the MVP and the Super Bowl in the same year?

Click Show for Answer Show


One more bit of trivia. To really be like LeBron, an NFL player would need to win the MVP, the Super Bowl, and the Super Bowl MVP. That’s happened six times in NFL history, but only once by a non-quarterback. Can you name him?

Click Show for Answer Show

{ 3 comments }

Longest Streaks without a 1,000-yard receiver

The last Jaguar to record 1,000 receiving yards in a season.

The last Jaguar to record 1,000 receiving yards in a season.

A couple of weeks ago, I looked at the longest team streaks without a 1,000-yard rusher. Today’s post examines the teams that went the longest stretch without boasting a 1,000-yard receiver. I’m only going to look at things starting in 1978 (with one caveat), however, as 1,000-yard seasons were much rarer before then. The Redskins and Cardinals didn’t even have a 1,000-yard receiver until 1962, when Bobby Mitchell and Sonny Randle hit those marks for Washington and St. Louis, respectively.

The Jaguars and Raiders have each gone seven straight seasons without a 1,000-yard receiver. Jimmy Smith, one of the most underrated receivers in NFL history, was the last Jacksonville player to gain 1,000 receiving yards in a season. Fortunately for Jaguars fans, there’s a good chance the streak ends in 2013. Cecil Shorts missed two full games due to injury and finished with 979 receiving yards during his breakout season last year, and should be even better this year. He also could benefit from Justin Blackmon being out for the first four games of this season. As for Oakland, the last receiver … well, see if you can remember who was the last Raider with 1,000 receiving yards in a season. Answer is at the end of this post.

The table below shows all teams since 1978 to go at least seven straight years without a 1,000-yard receiver. The one caveat from above? I’ll include pre-1978 seasons for any team that also failed to produce a 1,000-yard receiver from ’78 to ’84, too.
[continue reading…]

{ 3 comments }

Longest Streaks without a 1,000-yard rusher

Two weeks ago, I looked at the longest streaks where a team failed to have a player rush for 100 yards. Richie asked me if I could run the numbers on the longest streaks without a 1,000-yard rusher. The longest active streak in the NFL belongs to the Detroit Lions, who have not boasted a 1,000-yard rusher since Kevin Jones rushed for 1,133 yards as a rookie in 2004. Will Reggie Bush or Mikel Leshoure end that streak in 2013? Probably not.

It’s hard to look at these streaks across NFL history. For example, New York entered the NFL in 1925 and no Giant rushed for 1,000 yards until Ron A. Johnson in 1970. The Lions didn’t have a 1,000-yard rushing in their first 41 years, either. But we can look at the longest streaks that starter after the AFL-NFL merger. The modern Lions are the 12th team to go eight straight years without a 1,000 yard rusher over the last 43 years. As the longest streak? Well now we know why Miami drafted three running backs in consecutive rounds in 1996.

TeamFirst YrLast YrYrsStreak Breaker
MIA1979199517Karim Abdul-Jabbar
CLE1986200416Reuben Droughns
GNB1979199416Edgar Bennett
NYG1973198412Joe Morris
MIN1982199110Terry Allen
NOR1990199910Ricky Williams
NYJ1986199510Adrian Murrell
KAN199220009Priest Holmes
RAI198619949Harvey Williams
DET200520128--
DET197219798Billy Sims
NYJ197619838Freeman McNeil
PIT198419918Barry Foster

Insert obligatory Dan Marino comment here.

{ 2 comments }

Twenty quarterbacks started all sixteen games last season:

Mark Sanchez started 15 games for the Jets, but was benched for the week 16 game against the Chargers.  Carson Palmer (ribs/chest) and Brandon Weeden (shoulder) were each injured in week 16, causing them to sit out week 17 (although Weeden probably could have played if the game meant anything.) In addition, Jay Cutler (concussion) and Robert Griffin III (knee) each missed one — but only one — game due to injury. [1]Griffin was on the injury report twice for head injuries but did not miss a start due to concussions.  As for the other seven teams:
[continue reading…]

References

References
1 Griffin was on the injury report twice for head injuries but did not miss a start due to concussions.
{ 2 comments }

Why do you need to run the ball when you have this guy?

Why do you need to run the ball when you have this guy?

The Packers have gone 43 consecutive regular season games without having a 100-yard rusher. Not coincidentally, Green Bay drafted Alabama’s Eddie Lacy and UCLA’s Johnathan Franklin in the draft last weekend, hoping that one of those players can bolster the team’s rushing attack.

Brandon Jackson rushed for 115 yards in an overtime loss against the Redskins on October 10, 2010. How long ago was that? Washington’s quarterback that day was Donovan McNabb. Two months later, Jackson rushed for 99 yards in a loss in Foxboro, and Ryan Grant had 92 rushing yards in a September victory in Chicago in 2011, but no Packer has hit the century mark in a regular season game since October 10th, 2010. (It’s worth noting that James Starks rushed for 123 yards in a playoff victory against the Eagles in the 2010 playoffs, but NFL game streaks routinely exclude postseason performances.)

The table below lists all teams since 1960 to go at least 32 games without a 100-yard rusher. Here’s how the second row of the table reads: The Washington Redskins went 72 games without a 100-yard rusher. The team’s last 100-yard rusher came in a game on December 17, 1961, and the streak finally ended on September 24, 1967. The player to break the streak was Bobby Mitchell, and you can see the boxscore from that game in the final column.
[continue reading…]

{ 3 comments }

Still the king

Still the king.

Yesterday, I looked at the career leaders in 4th quarter (and overtime) game-winning touchdowns from scrimmage. Today I will do the same thing for passing touchdowns.

As a reminder: tracking things like game-winning touchdowns is only interesting in a trivial sort way. I looked at all games, regular and postseason, in all leagues, from 1940 to 2012, and counted all touchdowns scored that put the player’s team ahead for good (with one exception: I did not count touchdowns scored when down by 7 and the team successfully went for two afterwards). The table below shows all players with at least 4 such game-winning touchdown passes. It won’t do much to settle the Brady/Manning debate.
[continue reading…]

{ 2 comments }

Five years ago, Doug wrote an interesting post about game-winning touchdowns. Let’s be clear: tracking things like game-winning touchdowns is only interesting in a trivial sort way, but hey, it’s April.

Football doesn’t have a statistic like “game-winning RBIs” the way baseball does, although my friend Scott Kacsmar has been doing a great job tracking 4th quarter comebacks and game-winning drives for quarterbacks. I was wondering which players have scored the most game-winning touchdowns in the 4th quarter or overtime, and fortunately I have the data to answer that pretty easily. I looked at all games, regular and postseason, in all leagues, from 1940 to 2012, and counted all touchdowns scored that put the player’s team ahead for good (with one exception: I did not count touchdowns scored when down by 7 and the team successfully went for two afterwards).

The table below lists all players with at least five such touchdowns and the teams for which they scored those touchdowns.

[continue reading…]

{ 7 comments }

I took this Sporcle quiz the other day on receivers to gain 1,000 yards with multiple teams. I did fine, I suppose, naming 22 of the 30 receivers. As I was going through the list, I kept looking at the rows for “Buccaneers, Panthers” and “Panthers, Cowboys” and my brain operated in this way:

Steve Smith never played for the Bucs or Cowboys. Neither did Muhsin Muhammad.”
….
Patrick Jeffers had a big year in 1999, but that was it for his career.”
….
“The Panthers have literally never had anyone resembling a competent wide receiver starting across from Smith in as long as I can remember (other than Muhammad).”
….
Wesley Walls didn’t play for Dallas or Tampa Bay. And I can’t think of a single other Panthers receiver from before 2000.”

“Let me try typing in Smith and Muhammad again.”

After the quiz, I checked the Panthers team page on PFR. The top nine receiving seasons were accomplished by either Smith or Muhammad, but there were in fact two other players to hit the 1,000-yard receiving mark for Carolina. Can you name them? If so, you’re a better man on Panthers wide receiver trivia than me.
[continue reading…]

{ 9 comments }

With Anquan Boldin being traded to San Francisco, he’ll have the rare opportunity to win the Super Bowl in consecutive years with different teams. Here’s another bit of trivia: if Boldin makes it back to the Super Bowl, he’ll become just the 11th player to ever make Super Bowls with three different teams. (man, the Anquan Boldin tag at Football Perspective has gotten way more use than I ever expected).

NameTeam/Year(s)Team/Year(s)Team/Year(s)
Rod Woodson1995-pit2000-rav2002-rai
Bill Romanowskisfo-1988; 1989den-1997; 19982002-rai
Matt Millenrai-1980; 19831989-sfo1991-was
Ricky Proehlram-1999; 20012003-car2006-clt
Preston Pearson1968-clt1974-pitdal-1975; 1977; 1978
Harry Swayne1994-sdgden-1997; 19982000-rav
Clark Haggans2005-pit2008-crd2012-sfo
John Parrella1993-buf1994-sdg2002-rai
Joe Jurevicius2000-nyg2002-tam2005-sea
Jeff Rutledge1979-ram1986-nyg1991-was

[continue reading…]

{ 1 comment }

Better than Elway?

Better than Elway?

Today’s title gives a pretty good hint as to what today’s post is about. The table below shows the career Approximate Value for the top 50 players whose last game happened to be a Super Bowl victory. For reference, I’ve also includes things like number of games, Pro Bowls, 1st-team All-Pro selections, and number of seasons starting.

In addition to Lewis, Matt Birk of the Ravens also joins the list, and for the heck of it, I’ve included Anquan Boldin, who has hinted that he might retire. Full disclosure: I defined a player as “retiring after winning the Super Bowl” if his last season came during a year in which he played for the eventual Super Bowl champ. So Wes Chandler, who played for the ’88 49ers but retired in mid-season, is included in this list even though he shouldn’t be. Ditto Michael Dean Perry, who was on the Broncos in 1997 but actually finished the season with the Chiefs. I could filter out all the Chandlers and Perrys of the world, but my time is better spent elsewhere (for that matter, just about every person’s time is better spent elsewhere), and therefore I’ll present the full, overinclusive list instead of spending an extra hour of time fixing it and possibly not presenting it at all.

The table is sorted by the Career AV column; the AV column shows the player’s AV in his final season.
[continue reading…]

{ 11 comments }

Not the answer.

Not the answer.

Kurt Warner will be eligible for the Hall of Fame in 2 years, making him a potential member of the Class of 2015. Warner is an interesting candidate, and while I suspect he does get in on the first ballot, it’s certainly not a given. Warner won more than 8 games just four times in his career, and he had a relatively nondescript six-year stretch from 2002 to 2007.

But I suspect Warner makes it on his first try because he was a two-time AP MVP choice, he appeared in three Super Bowls, revived two franchises, and he used to bag groceries. Few have a story as incredible as Warner’s, and sportswriters seem to love the guy, so I don’t expect there to be too many hurdles. If he doesn’t get in on the first ballot, he’ll certainly get in eventually.

And that would be a pretty rare feat. Can you name the last quarterback to be selected to the Hall of Fame who was not as a first-ballot choice?

Trivia hint 1 Show


Trivia hint 3 Show


Click 'Show' for the Answer Show

{ 10 comments }
Next Posts Previous Posts