≡ Menu

Super Bowl 51 Odds: Top 6 Teams Or The Field?

Fun article over at SB Nation on national championship odds in college football for this season. The question the folks were trying to answer was what is the smallest number of teams you could group together to give you a 50/50 (or better) shot of containing the eventual champion?  As it turns out, most people thought “taking the top five or six teams presents close to a fair wagering opportunity.”

What about in the NFL? Well, despite the presence of nearly 100 fewer teams, the answer is about the same.  The Patriots, Packers, Panthers, Steelers, Seahawks, and Cardinals form the upper crust of the NFL, at least according to Vegas odds.  Together, that group has about a 50% chance of containing the Super Bowl 51 champion.

Take a look at the odds from Football Locks, which is pretty similar to the odds at other places.  Here’s how to read the table below: The Patriots have 15/2 odds, which translates to 1 out of 8.5, or 11.8%. That includes a vig, tho, and if we remove the vig from each team, that drops the Patriots odds to 9.9%, which is a better approximation of New England’s real odds. I then sorted the teams in the NFL by that number, and calculated the cumulative Super Bowl percentage — after six teams, it’s pretty close to a 50/50 proposition. [continue reading…]

{ 5 comments }
Coaches of two of the top 3 teams in college football... again.

Coaches of two of the top 3 teams in college football… again.

Meet the new boss, Nick Saban as always.

The Golden Nugget released the point spreads for 100 games this season, and Johnny Detroit was kind enough to pass along that data for purposes of this post.  With only data for 100 games, how am I able to conclude that Vegas views Alabama as the best team (or, at least, one of the top 2 teams)  in college football? Consider:

  • Alabama is a 6-point road favorite at Ole Miss this year. That is the only game this year (of the seven we have lines for) where Mississippi is an underdog, and the Rebels are an 8-point home favorite against Auburn and a 4.5-point home favorite against Georgia.  The Rebels finished 10th in the polls last year and are projected to be the 10th-best team this year, so this line says all you need to know about Alabama.
  • Against Auburn, Alabama is a 15-point home favorite (that’s a touchdown better than Ole Miss is against Auburn).   The Tigers were not great last year, but are still projected at #20 this year.
  • In Arkansas, the Crimson Tide are 8.5-point favorites.  In the other 3 home games for Arkansas, the Razorbacks are 7.5-point dogs to LSU (the #3 team by this methodology), 1-point underdogs to Mississippi, and a 2.5-point favorite against Florida.
  • Alabama is a 15-point favorite at home against Mississippi State and a 14-point home favorite against Texas A&M.  Both of those teams are projected to be, by Vegas, top 30 teams this year.
  • In Tennessee, Alabama is a 1-point dog, but the Vols are projected as the 6th best team this year! Tennessee is a pick’em in Georgia, a 5-point favorite in College Station, an 11-point favorite at home against Florida, and a 13-point favorite in a neutral site game against Virginia Tech.
  • LSU is projected to be the 3rd best team in college football. The Tigers are an 11-point favorite at home against MSU, a 9.5-point home favorite against Ole Miss, 7.5-point road favorites in Florida and Arkansas, a touchdown favorite in Auburn, a 6-point favorite in College Station, and – only – a 2.5-point home favorite against Alabama.

You may be wondering, how do we know how good Alabama’s opponents are? Well, we can imply the ratings of each team in college football based on these points spreads.  I explained how to do this last year, but here is the refresher:

The system is pretty simple: I took the point spread for each game and turned it into a margin of victory, after assigning 3 points to the road team in each game. Do this for every game, iterate the results hundreds of times ala the Simple Rating System, and you end up with a set of power ratings.

Two quick notes about the rankings.

1) These are not intended to be surprise. The methodology may be somewhat complicated, but all these ratings are intended to do is quantify public perception.

2) These are not “my” ratings. These are simply the implied ratings based on the Vegas (or, more specifically, the Golden Nugget) points spreads; nothing more, nothing less.

Below are the ratings for 51 college football teams. In the table below, I’ve included the number of games for which we have point spreads for each team on the far left. The “MOV” column shows the home field-adjusted average margin of victory for that team, the “SOS” column shows the average rating of each team’s opponents (for only the number of games for which we have lines), and the “SRS” column shows the school’s implied SRS rating. As you can see, Alabama is projected to be the strongest team in college football, but Oklahoma is just a hair behind: [continue reading…]

{ 5 comments }

A Look at 2016 Vegas Futures Win Totals

Bovada has released futures wins totals for the 2016 season. Five teams are set at 10.5 wins, but not all teams with X numbers of wins are equal. For example, if you want to bet on the Packers going over 10.5 wins, you need to put down $165 to win $100, which translates to a 62.3% chance of success. If you want to bet against Green Bay, an Under bet of $100 brings back $135, implying a 42.6% chance. Those odds will always add up to over 100% because of the vig of about five percent. Remove that, and these lines have Green Bay pegged at about a 59% chance of going over 10.5 wins. Conversely, Pittsburgh is given a true 50/50 chance at going over 10.5 wins: you have to bet $115 to win $100 on the Steelers either going over or under 10.5 wins.

[continue reading…]

{ 1 comment }

It’s safe to say that no team has exceeded expectations through two weeks quite like the Jets. In week 1, New York was a 3.5-point home favorite against the Browns, but won by 21 points (a 17.5-point cover). In week 2, the Jets won 20-7 in Indianapolis, despite being 7-point underdogs (a 20-point cover). The Jets are the only team to cover by 17+ points in each of the first two weeks; in fact, Arizona (+10 against New Orleans, +23 against Chicago) is the only other team to even cover by at least five points in both games so far.

The last team to pull off this feat? The 2007 Patriots. Yes, another day, another Tom Brady/Ryan Fitzpatrick comparison. From 1978 to 2014, there were 19 teams that covered by at least 17 points in each of their first two games. How did those teams do the prior year, and during the rest of that season?

I’ve included the relevant data for each team in the table below. Here’s how to read the line of the ’06 Chargers. San Diego covered by 24 points in week 1, and 21 points in week 2. The Chargers won 9 games in 2005, but the hot start in ’06 was a sign of things to come, as San Diego won 14 games. That was an improvement of 5 wins, although the Chargers season ended in the Division round of the playoffs. [continue reading…]

{ 0 comments }

What Can We Learn About The 49ers Defense From Week 1?

Yesterday, we looked at what Tennessee’s offensive explosion in week 1 might mean for the rest of the year. Today, let’s do the same but for the 49ers defense. The 49ers were 2.5-point underdogs against Minnesota in week one, and the Over/Under in the game was 41.5 points. This translates to a projected a final score of 22-19.5 in favor of Minnesota. As it turns out, San Francisco won the game, 20-3, which means the Vikings were held 19 points below their expected total. That’s the 4th best performance by a team by this methodology since 2002.

The most impressive game? That came in 2003, in the Lawyer Milloy game. The Bills shut out New England, 31-0, while the pre-game spread projected New England to score 21.75 points. That wasn’t a sign that Buffalo was about to break through (the team finished 6-10), but it did provide some insight into a Bills defense that jumped from 27th (in 2002) to 5th (in 2003) in points allowed. [continue reading…]

{ 1 comment }

The Titans were 3-point underdogs against Tampa Bay in week one, and the Over/Under in the game was 41 points.  This translates to a projected a final score of 22-19 in favor of Tampa Bay. Of course, Tennessee scored 42 points, outscoring its projection by a whopping 23 points, tied for the fourth biggest number in all week 1 games since 2002.  In the graph below, I’ve plotted each team’s expected points scored in week 1 on the X-axis, and their actual week 1 score on the Y-axis. [continue reading…]

{ 3 comments }

Implied SRS NFL Ratings For 2015

In each of the last two years, I’ve derived implied SRS ratings for NFL teams based on the Vegas point spreads (I also do the same for college football teams). Well, in late April, CG Technology released lines for 238 NFL games. Things have changed since late April, of course, but for now, let’s work with that data.

For the third straight year, Seattle, Denver, New England, and Green Bay are ranked among the top five teams in the NFL. And before you ask, yes, we will get to the Tom Brady issue in a few moments. The Seahawks are underdogs in just one game this year, and even in that game, Seattle is a just 1-point underdog in Green Bay. The Packers are underdogs in just one game, too: Green Bay is a 1.5-point underdog during a week 8 trip to Denver. On the other side, the Raiders aren’t favored in a game all year: the closest is a pick’em when the Jets come to Oakland.

As a reminder, we can use the Simple Rating System to take all 238 point spreads and derive ratings. But as a sign of how good Vegas viewed Seattle, consider these four Seahawks road lines: [continue reading…]

{ 13 comments }

The Golden Nugget has released point spreads for a large number of college football games.  And these spreads can tell us a lot about how Vegas views these teams.  That’s because, for the most part, the spreads are consistent.

Let’s look at Ohio State, the defending national champions and a team the Golden Nugget released lines for four games. The Buckeyes are 14-point home favorites against Michigan State, 16-point road favorites against Michigan, 19-point home favorites against Penn State, and 16-point road favorites against Virginia Tech. So how good is Ohio State? Well, that depends on how good Michigan State, Michigan, Penn State, and Virginia Tech are. As it turns out, those teams aren’t half bad, so Ohio State must be really, really good. Let’s ignore the games where two of Michigan State, Michigan, and Penn State play each other (since that won’t tell us much about Ohio State), and look at the rest:

  • Michigan State is a 6-point road favorite in Nebraska and a 1-point home favorite against Oregon. This would imply that Ohio State is about 9 points better than the Ducks [1]Michigan State would be viewed as 2 points worse on a neutral field than Oregon, while being 11 points worse than Ohio State on a neutral field., an annual college football contender.
  • The only non-Big 10 game for Penn State where a line was released was Penn State -28 against Army.
  • Michigan is a 33-point home favorite against UNVL, a 4-point road dog against Utah, a 14-point home favorite against Oregon State, and a 7-point home favorite against BYU. The Wolverines aren’t great, but remember that Ohio State is favored by 16 against them in Ann Arbor.
  • Virginia Tech is a 9-point home favorite against Pittsburgh, a 4-point road favorite against virginia, a 9.5-point road dog against Georgia Tech, and a 6-point road dog against Miami. And, remember, a 16-point home dog against Ohio State.

But we don’t need to strain our brains trying to piece together these ratings. As I showed last year and in 2013, we can take the point spreads from each game to determine what Vegas’ implied ratings are for 70 college football teams. [continue reading…]

References

References
1 Michigan State would be viewed as 2 points worse on a neutral field than Oregon, while being 11 points worse than Ohio State on a neutral field.
{ 1 comment }

An Early Look at 2015 Vegas Win Totals

Like last year, CG Technology (formerly Cantor Gaming) is the first Las Vegas book to release win totals. For your convenience, I have produced them below, and sorted the list by the difference between 2015 Vegas wins and 2014 wins. [continue reading…]

{ 3 comments }

The physicist Werner Heisenberg (this guy, not this guy) found that observers affect the systems they attempt to measure, something that is related to but actually separate from his Uncertainty Principle. Even if Heisenberg was thinking about submicroscopic particles whizzing around, his ideas can still apply to writing about NFL betting. Writing about my bets could change the sequence of events that follow, at least in theory, just like all the other actions people take everywhere that put the world on a different course. The NFL season that just unfolded was just one of an infinite number of potential seasons that could have happened. In what share of the possible seasons did my pick for the NFL’s worst team start the season 9-1? Am I just the worst predictor ever, someone dumb enough to underestimate the great Arians and the new great HC of the NYJ? Or was I tempting fate by writing about real bets?

Since I am supposed to be a coldly-rational, data-driven guy, I am going to chance it and review my NFL betting this year. This is risky since my betting year could still be saved by events yet to be determined. Before I get to all that, I am hoping that maybe my writing about football can influence something much more plausible, namely whether I attend the Super Bowl next week. Apologies for this distraction, but I could really use some help.

***HUMBLE REQUEST BEGIN***

If you have read any of my stuff here or on Football Outsiders, you may know that I am a Patriots fan. Sufficiently dedicated to have flown from Los Angeles to Boston for the Ravens game, then back to LA for the first week at Loyola Marymount, before flying back to Boston for the Colts game. Now I am hoping to obtain two tickets to the Super Bowl. Here is what I can offer: [continue reading…]

{ 6 comments }

Records Against the Spread

The Titans lost to the Jaguars last night, dropping Tennessee’s record to a woeful 2-13. The 2014 season started off nicely for the Titans, who upset the Chiefs in Kansas City, 26-10, on opening day. Since then, not only has Tennessee gone just 1-13 (the sole win being a 2-point home victory against Jacksonville), but the team is a mind-bogglingly poor 2-11-1 against the spread.

Points spread data is not official, of course, and some sources of data are better than others. Using what is available at Pro-Football-Reference, I calculated the worst teams against the spread since 1978. If the Titans fail to cover next week against the Colts, they will end the year at 3-12-1 against the spread. That would make them one of just 13 teams since 1978 to post such a poor ATS record. On the other hand, it would only tie them with another AFC South team from the past two years:

The 2007 Ravens went 5-11 overall and 3-13 against the spread, making them the worst team in recent history when it comes to covering the point spread. That year marked the end of the Brian Billick, Steve McNair, and Kyle Boller eras in Baltimore. And while first-year head coach Ken Whisenhunt is probably safe, Titans fans can rest easy knowing that the Jake Locker era is almost certainly over. As for Zach Mettenberger and Charlie Whitehurst? The door may be about to close on them as well. After losing to the Jets and Jaguars, Tennessee looks to be in great shape once the music stops to land Marcus Mariota or Jameis Winston.

{ 5 comments }

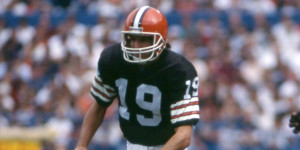
There's been a long drought in Cleveland

There’s been a long drought in Cleveland

October 27, 1991. The 4-3 Browns were hosting the 3-4 Steelers, and Vegas oddsmakers set the Browns as 1.5-point favorites. Bernie Kosar would complete 21 of 29 passes for 179 yards and a score, while Kevin Mack would lead the team with 54 yards rushing on 19 carries. It was not a great offensive day for the Browns, but the team managed to pick off Neil O’Donnell two times, and held Merrill Hoge to just 48 yards on 12 carries (the factor back chipped in with 56 receiving yards, too). Clay Matthews — the middle one — had one sack, Louis Lipps led all players with 69 receiving yards, and the only thing that would trick you into thinking that this game didn’t take place generations ago was that Matt Stover started the scoring with a 34-yard field goal. [continue reading…]

{ 8 comments }

In the third quarter on Monday night, I texted my Patriots fan buddy Matt, “Is it possible that we suck? Maybe the run is finally over.” Bill Barnwell mused on this, and Aaron Schatz also wrote about it. It was hard not to think that, given the way the Patriots were manhandled by a mediocre team playing without several key players. It looked every bit as bad as the 41-14 score and maybe worse.

I remember the last time I wondered if the Pats were done. In a 34-14 loss to the Browns in 2010, the Patriots looked pretty impotent. In that game, as in the Chiefs one, the Pats had just under 300 yards of offense. Peyton Hillis ran over the Patriots. Of course, that wasn’t the end. Maybe this time is different, though. If anything the Chiefs game was even worse, so it’s possible this time really is the end. [1]And those Pats were 6-1 at the time of the loss to the Browns.

Will the Patriots offense be good later this year? To provide a little insight into this, I went back and looked at performance trends for quarterbacks who have had long careers. The first table looks at quarterbacks since 1969 who have the biggest single-season drops in adjusted net yards per attempt (ANY/A) from the previous five year trend. I look just at quarterbacks with at least 100 attempts in a season and I weight by the number of attempts when calculating the average ANY/A over the previous five years.

[continue reading…]

References

References
1 And those Pats were 6-1 at the time of the loss to the Browns.
{ 20 comments }

I am getting some well-deserved crap from people about just how bad my predictions have been so far. The Arizona Cardinals have already somehow outperformed the number of wins I gave them. The Jacksonville Jaguars, my pick to win the AFC South at 8-8, at one point in the game against the Colts had been outscored 112-13 over a stretch of about nine quarters. And my pick to win the NFC North at 14-2 could be 0-3 if Marty Mornhinweg let his head coach call the timeouts. [1]We are talking about the Jets here so they probably would have blown that game, anyway.

But I did win my first Stone-Cold Mega-Lock of the Week with my very comfortable tease of the Bengals and Falcons. So things are looking up and I’m taking that as license to check out some historical betting data for anything that might seem appealing after three weeks.

Last year’s Carolina Panthers are the inspiration for the analysis here. After three weeks, they were a 1-2 team with a big positive point differential. The Panthers last year lost 12-7 to Seattle and 24-23 to Buffalo before annihilating the Giants 38-0. Despite VOA liking the Panthers even after just three games, the betting market came around later in at least one way. The Panthers were at 3/1 to make the playoffs last year after three weeks, even though Football Outsiders had their playoff odds at over 50% at that time.

Is it possible that teams like the 2013 Panthers have historically been undervalued? It seems likely that Carolina was a little undervalued last year after three weeks. By looking at point spread data, we can see if teams that have likely been better than their records have been good bets in the early part of the season. Specifically, I’m going to look at whether betting on early-season underachievers (teams with deceptively poor records) or against overachievers has been profitable now and in the past.

Data and Methods

Feel free to skip this part, but here’s the background for those interested. I have put together Pro Football Reference’s point spread data for all games from 1979 to 2012. This sample is good enough for the tests of long-term and recent betting strategies that I want to do.

I’m going to look at betting outcomes in games 4-8 for teams that are either losing teams (winning percentage below 0.5) with strong Pythagorean records or winning teams with weak Pythagorean records. I will keep things simple and define Pythagorean wins here as:

Pythagorean Wins = (Previous Points Scored ^2.53)/(Previous Points Scored^2.53 + Previous Points Allowed^2.53)

In a continuing effort to avoid unnecessary complications, I’m just going to split the data up over time, looking separately at results before and after 2000.

Betting On and Against Pythagorean Outliers

Below is how you would have done over time if you bet on or against two kinds of teams:

  • Overachievers: Teams with winning records with bad point differentials for their records
  • Underachievers: Teams with losing records with good point differentials for their records

An overachiever is more specifically a team with a winning record that has a Pythagorean winning percentage at least 25 percentage points worse than their actual winning percentage. An underachiever has a Pythagorean winning percentage at least 25 percentage points better than actual.

The results show that, before 2000, you would have won most of the time betting on overachieving teams, teams that were not as good as their records would suggest. I was surprised by that and it even made me wonder if I made a coding mistake. I certainly expected that any tendency away from an even split would have been in favor of betting against teams with good records and relatively poor point differentials. Note that the even split occurred in the past for the underachievers, the teams with good point differentials and poor records.

More recently, the data come pretty close to an even split for betting both on the overachievers and the underachievers. Betting on the overachievers and the underachievers has been successful about 52% of the time since 1999.

So the overall message is that there is little value now or in the past in identifying Pythagorean outliers and either riding the teams with deceptively poor records or fading the teams with misleadingly good ones. In fact, the only pattern from the past suggested it was a good idea to ride the teams with misleadingly good records. I tried to check this out a bit to just see if it was just betting on teams with good records that was profitable, but betting on all teams with winning percentages over .750 has gone almost exactly dead even over time. It would be great to hear any thoughts you might have in the comments for this pattern. I feel like I’m missing something.

Overall, the message here is the one that we get most of the time if we try to find patterns that might lead to a consistently profitable and simple betting strategy. It just ain’t there. That doesn’t make this a bad post, though: as Chase once noted, an answer of “not useful” is often just as meaningful as any other answers.

The Stone-Cold (I Think There May Be a 60% Chance This Bet Will Win) Mega-Lock of the Week

So I am now 33% on my Stone-Cold Mega Locks of the Week. If I get the next two, I will be at 60%. If I get the next two after that, I’ll be at 71%. I kind of think I should be able to claim extra points already, Chris Berman-style, for my tease last week, since the Falcons and Bengals won by a combined 89-21 score that wasn’t that close. But I will instead put my faith in the always reliable larger sample size that will bear out these predictions living up to their title. [2]Note that no mega-lock promises were made on the season predictions.

Two-team teaser: Pittsburgh down to -1.5 and Indianapolis down to -1.5

This week, I like another two-team teaser of two home teams, this time down to 1.5 points. I particularly like the Steelers down to 1.5 points. I do not understand how they could be the same offense for quarters 3-8 of this season as they were for the other high-efficiency ones. Still, I like the Steelers (#10 in DVOA) at home against the Buccaneers (#32).

I’m a little less sure about the other side of the tease, where I have Indianapolis (#21) over Tennessee (#25). In fact, I mainly just wanted to get the Pittsburgh end of the tease. I may be getting that queasy-knees feeling come Sunday. It’s hard to feel that way about Andrew Luck, but I didn’t imagine I’d ever be going into the water tethered to a Ryan Grigson-led team.

Season record: 1-2

References

References
1 We are talking about the Jets here so they probably would have blown that game, anyway.
2 Note that no mega-lock promises were made on the season predictions.
{ 7 comments }

Betting Bad: Thinking About Uncertainty in Prediction

Barack Obama was not the only winner in the 2012 presidential election. Nate Silver, now founder and editor in chief of Five Thirty Eight, and other stats-y election forecasters basked in the praise that came when the returns matched their predictions.

But part of the praise was overstated. At the very end, Silver’s models essentially called Florida a toss-up, with the probability of an Obama win going just a few tenths of a percentage point above 50%. But because his model gave Obama the slightest of edges in Florida, his forecast in most of the media essentially became a predicted Obama win there. In addition to accurately forecasting the national popular vote, Silver then received credit for predicting all fifty states correctly.

I am all in favor of stats winning, but the flip side of this is the problem. If Obama had not won Florida, Silver’s prediction―which, like that of other forecasters such as Sam Wang of the Princeton Election Consortium, was excellent―would have been no less good. [1]This is a column about football, but you might want to check out some of the stuff through that link on the differences between Silver and Wang on the upcoming midterm elections. They both know way … Continue reading And if stats folks bask too much in the glow when everything comes up on the side where the probabilities leaned, what happens the next time when people see a 25% event happening and say that it invalidates the model? [2]Of course, maybe Football Outsiders has already run into that with the 2007 Super Bowl prediction. Perhaps sports people are ahead of politics on this stuff.

Lots of people have made this point before — heck, Silver wrote about this in his launch post at the new 538 — but it is really useful to think carefully about the uncertainty in our predictions. Neil has done that with his graphs depicting the distribution of team win totals at 538, and Chase did so in this post last Saturday. Football Outsiders does this in its Almanac every year, with probabilities on different ranges of win totals. [continue reading…]

References

References
1 This is a column about football, but you might want to check out some of the stuff through that link on the differences between Silver and Wang on the upcoming midterm elections. They both know way more than I do, but for the small amount that it is worth, I lean more towards Wang on this one.
2 Of course, maybe Football Outsiders has already run into that with the 2007 Super Bowl prediction. Perhaps sports people are ahead of politics on this stuff.
{ 12 comments }

Prop Joe’s Favorite NFL Prop Bets

I think I’m one of eight billion people who love “The Wire” and “Breaking Bad.” Those are the two best TV shows I’ve seen and it isn’t particularly close. [1]“Seinfeld” is all alone in third with a pretty big gap after that, too. “The Wire” had an amazing volume of unforgettably vivid characters. Below is my list of memorable “Wire” characters. To be a real test of unforgettableness, it’s got to be off the top of my head, so I’m sure I’m going to forget somebody, but here goes and I’ll include the first thought that jumps to mind:

Omar (“man’s gotta have a code”), Bunk (“f***”), McNulty (“f***”), DeAngelo (library), Stringer (mastermind), Avon (winner), Brother Mouzone (bow tie), Cedric (good posture), Garcetti (that’s actually the mayor of LA, I mean the Baltimore mayor), Clay Davis (“sheeeeeet”), Bunny (“New Hamsterdam”), Keisha (car chase scene), Lester (wood carving), Bodie (corner), Prop Joe (large), …

Ah, Prop Joe. Prop Joe was a very large and very reasonable drug kingpin. His name apparently stemmed from saying “I’ve got a proposition for you,” so we could certainly see him getting into prop bets. So, in honor of Prop Joe, I’ll cover some intriguing season prop bets. [2]The actor who played Prop Joe, Robert F. Chew, sadly passed away in January 2013. Most of these bets are only available online, which continues to be a legal gray area. Like Prop Joe, I would never directly touch anything slightly questionable, so I will be referring to bets made by my good friend Rawls. [3]Definitely not this Rawls who is the enemy of all that is good. We’ll start with his favorite prop bet for 2014 and go from there in descending order.

Rawls’s Prop Bet #1: $76 On Any Team To Win at Least 14 Games (Odds: 3/1)

At first glance this bet seems to have a lot of merit. Since the 1987 strike, at least one team won 14 games 15 out of 26 times (57.7%). In the last 15 years, it’s even better, hitting 10 out of 15 times (66.7%). The bet only needs to win 25% of the time to break even, so this looks fantastic.

But Chase brought up a point that Rawls missed: schedule strength. The years without a 14-game winner in the last 15 years include 2012 and 2013. Rawls dismissed that as a blip, but it comes in part from two of the best teams in football playing in the same division. Moreover, the last run of years without a 14-game winner (1993-1997) also happened during a time of NFC dominance, at least until ‘97. The Cowboys played the Packers and Niners every year during that span, for example. This season, the best teams in football may have it even tougher. The Niners and Seahawks have to play each other twice, and each has one of the four hardest schedules in football this year. The Broncos get the NFC West, the Saints have the sixth-hardest schedule, and the Packers have above-average schedule strength. Only the Patriots have an easy schedule amongst the main threats to win 14 games. [continue reading…]

References

References
1 “Seinfeld” is all alone in third with a pretty big gap after that, too.
2 The actor who played Prop Joe, Robert F. Chew, sadly passed away in January 2013.
3 Definitely not this Rawls who is the enemy of all that is good.
{ 8 comments }

Updated: Vegas Futures Wins Totals

Some background links:

Today I want to look at the latest odds from Vegas on NFL futures, this time courtesy of Bovada.  While we often focus on the number of wins a team is projected to have, the payouts associated with each bet are also key sources of information. Consider the Bears and the Panthers, two teams Bovada has pegged at 8.5 wins. You might think Chicago projects as a better team than Carolina this year; as it turns out, so does Bovada.

If you want to bet on Chicago winning more than 8.5 games this year, Bovada is requiring you bet $155 just to win $100 in the event the Bears win nine games. Of course, if you’re brave enough to suggest that the Bears will win eight or fewer games, Bovada would pay you $125 for your $100 bet. While Chicago is at -155(o)/+125(u), the Panthers are at +145(o), -175(u). So if you think the Panthers are overvalued at 8.5 wins, well, you need to bet $175 on the under just to win $100 if Carolina falls short of that number. On the other hand, Bovada would pay you $145 if you want to take the Panthers winning nine or more games.

Based on those numbers, we can conclude that Vegas thinks Chicago has a 58.2% chance of going over 8.5 wins [1]The -155 implies a 60.8% chance of going over 8.5 wins (155/255), while the +125 on the under implies a 55.5% chance of going over 8.5 wins (1 – [100/225]).  The average of 0.555 and 0.608 is … Continue reading, while Carolina has just a 38.6% chance of going over 8.5 wins. [2]An over line of +145 implies a 40.8% chance of going over (100/245), while an under of -175 implies just a 36.4% chance of going over (1 – [175/275] The table below shows the number of projected wins for each team in the NFL this year, along with the lines associated with their over and under bets. The final column shows the implied likelihood (by the over/under lines) of the team going over their win total; that column was used to break ties between teams with the same number of projected wins.

[continue reading…]

References

References
1 The -155 implies a 60.8% chance of going over 8.5 wins (155/255), while the +125 on the under implies a 55.5% chance of going over 8.5 wins (1 – [100/225]).  The average of 0.555 and 0.608 is .582.
2 An over line of +145 implies a 40.8% chance of going over (100/245), while an under of -175 implies just a 36.4% chance of going over (1 – [175/275]
{ 12 comments }

2014 MVP Odds and Historical QB MVP Performance

On July 8th, Bovada released some early MVP odds, so I figured it would be fun to take a few minutes and examine which players seem like the best and worst bets. Bovada listed odds for 40 players. For example, Peyton Manning has odds of “3/1” which implies that he has a 25% chance of winning the MVP (if you bet $10 on Manning, you get your $10 back plus $30 from the casino). The odds for all 40 players sum to about 140%, which means there’s a healthy house cushion built into these odds. And it’s even worse than that, as Bovada did not include a “Field” category, so the 140% doesn’t even include all possibilities. In any event, I divided each player’s implied odds by 140% to get “adjusted” percentages (or vigorish-adjusted odds) of winning the MVP. Take a look: [continue reading…]

{ 20 comments }

Not-Entirely-Awful NFL Futures Bets

In the 1990s, there was a hedge fund called Long Term Capital Management that almost brought down the world economy. LTCM made enormous bets on very arcane things such as the spread between two kinds of bonds. Their whole reason-for-being was that they would find small inefficiencies in prices and borrow like crazy to take advantage of those brief opportunities. Other hedge funds did similar things, but these guys thought that they were smarter than everyone else. And, to some extent, they may have even been right. But they were also a little contradictory. What made this hedge fund interesting was not just that it employed two Noble Prize-winning economists, but two who made their name arguing that markets for financial assets were efficient. If their research was right, the inefficiencies on which they were betting should not have existed in the first place.

Now, these guys are way smarter than me, but you may have noticed that I recently wrote about how the NFL betting market appears to be pretty efficient. If that’s right, there shouldn’t be any chances to make profitable NFL bets. If the prices are right, all I’m doing is paying the commission every time I make a bet. Like the guys at LTCM, however, I think I’m smart enough to find bets that are mispriced and that offer some opportunity to make money. I’m probably overconfident and wrong about that, but it’s too much fun to try. And if I fail, which the LTCM guys spectacularly did when some of their billion dollar bets went wrong, at least the implications will not send shock waves to central bankers in Peru.

Bets I Sort of Liked But Decided Not to Pull the Trigger On

There were a series of bets on season win totals that I liked but decided did not quite make sense in the end. Some of the reasons were hard-headedly analytical and others were more visceral. Most notably, I couldn’t commit actual dollars to betting on Ryan Fitzpatrick, even though I came pretty close. [continue reading…]

{ 11 comments }

A few days ago, I was in Vegas with friends and without a car. So I took the chance to shop NFL futures odds to the extent that I felt it was worth it to walk to a given sportsbook. I decided the 3+ mile walk to the Superbook was not worth the opportunity cost in the 105 degree heat, so I didn’t get their numbers. But I did get numbers from three of the major oddsmakers: William Hill, Cantor Gaming, and MGM. Tomorrow, I’ll talk about some bets that seem potentially attractive. As I described recently, the numbers are pretty good now and don’t leave obvious opportunities for the most part, I think.

Yes, I still did like some bets. I only found one season win total I really wanted to bet on, and it’s not one of the ones I would have bet back in March. I made a few bets at the William Hill sportsbook, just a little hole in the wall at the Hooters’ Casino a little ways off the Strip, which could just as easily have been in Nevada towns forgotten by time like Laughlin or Mesquite as in Las Vegas. Then I made a few bets not too far from the beautiful people at the Cantor book in the Cosmopolitan. I spent way too much time thinking about all this stuff, which might not have been necessary if I only had that time machine and could have bet on the initial lines. But there’s also some cool stuff by looking at the teams’ odds that have changed the most in both directions.

Season Win Totals

Some interesting movements have happened in the numbers that Cantor Gaming released in March. Those changes reflect everything that happened in free agency and the draft, but also maybe some numbers that people would have bet on anyway even if nothing had changed personnel-wise.  Below are the opening numbers along with the numbers I gathered during the last week. The Cantor numbers are mostly from 6/18 because their books that I went to would only give me the numbers one at a time. I gathered about eight of those numbers because I was at least considering them as wagers. For those teams, the most recent line is the one that I posted. The other companies’ books gave me complete printouts of all their season win-total lines.

A note on the odds: Lines like -140 mean that you would wager $140 to win $100. Lines like +130 mean you wager $100 to win $130. The numbers are usually split by 20 on either side, which represents the vig, or Vegas’s commission. For example, Denver being at -115 for the over would usually go with -105 on the under. For bigger odds, the over and under can be split by more. Also, the MGM has a slightly larger vig, with a 30 split between the over and under. [continue reading…]

{ 2 comments }

The Smarter (Sigh) Football Betting Market

Economists (I am one) have historically been trained to believe in the efficiency of markets. The simplest way to think of this is that market prices capture all relevant information. Of course, this is sometimes not quite right, or even close to right. All the mortgage-backed securities that helped bring down our economy were horrendously mispriced, for example, despite lots of people seeing the warning signs. Even then, people betting against those securities provided information about their true value. They were just drowned out for too long by people clamoring to buy that worthless stuff.

The sports betting market, though, is a case that we might actually expect to work better. Unlike mortgage-backed securities, everyone making a wager in Las Vegas is incentivized to get the price right. There’s nobody who’s pushing a bad wager on their clients, for example. [1]These perverse incentives have been going on a long time, too. Check out Michael Lewis’s Liar’s Poker for fascinating stories of investment bankers pushing junk on their clients. Therefore, we might expect efficient markets to mostly work in Vegas and that the odds would converge to the correct number.

Mostly, it seems like that’s what’s going on. Whatever information is not contained in the initial odds may be quickly corrected as people swoop in to take advantage. I’ve experienced this first-hand. Last year, I went to Vegas about a week after the first season win-totals for 2013 came out. I found the numbers online and came up with this list of wagers I was interested in. [continue reading…]

References

References
1 These perverse incentives have been going on a long time, too. Check out Michael Lewis’s Liar’s Poker for fascinating stories of investment bankers pushing junk on their clients.
{ 18 comments }
FSU is a heavy favorite to wind up in the national title game again

FSU is a heavy favorite to wind up in the national title game again.

The Simple Rating System is a set of computer rankings that is focused on only two variables: strength of schedule and margin of victory. I publish weekly college football SRS ratings each season, and you can read more about the SRS there. Last year, I took the Las Vegas point spreads for over 200 college football games to come up with a set of power rankings. By taking every data point, and using Excel to iterate the ratings hundreds of times, I was able to generate a set of implied team ratings.

Well on Friday, the Golden Nugget released the point spreads for 200 games (h/t to RJ Bell). You might not think we can do much with just a couple hundred games, but by using an SRS-style process, those point spreads can help us determine the implied ratings that Las Vegas has assigned to each team.

We don’t have a full slate of games, but we do have at least 1 game for 77 different teams. Theoretically, this is different than using actual game results: one game can be enough to come up with Vegas’ implied rating for the team. Purdue may only have a spread for one game, but that’s enough. Why? Because Purdue is a 21-point underdog at a neutral field (Lucas Oil) against Notre Dame, and we have point spreads for the Fighting Irish in ten other games. Since we can be reasonably confident in Notre Dame’s rating, that makes us able to be pretty confident about Purdue’s rating, too.

The system is pretty simple: I took the point spread for each game and turned it into a marvin of victory, after assigning 3 points to the road team in each game. For example, Alabama is a 6-point home favorite against Auburn. So for that game, we assume Vegas believes the Tide are three points better than the Tigers; if we do this for each of the other 199 games, and then iterate the results hundreds of times, we can come up with a set of power ratings. [continue reading…]

{ 4 comments }

Previewing the World Cup by NFL Divisions

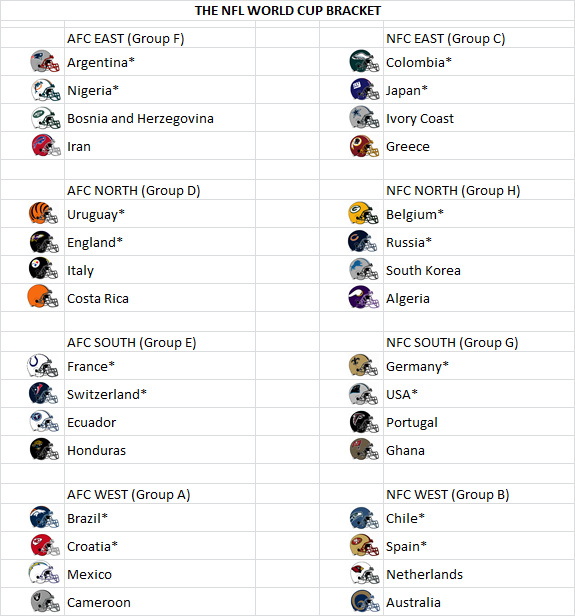
The Super Bowl is a football competition decided by a series of single-elimination playoff games played after 32 teams attempt to qualify from eight groups of four teams each. That’s the World Cup, too!

And just like the NFL, there are some not-so-good AFC South-ish groups and some very good NFC West-like groups. So let’s assign each World Cup group its doppelganger of an NFL division, and then every team to one of the NFL teams in that division.

That gives us our NFL World Cup Bracket. The AFC South is Group E, which contains no great team and at least one candidate to be the Jacksonville Jaguars of the World Cup. The NFC West is Group B, which has three legitimate contenders to win the whole thing, one of which will not even make it out of the group.

Each team is listed in its predicted order of finish within the group according to my highly scientific NFL-based World Cup prediction machine. Teams with a * are predicted to advance out of the group.

NFL WC Bracket [continue reading…]

{ 19 comments }

Vegas Has The Seahawks As the Best Team in 2014

Last year, I derived implied SRS Ratings for each NFL team based on the initial Vegas point spreads. Well, lines have been set for the first 240 games of the year — i.e., every week but week 17 — which means we can re-run the exercise for 2014.

So how do we use point spread data to derive SRS ratings? The point spread in each game provides an implied strength margin (“ISM”) between the two teams: When the Raiders are 10-point home underdogs to Denver, that implies that Denver is 13 points better than Oakland. If we treat each ISM like we would margin of victory, then we can use the SRS to come up with team ratings. For those who need a primer on what the SRS is, you can read about it here; the rest of you can skip to the ratings:

This time last year, the top five teams were…. well, the exact same five teams, albeit in a slightly different order. And the bottom three teams were… Jacksonville, Oakland, and Tennessee, in that exact order. The Broncos have the largest average margin of victory [1]Just to be clear, this analysis includes 3 points for each home team except in the London games, so these are more accurately thought of as location-adjusted expected margins of victory., but because the Seahawks face a tougher schedule, the Seahawks are implied by Vegas to be the strongest team in the NFL at six points better than average.

One interesting way to use the SRS is to see which teams have the hardest schedules. Pre-season strength of schedule is essentially meaningless when based on last year’s record, but the SOS ratings here are based on the implied strengths of each team. In my opinion, you’d be hard-pressed to find a better set of strength of schedule ratings in May than what we see here (other than the fact that they exclude week 17).

The toughest schedule this year belongs to Arizona: add in the oldest roster in the league in 2013, and it’s easy to see why Vegas is so bearish on the Cardinals in 2014. The Seahawks (+0.92) and 49ers (+0.81) have two of the next three toughest schedules (with the Panthers sandwiched between them). The Rams are a few spots down, but remember: this is only the strength of schedule for the first sixteen weeks of the season. St. Louis travels to Seattle in week 17, so the Rams schedule would be just as brutal if we included that game. The Bears having one of the five hardest schedules is a surprise after having such an easy slate in 2013.  It’s true that this analysis ignores that Chicago gets to play Minnesota in week 17, which would ease their schedule strength, but the Bears face the 49ers, Patriots, Saints, and Panthers this year, along with two games against Green Bay. That’s six games against top-7 teams.

Three AFC South teams have the easiest schedules; the Jaguars would probably join the rest of the division if they had two games against Jacksonville. The Texans are set up nicely for a rebound season under Jadeveon Clowney, Bill O’Brien, and, uh, Ryan Fitzpatrick/Case Keenum/Tom Savage. What’s really incredible about Houston’s schedule: not only do the Texans have the easiest schedule through 16 weeks, the Texans host the Jaguars in week 17! Including that game would bring Houston’s schedule down to 1.9 points easier than average.

If you include that game, 8 of the Texans’ 16 games are against teams that are 1.5 points weaker than average. Playing six games against the AFC South, the NFC East and the AFC North, and the Bills and Raiders makes for about as easy a schedule as one could create. Assuming the Texans would be favored in week 17, that means Houston — which went 2-14 last year — is favored in 8 of 16 games and a pick’em in three others (Philadelphia and Cincinnati at home, Tennessee on the road). That’s pretty incredible, and explains why Vegas was so bullish on Houston.

The table below shows each game in the first sixteen weeks of the 2014 season.  Here’s how to read the Seahawks/Raiders line: In week 9, Seattle hosts Oakland. The line is -14.5, which means the Seahawks are 14.5-point favorites. Seattle’s SRS is 6.0 while Oakland has an SRS of -5.8. Therefore, the line predicted by the SRS would be Seattle -14.8 (since the Raiders are 11.8 points worse than the Seahawks and on the road). The difference between the actual line and the SRS line is -0.3 points. By definition, the sum of all the differences between the actual lines and SRS lines must be 0, since the SRS lines were generated from the actual lines. The table below contains 480 rows, showing each game from the perspective of both teams (although the only searchable column is the first team column):

Some thoughts:

  • The biggest outlier games are again in week 1; as Jason Lisk noted when he ran a similar study last year, the lines build in some risk of injury (or simply risk of not knowing what’s going to happen in the future): if Aaron Rodgers or Peyton Manning miss time with an injury, it’s more likely to be later in the season than in week one. Additionally, if Vegas feels more confident in the early games than the late games, that will lead to some games appearing as outliers in week 1.
  • The weirdest line of the season is Tennessee/Kansas City in week 1.  The Chiefs are only 5-point home favorites: that’s 2.1 points lower than we would expect given the location of the game and the ratings of Kansas City (+0.8) and Tennessee (-3.3).
  • As a reminder, here’s a link to the 2014 schedule grid I created; I did not assign 3 points to the home team in the three London games this year.
  • For the second straight year, the Seahawks are underdogs just once: the game in San Francisco. Denver is an underdog when it travels to Seattle and Foxboro, and every other team is a dog in at least three games.
  • Oakland and Jacksonville are underdogs in each of their 15 games. Considering Oakland travels to Denver in week 17, we can safely say the Raiders and Jags are projected underdogs in every game this year.

References

References
1 Just to be clear, this analysis includes 3 points for each home team except in the London games, so these are more accurately thought of as location-adjusted expected margins of victory.
{ 4 comments }
Belichick has an eye on the point spread.

Belichick has an eye on the point spread.

Last week at Five Thirty Eight, Nate Silver noted that San Antonio Spurs head coach Gregg Popovich has produced an excellent record against the spread. He also checked in football’s version of Pop, Bill Belichick, and came to the same conclusion: Belichick hasn’t just been great, but he’s been great against the spread, too.

My database on point spreads goes back to 1978, so I went ahead and calculated the Against-The-Spread record of each head coach over the last 36 seasons. According to my numbers, Belichick has “covered” or won 40 more games against the spread than he’s lost, the most over this period. [1]My numbers differ slightly from Silver’s, although that’s not surprising. There is always some variation in point spread data, which is, of course, not official.  The table below shows the 122 men who  have coached at least 50 games or who were active in 2013.

Here’s how to read Belichick’s line: He has been coaching since 1991 (coaches who began before 1978 are included, but only their post-1977 seasons are counted (and only if they coached 50+ games since 1978)) and was last coaching in 2013. Over that time, he has coached in 332 games, including the post-season. His record against the spread is 182-142-8, which gives him a 0.562 winning percentage (ignoring ties). [2]When calculating regular winning percentage, we treat ties as half-wins and half-losses.  In his article, Silver excluded ties from calculating ATS winning percentages. I don’t know … Continue reading His real record is 218-114-0, which gives him a 0.657 winning percentage (again, including the playoffs). The table is sorted by the last category, which represents the difference beteween his number of wins against the spread and his number of losses against the spread. [continue reading…]

References

References
1 My numbers differ slightly from Silver’s, although that’s not surprising. There is always some variation in point spread data, which is, of course, not official.
2 When calculating regular winning percentage, we treat ties as half-wins and half-losses.  In his article, Silver excluded ties from calculating ATS winning percentages. I don’t know what’s customary, but Silver’s method makes sense: in the event of a “push” all money is simply returns.
{ 14 comments }

Comparing 2014 Vegas Projections to Estimated Wins

Three weeks ago, Vegas released the first set of 2014 win totals for all 32 teams. I immediately wondered how those win totals compare to the estimated wins I created based on 2013 DVOA ratings. I tweeted a request for someone to write such an article, and Warren Sharp (@SharpFootball) was kind enough to oblige. Warren runs SharpFootballAnalysis.com, where he provides handicapping analysis.

One other note before I let Warren take over. If you missed the post on estimating team wins using DVOA, I included this disclaimer:

Even Football Outsiders won’t use these [projections] for more than a starting point — their preseason projections will have the customary tweaks for things like teams getting new quarterbacks, injuries (or the lack thereof) in 2013, rookies, offensive line continuity, etc.

Please keep that note in mind. So when you see “Football Outsiders projects Green Bay to win 7.8 games this year,” that’s just shorthand for “Green Bay’s 2013 offensive, defensive, and special teams ratings, when regressed based on historical data, project a 7.8-win season.” I’m sure with a healthy Aaron Rodgers, Football Outsiders expects more than 7.8 wins in 2013, but the regression formula is ignorant of that fact. And now, I’ll let Warren take over.


On March 7, CG Technology, formerly Cantor Gaming, became the first Las Vegas book to set win totals. For eight teams (25%), the win totals were within one half-game of the estimated DVOA projections: The two sources see eye to eye on Washington, Chicago, Cincinnati, Miami, Detroit, Dallas, Cleveland, and the New York Giants.

For 11 teams (34%), Las Vegas was more enthusiastic than DVOA was, i.e., the books projected higher win totals. The biggest outliers here were Green Bay (10 projected wins by CG vs 7.8 by DVOA) and Houston (8.5 vs 6.5). For Green Bay, we can presume that injuries were the biggest reason for the discrepancy: in addition to Rodgers, Randall Cobb, Clay Matthews, and Casey Hayward all missed significant action. As for the Texans, my guess is that Vegas sees the Colts dropping back two wins from 2013, and the AFC South remains pretty poor.  Houston won 10 games in 2011 and 12 games a year ago, and now faces a pretty easy schedule (the rest of the division, Buffalo, Oakland, the AFC North and NFC East; note that last year, Houston had to face the AFC West, NFC West, New England, and Baltimore.) The Texans were also just 2-9 in games decided by seven or fewer points, a trend that is unlikely to continue.

For the remaining 13 teams (41%), Las Vegas projected fewer wins than DVOA. The two standouts in this category were Arizona (7.0 vs 8.6) and St. Louis (6.5 vs 8.0). As we’ll get to later, CG and Football Outsiders are in considerable disagreement about the fortunes of the NFC West teams.

In some cases, the borderline playoff teams are the most interesting to analyze. There were four teams that DVOA had at sub-.500 that the linemakers have in playoff contention: Green Bay, Houston, Pittsburgh (9.0 vs 7.7) and Baltimore (8.5 vs 7.3). Arizona was the only team in the opposite situation, where Las Vegas projects a losing record despite the DVOA estimates pointing towards a winning record.

The table below shows the numbers for all 32 teams. The Packers had 8.5 wins in 2013, Vegas has set Green Bay’s 2014 wins total at 10.0, and DVOA projects the Packers at 7.8 wins. Therefore, Vegas is 2.2 wins higher on Green Bay than DVOA, Vegas is 1.5 wins higher on Green Bay than the Packers’ 2013 result, and DVOA expects 0.7 fewer wins from Green Bay this year. [continue reading…]

{ 5 comments }

The prevailing view is that Vegas is an example of an efficient market. If there were obvious trends that oddsmakers ignored, it would be easy for people to make money gambling on football, and we know that’s not the case. But I thought it would be interesting to investigate some claims I’ve heard over the years, so I’m introducing the Efficient Vegas tag to Football Perspective.

One theory I’ve heard is that when good teams play bad teams, the smart money is to bet on the bad teams. That’s not because Vegas doesn’t know what it was doing, but that oddsmakers know that fans like to bet on good teams when they play bad ones. But is this true? Here is how I decided to test that question.

From 1990 to 2013, there were 792 games that met the following four criteria: [continue reading…]

{ 26 comments }

Why is the Over/Under So Low In Super Bowl XLVIII?

The Over/Under for Super Bowl XLVIII was just 48 points for most of the last week, although it went up to 48.5 on Thursday and may be at 49 by kickoff. In any event, such a low number should strike Broncos fans as really odd, since the average over/under in the team’s first 18 games was 53.4 points. And the “Over” has hit in 10 of those games!

Seattle, meanwhile, has had an average over/under of 42.8 points. As it turns out, the “Under” has hit in 12 of Seattle’s 18 games this season, including each of the last seven. Readers who are good at arithmetic might have already noticed that the average of 53.4 and 42.8 is 48.1 points.

The graph below shows the Over/Under in each game this season for Denver and Seattle:

[visualizer id=”17753″]
[continue reading…]

{ 1 comment }

Earlier this week, I looked at how likely or unlikely the playoffs were in each of the last 25 seasons. Today, we look at each Super Bowl winner since 1978, and calculate their odds of winning each playoff game, and by extension, how likely (or unlikely) it was that that team wound up winning the Super Bowl.

As you might expect, no team was as unlikely to win the Super Bowl at the start of the playoffs as the 2007 New York Giants. If we know the points spread for a given game, we can derive the team’s probability of winning by using the following formula, assuming the spread (with a negative number for the favorite) is in cell C2 in Excel:

=(1-NORMDIST(0.5,-(C2),13.86,TRUE)) + 0.5*(NORMDIST(0.5,-(C2),13.86,TRUE)-NORMDIST(-0.5,-(C2),13.86,TRUE))

New York was a 3-point underdog in Tampa Bay in the Wildcard round (41.4%), a 7-point dog in Dallas (30.7%), and a 7.5-point underdog in Green Bay in the NFC Championship Game (29.4%). Then, in the Super Bowl against the 18-0 Patriots, the Giants were 12.5-point underdogs, implying an 18.4% chance of victory. The odds of New York winning all four of those games was less than one percent! I don’t think this was a case where the oddsmakers were off, either. Remember that in 2007, Eli Manning led the league in interceptions and the Giants were significantly worse in the regular season than Dallas, Green Bay, or New England. Even in retrospect, the Giants run was remarkable, but even unlikely events are likely to happen given a long enough time period. Of course, it sure seemed like unlikely events were becoming the norm in the playoffs, at least until 2013. [continue reading…]

{ 6 comments }

The 2013 Playoffs Were Not Very Random

In September 2012, Neil wrote that the NFL playoffs had become more random. And that was three months before Joe Flacco turned into Joe Montana. This year, however, feels like one of the least random playoffs in recent memory. And there’s a good reason for that: it is.

If you know the points spread for a game, you can derive the team’s probability of winning in Excel by using the following formula and typing the spread (with a negative number for the favorite) in cell C2:

=(1-NORMDIST(0.5,-(C2),13.86,TRUE)) + 0.5*(NORMDIST(0.5,-(C2),13.86,TRUE)-NORMDIST(-0.5,-(C2),13.86,TRUE))

Using that formula, the table below shows the winner of each game in the 2013 postseason, sorted in order of ascending pregame win probability. [1]All points spread data from Pro-Football-Reference.com. There was only one big upset this year, the Chargers victory in Cincinnati. Conversely, the least surprising outcome was San Diego’s loss in Denver the following week. [continue reading…]

References

References
1 All points spread data from Pro-Football-Reference.com.
{ 12 comments }
Next Posts Previous Posts