
The Chiefs play the Baylor game on an endless loop for the other 31 teams.
There are many differences between college and professional football, but many of the same stats still matter. For quarterbacks, Adjusted Net Yards per Attempt is still the king of the basic stats [1]For the uninitiated, ANY/A is calculated by starting with passing yards per attempt, adding 20 yards for each touchdown and subtracting 45 yards for each interception, and subtracting sack yards lost … Continue reading, and it is arguably even more important in college where teams play at varying different paces.
There’s a small problem, however, if you want to calculate ANY/A at the college level: the NCAA counts sacks as rush attempts and sack yards lost as negative rushing yards. I manually overrode [2]Unfortunately, some estimation was involved. The player game logs at cfbstats do not identify quarterback sacks, but the team game logs do. So for each quarterback, we know how many passes he threw … Continue reading that decision in my data set, so going forward, all rushing and passing data will include sack data in the preferred manner (keep this in mind when you compare the statistics I present to the “official” ones).
But calculating each quarterback’s ANY/A isn’t enough, as the varying strengths of schedule faced by college quarterbacks are too significant to ignore. So using the method described here, I came up with SOS-adjusted ANY/A for each quarterback in each game last year. This method involves an iterative process, so each quarterback’s performance is adjusted for the strength of the opposing defense, which has a rating that is adjusted for the quarterbacks it faced (including the quarterback in question), and so on, until the ratings converge. The usual caveats apply about defenses and quarterbacks that change in ability level over the course of the year.
Top Quarterbacks in 2012
After estimating sack data and adjusting each quarterback for strength of schedule, we now can rate the 2012 quarterbacks. The table below lists the 50 quarterbacks who added the most passing value over average last year. For each quarterback, I’ve listed his basic passing statistics, ANY/A, SOS, and — for reference only — I’ve included their rushing data, too. The table is sorted by the final column which shows the value added over average. How do we come up with that?
I gave each quarterback credit for his value over the average ANY/A (5.82) for all of major college football over the last 8 years. Let’s use Georgia’s Aaron Murray as an example. He averaged 3.88 ANY/A over average against a schedule that was 0.68 ANY/A tougher than average; that means he gets credit for being 4.56 ANY/A over average against a neutral schedule. Since he had 412 dropbacks last year (386 passes, 26 sacks), we multiply 4.56 by 412 to get his value added over average.

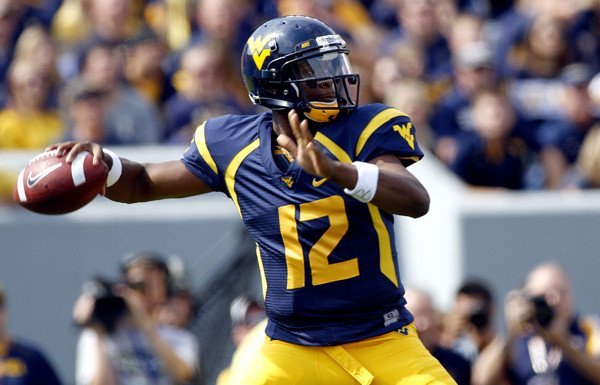
Tyler Bray had an outstanding 2012.
It’s also not hard to see why Geno Smith is expected to be the first quarterback selected in April’s draft. With Murray returning for his senior year, Smith has a good case over everyone else on statistics alone. Matt Barkley is an interesting case: he averaged 8.68 ANY/A against a SOS that was 0.35 ANY/A tougher than average, and added 1,462 yards of value in passing yards in 2011. But Barkley actually increased his NY/A in 2012 compared to 2011. Part of that was due to having a transcendent talent like Marqise Lee have a breakout year last season, but much of Barkley’s “down 2012” is due to the 15 interceptions he threw. The thing to remember is that interceptions are never a great way to judge a young quarterback: if you’re a fan of Barkley’s pro prospects, I think the numbers here tend to put him in a pretty good light. Much of the same can be said for Tyler Wilson, who saw his draft stock decline in 2012 despite him actually averaging more yards per pass last year than he did in 2011. Mike Glennon, who some think may sneak into the first round despite a poor 2012, doesn’t look any better under the advanced stats microscope: he averaged just 6.03 ANY/A against a schedule that was 0.15 ANY/A easier than average.
Perhaps the most interesting name on the table above is Tyler Bray. There are two things that make me very excited about Bray: he’s very young and he’s excellent at avoiding sacks. Bray was a true junior last year, and will be a 21-year-old rookie in the fall. Matthew Stafford and Josh Freeman are the only recent players to start at that age in the NFL (Alex Smith and Drew Bledsoe did, too, and Mike Vick saw some spot duty): it’s extremely rare for a 21-year-old to play quarterback in the NFL. But that’s a great thing for Bray’s outlook, as Sean Forman always reminds me. But Bray’s sack rate is even more impressive, particularly in the SEC. Officially, he was sacked just 8 times on 459 dropbacks, a number that would make Peyton Manning or Drew Brees jealous. There’s a whole lot more to being a good quarterback in the NFL than being a good quarterback in college — Tim Tebow has struggled despite his success at Florida and NFL scouts didn’t just randomly place Glennon well above a player like Colby Cameron — but my guess is Bray is undervalued by draftniks who aren’t giving him credit for his outstanding sack rate at such a young age.
Top Pass Defenses
To create the rankings, we needed to rank both the quarterbacks and the defenses, so producing a list of the top defenses takes no extra work. Remember, a positive SOS in the table below means the defenses faced better-than-average quarterbacks. The table below lists all 124 defenses.
Top Quarterback Games in 2012
To come up with the numbers, we had to perform the iterative analysis on the game level, so let’s now take a look at the best games from last year. Number one on the list probably won’t surprise anyone: it was Geno Smith’s ridiculous game against Baylor, where he threw for 656 yards and 8 touchdowns on 51 passes. The table below lists the best 500 games by a quarterback in 2012. It is sorted by the VALUE column, which gives quarterbacks credit for their value over the average ANY/A (5.82) in the same way as mentioned above. Using Smith’s game as an example, he averaged 15.6 ANY/A against Baylor, but that drops to 15.1 with the SOS adjustment. That means he was 9.3 ANY/A over average for 52 dropbacks (51 passes, one sack), which is why he is listed with 483 yards over average in that game. You can use the search box to search by player or team; for example, Johnny Manziel’s top two passing games were against Arkansas and Alabama.
If we do this for quarterbacks, we can do the opposite for defenses. The best game by a defense last year was LSU against Manziel, because they held Manzeil to only 2.1 ANY/A on 56 passes. Considering the SOS adjustment, and that was the top performance by a pass defense in 2012. [3]In the defense table, you might note the existence of someone called a Pseudo QB. The explanation is a little technical, hence leaving it to the footnotes. To adjusted for strength of schedule, you … Continue reading
References
| ↑1 | For the uninitiated, ANY/A is calculated by starting with passing yards per attempt, adding 20 yards for each touchdown and subtracting 45 yards for each interception, and subtracting sack yards lost from the numerator and adding sacks to the denominator. |
|---|---|
| ↑2 | Unfortunately, some estimation was involved. The player game logs at cfbstats do not identify quarterback sacks, but the team game logs do. So for each quarterback, we know how many passes he threw in the game and how many times his team was sacked. For quarterbacks who threw 100% of their team’s passes in a game, this is easy. However, for quarterbacks who threw fewer than 100% of their team’s passes, they were assigned a pro-rata number of their team’s sacks. |
| ↑3 | In the defense table, you might note the existence of someone called a Pseudo QB. The explanation is a little technical, hence leaving it to the footnotes. To adjusted for strength of schedule, you need each quarterback to play a certain number of teams and throw a certain number of attempts, or else the formula can get out of whack. I set the cut-off at 100 attempts, so quarterbacks that threw fewer than that in a season are all lumped together under the name “Pseudo QB.” |