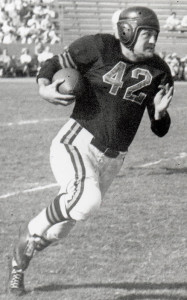
Just above these words, it says “posted by Chase.” And it was literally posted by Chase, but the words below the line belong to Bryan Frye, a longtime reader and commenter who has agreed to write this guest post for us. And I thank him for it. Bryan lives in Yorktown, Virginia, and operates his own great site at http://www.thegridfe.com/, where he focuses on NFL stats and history.
In August, I introduced a concept on my site to better adjust the NFL’s passer rating for the league passing environment. I love Pro Football Reference’s use of the Advanced Passing Index for passer rating (Rate+), but it still bothered me that the internal math of the NFL’s formula remained the same.
The NFL’s official passer rating formula is based on four variables: completion percentage, yards per attempt, touchdown percentage, and interception rate. Each of those variables are then used to determine four different variables, as seen below:
A = (Cmp% – .3) * 5
B = (Y/A – 3) * .25
C = TD% * 20
D = 2.375 – Int% * 25
Passer rating is then calculated as follows, provided that each variable is capped at 2.375 and has a floor of zero:
(A + B + C + D)/(0.06)
For each component, a score of 1 represents the ideal average passer. Because the formula is based on a league average completion rate of 50%, modern passers significantly exceed that; pre-modern passers rarely reached it. Similarly, the NFL’s model is based on a 5.5% interception rate and a 5% touchdown rate. Thanks to a Greg Cook injury (and Bill Walsh’s genius reaction to it), those numbers have also changed significantly. Last year, the league interception and touchdown rates were 2.8% and 4.4%, respectively.
On the other hand, when Sid Luckman set the league on fire in 1943, the NFL as a whole had much higher interception and touchdown rates – 10.1% and 7.0%, to be exact. What this all means is that post-West Coast Offense passers benefit from better completion and interception rates, while pre-AFL passers suffer from inferior stats in those areas. It also means that modern quarterbacks are actually hurt by their significantly lower touchdown rates, whereas the old-school guys get a rating boost from all the scoring they did.To account for that, I came up with a “floating” formula that changes as league averages change. I called it the “Equivalency Rating” because it sort of describes the basic idea of the stat and because I really couldn’t think of a better name for it. Under the floating model, the league average rating for any given year is always 66.67, just as the NFL intended when passer rating was introduced in 1973.
To give an example, I’ll use the floating formula to account for the averages of two disparate seasons: 1950 and 2007.
1950 averages: 46.9% completions, 6.76 YPA, 5.2% TDs, and 7.8% Ints
A = (Cmp% – .269) * 5
B = (Y/A – 2.76) * .25
C = TD% * 19.38
D = 2.375 – Int% * 17.54
Remember, the idea is the league average passer should score a 1 in each category. So for completion percentage, we need a number that, when multiplied by 5, gives us 1. That means the league-average completion percentage will always be 20% higher than the number we will put in that equation. For yards per attempt, you need to subtract 4 from the league-average ratio, and put that number into variable B. For touchdown percentage, we simply need to divide 1 by the league-average rate, and for interception percentage, we need to divide 1.375 by the league-average metric. Here is the formula for the 2007 season:
2007: 61.2% completions, 6.85 YPA, 4.2% TDs, and 3.1% Ints
A = (Cmp% – .412) * 5
B = (Y/A – 2.85) * .25
C = TD% * 23.81
D = 2.375 – Int% * 43.83
I did this for every year since 1932, and came up with the following top 100 Passing Equivalency Ratings. Read the table thus: In 1943, Sid Luckman of the Bears completed 110 of 202 passes for 2194 yards, 28 touchdowns, and 12 interceptions. This comes out to an NFL rating of 107.5 and a PER of 117.5.
Rk | Quarterback | Year | Tm | Cmp | Att | Yds | TD | Int | NFL Rat | PER |
---|---|---|---|---|---|---|---|---|---|---|
1 | Sid Luckman | 1943 | CHI | 110 | 202 | 2194 | 28 | 12 | 107.5 | 117.5 |
2 | Sammy Baugh | 1945 | WAS | 128 | 182 | 1669 | 11 | 4 | 109.9 | 116.4 |
3 | Aaron Rodgers | 2011 | GNB | 343 | 502 | 4643 | 45 | 6 | 122.5 | 113.9 |
4 | Roger Staubach | 1971 | DAL | 126 | 211 | 1882 | 15 | 4 | 104.8 | 110.8 |
5 | Peyton Manning | 2004 | IND | 336 | 497 | 4557 | 49 | 10 | 121.1 | 110.7 |
6 | Nick Foles | 2013 | PHI | 203 | 317 | 2891 | 27 | 2 | 119.2 | 110.6 |
7 | Tom Brady | 2007 | NE | 398 | 578 | 4806 | 50 | 8 | 117.2 | 109.6 |
8 | Milt Plum | 1960 | CLE | 151 | 250 | 2297 | 21 | 5 | 110.4 | 109.4 |
9 | Otto Graham | 1946 | CLE | 95 | 174 | 1834 | 17 | 5 | 112.1 | 109.4 |
10 | Otto Graham | 1953 | CLE | 167 | 258 | 2722 | 11 | 9 | 99.7 | 108.7 |
11 | Joe Montana | 1989 | SF | 271 | 386 | 3521 | 26 | 8 | 112.4 | 108.6 |
12 | Sammy Baugh | 1940 | WAS | 111 | 177 | 1367 | 12 | 10 | 85.6 | 107.9 |
13 | Steve Young | 1994 | SF | 324 | 461 | 3969 | 35 | 10 | 112.8 | 107.7 |
14 | Ken Stabler | 1976 | OAK | 194 | 291 | 2737 | 27 | 17 | 103.4 | 105.7 |
15 | Bart Starr | 1966 | GNB | 156 | 251 | 2257 | 14 | 3 | 105 | 105.4 |
16 | Bert Jones | 1976 | BAC | 207 | 343 | 3104 | 24 | 9 | 102.5 | 105.3 |
17 | Len Dawson | 1962 | DLT | 189 | 310 | 2759 | 29 | 17 | 98.3 | 105.3 |
18 | Len Dawson | 1966 | KC | 159 | 284 | 2527 | 26 | 10 | 101.7 | 105.3 |
19 | Otto Graham | 1947 | CLE | 163 | 269 | 2753 | 25 | 11 | 109.2 | 104.8 |
20 | Kurt Warner | 1999 | STL | 325 | 499 | 4353 | 41 | 13 | 109.2 | 104.7 |
21 | Steve Young | 1992 | SF | 268 | 402 | 3465 | 25 | 7 | 107 | 104.5 |
22 | Len Dawson | 1968 | KC | 131 | 224 | 2109 | 17 | 9 | 98.6 | 104.1 |
23 | Dan Marino | 1984 | MIA | 362 | 564 | 5084 | 48 | 17 | 108.9 | 103.6 |
24 | Peyton Manning | 2013 | DEN | 450 | 659 | 5477 | 55 | 10 | 115.1 | 102.7 |
25 | Tom Brady | 2010 | NE | 324 | 492 | 3900 | 36 | 4 | 111 | 102.6 |
26 | Otto Graham | 1955 | CLE | 98 | 185 | 1721 | 15 | 8 | 94 | 102.5 |
27 | Ken Stabler | 1974 | OAK | 178 | 310 | 2469 | 26 | 12 | 94.9 | 102.3 |
28 | Cecil Isbell | 1942 | GNB | 146 | 268 | 2021 | 24 | 14 | 87 | 101.8 |
29 | Ken Anderson | 1974 | CIN | 213 | 328 | 2667 | 18 | 10 | 95.7 | 100.4 |
30 | Charlie Conerly | 1959 | NYG | 113 | 194 | 1706 | 14 | 4 | 102.7 | 100.3 |
31 | Steve Young | 1997 | SF | 241 | 356 | 3029 | 19 | 6 | 104.7 | 100.2 |
32 | Otto Graham | 1949 | CLE | 161 | 285 | 2785 | 19 | 10 | 97.5 | 100.1 |
33 | Josh McCown | 2013 | CHI | 149 | 224 | 1829 | 13 | 1 | 109 | 99.9 |
34 | Randall Cunningham | 1998 | MIN | 259 | 425 | 3704 | 34 | 10 | 106 | 99.5 |
35 | Daunte Culpepper | 2004 | MIN | 379 | 548 | 4717 | 39 | 11 | 110.9 | 99.4 |
36 | Brian Griese | 2000 | DEN | 216 | 336 | 2688 | 19 | 4 | 102.9 | 99.1 |
37 | Frankie Albert | 1948 | SF | 154 | 264 | 1990 | 29 | 10 | 102.9 | 99 |
38 | Cecil Isbell | 1941 | GNB | 117 | 206 | 1479 | 15 | 11 | 81.4 | 98.9 |
39 | George Blanda | 1961 | HOO | 187 | 362 | 3330 | 36 | 22 | 91.3 | 98.5 |
40 | Y.A. Tittle | 1963 | NYG | 221 | 367 | 3145 | 36 | 14 | 104.8 | 98.2 |
41 | Brett Favre | 2009 | MIN | 363 | 531 | 4202 | 33 | 7 | 107.2 | 98.1 |
42 | Dave Krieg | 1994 | DET | 131 | 212 | 1629 | 14 | 3 | 101.7 | 98.1 |
43 | Roger Staubach | 1973 | DAL | 179 | 286 | 2428 | 23 | 15 | 94.6 | 98.1 |
44 | Drew Brees | 2009 | NOR | 363 | 514 | 4388 | 34 | 11 | 109.6 | 98 |
45 | Drew Brees | 2011 | NOR | 468 | 657 | 5476 | 46 | 14 | 110.6 | 97.5 |
46 | Y.A. Tittle | 1953 | SF | 149 | 259 | 2121 | 20 | 16 | 84.1 | 97.5 |
47 | Joe Montana | 1984 | SF | 279 | 432 | 3630 | 28 | 10 | 102.9 | 97.4 |
48 | Bob Griese | 1971 | MIA | 145 | 263 | 2089 | 19 | 9 | 90.9 | 97.3 |
49 | Tommy Thompson | 1948 | PHI | 141 | 246 | 1965 | 25 | 11 | 98.4 | 97.2 |
50 | Steve Young | 1991 | SF | 180 | 279 | 2517 | 17 | 8 | 101.8 | 97 |
51 | Chad Pennington | 2002 | NYJ | 275 | 399 | 3120 | 22 | 6 | 104.2 | 97 |
52 | Sammy Baugh | 1942 | WAS | 132 | 225 | 1524 | 16 | 11 | 82.5 | 97 |
53 | John Brodie | 1970 | SF | 223 | 378 | 2941 | 24 | 10 | 93.8 | 96.8 |
54 | Babe Parilli | 1962 | BOS | 140 | 253 | 1988 | 18 | 8 | 91.5 | 96.5 |
55 | Trent Green | 2000 | STL | 145 | 240 | 2063 | 16 | 5 | 101.8 | 96.4 |
56 | Aaron Rodgers | 2012 | GNB | 371 | 552 | 4295 | 39 | 8 | 108 | 96.3 |
57 | Vinny Testaverde | 1998 | NYJ | 259 | 421 | 3256 | 29 | 7 | 101.6 | 96.3 |
58 | Ken Anderson | 1981 | CIN | 300 | 479 | 3754 | 29 | 10 | 98.4 | 96.2 |
59 | Bob Griese | 1977 | MIA | 180 | 307 | 2252 | 22 | 13 | 87.8 | 96.1 |
60 | Ken Anderson | 1975 | CIN | 228 | 377 | 3169 | 21 | 11 | 93.9 | 95.9 |
61 | Fran Tarkenton | 1973 | MIN | 169 | 274 | 2113 | 15 | 7 | 93.2 | 95.8 |
62 | Joe Montana | 1987 | SF | 266 | 398 | 3054 | 31 | 13 | 102.1 | 95.8 |
63 | Norm Van Brocklin | 1953 | LARM | 156 | 286 | 2393 | 19 | 14 | 84.1 | 95.7 |
64 | Peyton Manning | 2005 | IND | 305 | 453 | 3747 | 28 | 10 | 104.1 | 95.7 |
65 | Norm Van Brocklin | 1950 | LARM | 127 | 233 | 2061 | 18 | 14 | 85.1 | 95.3 |
66 | Sammy Baugh | 1947 | WAS | 210 | 354 | 2938 | 25 | 15 | 92 | 94 |
67 | Arnie Herber | 1936 | GNB | 77 | 173 | 1239 | 11 | 13 | 58.9 | 93.5 |
68 | Tommy Thompson | 1949 | PHI | 116 | 214 | 1727 | 16 | 11 | 84.4 | 93.4 |
69 | Sid Luckman | 1945 | CHI | 117 | 217 | 1727 | 14 | 10 | 82.5 | 92.7 |
70 | Tobin Rote | 1952 | GNB | 82 | 157 | 1268 | 13 | 8 | 85.6 | 92.4 |
71 | Bob Waterfield | 1951 | LARM | 88 | 176 | 1566 | 13 | 10 | 81.8 | 90.8 |
72 | Sammy Baugh | 1949 | WAS | 145 | 255 | 1903 | 18 | 14 | 81.2 | 90.6 |
73 | Johnny Unitas | 1957 | BAC | 172 | 301 | 2550 | 24 | 17 | 88 | 90.1 |
74 | Norm Van Brocklin | 1951 | LARM | 100 | 194 | 1725 | 13 | 11 | 80.8 | 89.8 |
75 | Johnny Unitas | 1958 | BAC | 136 | 263 | 2007 | 19 | 7 | 90 | 89.7 |
76 | Johnny Unitas | 1959 | BAC | 193 | 367 | 2899 | 32 | 14 | 92 | 89.7 |
77 | Bobby Thomason | 1953 | PHI | 162 | 304 | 2462 | 21 | 20 | 75.8 | 89.2 |
78 | Sammy Baugh | 1943 | WAS | 133 | 239 | 1754 | 23 | 19 | 78 | 89.2 |
79 | Y.A. Tittle | 1948 | BAC | 161 | 289 | 2522 | 16 | 9 | 90.3 | 89 |
80 | Bob Waterfield | 1945 | LARM | 89 | 171 | 1609 | 14 | 17 | 72.4 | 88.9 |
81 | Otto Graham | 1951 | CLE | 147 | 265 | 2205 | 17 | 16 | 79.2 | 88.7 |
82 | Eddie LeBaron | 1957 | WAS | 99 | 167 | 1508 | 11 | 10 | 86.1 | 88.5 |
83 | Ed Brown | 1956 | CHI | 96 | 168 | 1667 | 11 | 12 | 83.1 | 88.4 |
84 | Bobby Thomason | 1955 | PHI | 88 | 171 | 1337 | 10 | 7 | 80 | 87.7 |
85 | Johnny Lujack | 1949 | CHI | 162 | 312 | 2658 | 23 | 22 | 76 | 87.1 |
86 | Frankie Albert | 1949 | SF | 129 | 260 | 1862 | 27 | 16 | 82.2 | 86.7 |
87 | Sid Luckman | 1946 | CHI | 110 | 229 | 1826 | 17 | 16 | 71 | 86.2 |
88 | Milt Plum | 1959 | CLE | 156 | 266 | 1992 | 14 | 8 | 87.2 | 85.3 |
89 | Charlie Conerly | 1948 | NYG | 162 | 299 | 2175 | 22 | 13 | 84 | 84.7 |
90 | Otto Graham | 1948 | CLE | 173 | 333 | 2713 | 25 | 15 | 85.6 | 84.1 |
91 | Adrian Burk | 1954 | PHI | 123 | 231 | 1740 | 23 | 17 | 80.4 | 83.4 |
92 | Bob Waterfield | 1946 | LARM | 127 | 251 | 1747 | 17 | 17 | 67.6 | 82.6 |
93 | Bob Waterfield | 1950 | LARM | 122 | 213 | 1540 | 11 | 13 | 71.7 | 82.4 |
94 | Jim Hardy | 1948 | LARM | 112 | 211 | 1390 | 14 | 7 | 82.1 | 82.3 |
95 | Sammy Baugh | 1948 | WAS | 185 | 315 | 2599 | 22 | 23 | 78.3 | 82.3 |
96 | Tommy Thompson | 1947 | PHI | 106 | 201 | 1680 | 16 | 15 | 76.3 | 82.1 |
97 | Y.A. Tittle | 1957 | SF | 176 | 279 | 2157 | 13 | 15 | 80 | 81.9 |
98 | Norm Van Brocklin | 1952 | LARM | 113 | 205 | 1736 | 14 | 17 | 71.5 | 81.6 |
99 | George Ratterman | 1949 | BUF | 146 | 252 | 1777 | 14 | 13 | 76.8 | 81.4 |
100 | Bobby Thomason | 1951 | GNB | 125 | 221 | 1306 | 11 | 9 | 73.5 | 80.9 |
As you can see, the older fellows look a lot better in proper context. I’ve already talked way too much, so here are a few quick takeaways:
- Bill Walsh was a pretty good coach, mentoring players who make up 10% of this list (not to mention his influence on later passers).
- San Francisco really has had an embarrassment of riches at the quarterback position, as Chase noted in the methodology post of his latest GQBOAT series. Hall of Famers Y.A. Tittle, Joe Montana, and Steve Young account for nine seasons. Frankie Albert and John Brodie add three more.
- Tittle makes the list for three different teams; Bobby Thomason is the only other player to represent more than one team.
- Because this doesn’t incorporate important sack data, Peyton Manning doesn’t look as good as you may have expected.
- Otto Graham and Sammy Baugh lead with seven appearance each. All four of Graham’s AAFC seasons make the cut, to the surprise of no one.
- Steve Young makes the most appearances of any “modern” passer, with four.
- We all know Milt Plum’s 1960 was one for the ages, but his play the prior year was pretty good too.
- Arnie Herber’s magical 1936 season has the biggest gap between NFL passer rating and Equivalency Rating; he rates 34.6 points higher in the latter.
- Drew Brees’ 2011 sees the biggest decline, dropping 13.1 points.
There’s more to come about the Equivalency Rating, including ways to incorporate rushing and total offense/defense numbers. But for today, we’ll stick to the basic methodology: please let us know your thoughts in the comments.