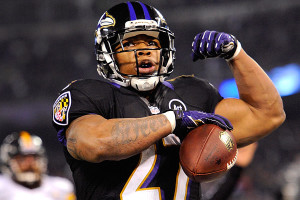
As a disclaimer, I’m in the camp that thinks YPC is an overrated statistic. In 2013, Marshawn Lynch, Eddie Lacy, and Frank Gore all averaged around the league average of 4.17 yards per carry, but that doesn’t make them average backs. So consider much of this post to be a bit of trivia and fun with stats, rather than the best way to identify running back productivity. With that disclaimer out of the way, I calculated each player’s “yards above league average” for each season since 1950, which is the product of a player’s number of carries and the difference between his YPC average and the league average YPC rate.
For example, since Rice averaged 3.08 YPC on 214 carries, he gets credited for being 231 yards below average in 2013. By this measure, Rice was the worst running back in the league. He was worse than his teammate Bernard Pierce (who actually had a lower YPC average but on fewer carries, so he finished 197 yards below average), worse than Willis McGahee (-198) or Rashard Mendenhall (-217), and even worse than Trent Richardson (-220). And this wasn’t your typical worst season in the league, either: his 2013 performance ranks as the 15th worst in this metric since 1950:
Rk | Runner | Year | Age | Tm | Rsh | RshYd | RshTD | YPC | LgAvg | YdsOvAvg |
---|---|---|---|---|---|---|---|---|---|---|
1 | Eddie George | 2001 | 28 | TEN | 315 | 939 | 5 | 2.98 | 4.06 | -339 |
2 | Lamar Smith | 2001 | 31 | MIA | 313 | 968 | 6 | 3.09 | 4.06 | -302 |
3 | Jonathan Wells | 2002 | 23 | HOU | 197 | 529 | 3 | 2.69 | 4.22 | -302 |
4 | Eddie George | 2002 | 29 | TEN | 343 | 1165 | 12 | 3.4 | 4.22 | -281 |
5 | Eddie George | 2003 | 30 | TEN | 312 | 1031 | 5 | 3.3 | 4.16 | -267 |
6 | Ottis Anderson | 1989 | 32 | NYG | 325 | 1023 | 14 | 3.15 | 3.95 | -261 |
7 | Ricky Williams | 2003 | 26 | MIA | 392 | 1372 | 9 | 3.5 | 4.16 | -258 |
8 | Larry Brown | 1973 | 26 | WAS | 273 | 860 | 8 | 3.15 | 4.06 | -249 |
9 | Harold Green | 1993 | 25 | CIN | 215 | 589 | 0 | 2.74 | 3.89 | -247 |
10 | Edgerrin James | 2006 | 28 | ARI | 337 | 1159 | 6 | 3.44 | 4.16 | -242 |
11 | Cedric Benson | 2010 | 28 | CIN | 321 | 1111 | 7 | 3.46 | 4.21 | -240 |
12 | James Jackson | 2001 | 25 | CLE | 195 | 554 | 2 | 2.84 | 4.06 | -237 |
13 | Karim Abdul-Jabbar | 1997 | 23 | MIA | 283 | 892 | 15 | 3.15 | 3.98 | -234 |
14 | Benny Malone | 1979 | 27 | WAS | 176 | 472 | 3 | 2.68 | 4 | -232 |
15 | Ray Rice | 2013 | 26 | BAL | 214 | 660 | 4 | 3.08 | 4.17 | -232 |
16 | Trent Richardson | 2013 | 22 | 2TM | 188 | 563 | 3 | 2.99 | 4.17 | -220 |
17 | Tom Tracy | 1961 | 27 | PIT | 147 | 402 | 2 | 2.73 | 4.22 | -218 |
18 | Rashard Mendenhall | 2013 | 26 | ARI | 217 | 687 | 8 | 3.17 | 4.17 | -217 |
19 | LaDainian Tomlinson | 2009 | 30 | SDG | 223 | 730 | 12 | 3.27 | 4.24 | -216 |
20 | Darren McFadden | 2012 | 25 | OAK | 216 | 707 | 2 | 3.27 | 4.26 | -214 |
21 | Abner Haynes | 1966 | 29 | DEN | 129 | 304 | 2 | 2.36 | 4.01 | -213 |
22 | Jerome Bettis | 2003 | 31 | PIT | 246 | 811 | 7 | 3.3 | 4.16 | -212 |
23 | Rob Carpenter | 1984 | 29 | NYG | 250 | 795 | 7 | 3.18 | 4.02 | -210 |
24 | Lee Bouggess | 1970 | 22 | PHI | 159 | 401 | 2 | 2.52 | 3.83 | -208 |
25 | Chester Taylor | 2010 | 31 | CHI | 112 | 267 | 3 | 2.38 | 4.21 | -205 |
26 | Curtis Enis | 1999 | 23 | CHI | 287 | 916 | 3 | 3.19 | 3.9 | -203 |
27 | Larry Brown | 1974 | 27 | WAS | 163 | 430 | 3 | 2.64 | 3.88 | -202 |
28 | Tim Hightower | 2008 | 22 | ARI | 143 | 399 | 10 | 2.79 | 4.2 | -202 |
29 | Tony Collins | 1986 | 27 | NWE | 156 | 412 | 3 | 2.64 | 3.94 | -202 |
30 | Warrick Dunn | 2007 | 32 | ATL | 227 | 720 | 4 | 3.17 | 4.06 | -202 |
31 | Maurice Smith | 2001 | 25 | ATL | 237 | 760 | 5 | 3.21 | 4.06 | -201 |
32 | Marion Butts | 1994 | 28 | NWE | 243 | 703 | 8 | 2.89 | 3.72 | -201 |
33 | Reggie Cobb | 1993 | 25 | TAM | 221 | 658 | 3 | 2.98 | 3.89 | -201 |
34 | Larry Schreiber | 1975 | 28 | SFO | 134 | 337 | 5 | 2.51 | 4.01 | -201 |
35 | James Stewart | 2000 | 29 | DET | 339 | 1184 | 10 | 3.49 | 4.08 | -200 |
36 | Christian Okoye | 1990 | 29 | KAN | 245 | 805 | 7 | 3.29 | 4.1 | -199 |
37 | Adrian Murrell | 1999 | 29 | ARI | 193 | 553 | 0 | 2.87 | 3.9 | -199 |
38 | James Wilder | 1985 | 27 | TAM | 365 | 1300 | 10 | 3.56 | 4.1 | -198 |
39 | Willis McGahee | 2013 | 32 | CLE | 138 | 377 | 2 | 2.73 | 4.17 | -198 |
40 | Eddie Price | 1953 | 28 | NYG | 101 | 206 | 2 | 2.04 | 4 | -198 |
41 | Bernard Pierce | 2013 | 23 | BAL | 152 | 436 | 2 | 2.87 | 4.17 | -197 |
42 | Dick Hoak | 1963 | 24 | PIT | 216 | 679 | 6 | 3.14 | 4.05 | -196 |
43 | Travis Prentice | 2000 | 24 | CLE | 173 | 512 | 7 | 2.96 | 4.08 | -194 |
44 | Warrick Dunn | 2001 | 26 | TAM | 158 | 447 | 3 | 2.83 | 4.06 | -194 |
45 | Rudi Johnson | 2007 | 28 | CIN | 170 | 497 | 3 | 2.92 | 4.06 | -193 |
46 | Kerry Collins | 2002 | 30 | NYG | 44 | -3 | 0 | -0.07 | 4.22 | -189 |
47 | Po James | 1972 | 23 | PHI | 182 | 565 | 0 | 3.1 | 4.14 | -188 |
48 | Trent Richardson | 2012 | 21 | CLE | 267 | 950 | 11 | 3.56 | 4.26 | -188 |
49 | Chuck Foreman | 1978 | 28 | MIN | 237 | 749 | 5 | 3.16 | 3.95 | -188 |
50 | Kevan Barlow | 2004 | 25 | SFO | 244 | 822 | 7 | 3.37 | 4.14 | -188 |
51 | Alvin Maxson | 1975 | 24 | NOR | 139 | 371 | 3 | 2.67 | 4.01 | -187 |
52 | John Riggins | 1983 | 34 | WAS | 375 | 1347 | 24 | 3.59 | 4.09 | -187 |
53 | Tom Sullivan | 1974 | 24 | PHI | 244 | 760 | 11 | 3.11 | 3.88 | -187 |
54 | Rip Collins | 1950 | 24 | BAL | 69 | 101 | 0 | 1.46 | 4.16 | -186 |
55 | Curtis Martin | 1998 | 25 | NYJ | 369 | 1287 | 8 | 3.49 | 3.99 | -184 |
56 | Anthony Thomas | 2002 | 25 | CHI | 214 | 721 | 6 | 3.37 | 4.22 | -181 |
57 | Gene Gedman | 1958 | 26 | DET | 92 | 209 | 4 | 2.27 | 4.23 | -180 |
58 | Craig James | 1986 | 25 | NWE | 154 | 427 | 4 | 2.77 | 3.94 | -179 |
59 | Edgerrin James | 2002 | 24 | IND | 277 | 989 | 2 | 3.57 | 4.22 | -179 |
60 | Thomas Jones | 2011 | 33 | KAN | 153 | 478 | 0 | 3.12 | 4.29 | -179 |
61 | Marcel Shipp | 2005 | 27 | ARI | 157 | 451 | 0 | 2.87 | 4.01 | -178 |
62 | Harlan Huckleby | 1981 | 24 | GNB | 139 | 381 | 5 | 2.74 | 4.02 | -178 |
63 | Louis Carter | 1976 | 23 | TAM | 171 | 521 | 1 | 3.05 | 4.08 | -177 |
64 | Garry James | 1988 | 25 | DET | 182 | 552 | 5 | 3.03 | 4.01 | -177 |
65 | Edgar Bennett | 1995 | 26 | GNB | 316 | 1067 | 3 | 3.38 | 3.93 | -175 |
66 | Marshall Faulk | 1996 | 23 | IND | 198 | 587 | 7 | 2.96 | 3.85 | -175 |
67 | Kevan Barlow | 2006 | 27 | NYJ | 131 | 370 | 6 | 2.82 | 4.16 | -175 |
68 | Bill Mathis | 1963 | 25 | NYJ | 107 | 268 | 1 | 2.5 | 4.13 | -174 |
69 | Larry Johnson | 2009 | 30 | 2TM | 178 | 581 | 0 | 3.26 | 4.24 | -174 |
70 | Jamal Lewis | 2006 | 27 | BAL | 314 | 1132 | 9 | 3.61 | 4.16 | -173 |
71 | Kevin Smith | 2009 | 23 | DET | 217 | 747 | 4 | 3.44 | 4.24 | -173 |
72 | Stephen Davis | 2005 | 31 | CAR | 180 | 549 | 12 | 3.05 | 4.01 | -172 |
73 | Maurice Jones-Drew | 2013 | 28 | JAX | 234 | 803 | 5 | 3.43 | 4.17 | -172 |
74 | Troy Hambrick | 2003 | 27 | DAL | 275 | 972 | 5 | 3.53 | 4.16 | -172 |
75 | Jamal Lewis | 2005 | 26 | BAL | 269 | 906 | 3 | 3.37 | 4.01 | -172 |
76 | Jamal Lewis | 2008 | 29 | CLE | 279 | 1002 | 4 | 3.59 | 4.2 | -171 |
77 | Andra Franklin | 1983 | 24 | MIA | 224 | 746 | 8 | 3.33 | 4.09 | -170 |
78 | MacArthur Lane | 1974 | 32 | GNB | 137 | 362 | 3 | 2.64 | 3.88 | -169 |
79 | Chris Perry | 2008 | 27 | CIN | 104 | 269 | 2 | 2.59 | 4.2 | -168 |
80 | Emmitt Smith | 2004 | 35 | ARI | 267 | 937 | 9 | 3.51 | 4.14 | -168 |
81 | Charley Taylor | 1965 | 24 | WAS | 145 | 402 | 3 | 2.77 | 3.92 | -167 |
82 | Rodney Culver | 1992 | 23 | IND | 121 | 321 | 7 | 2.65 | 4.03 | -166 |
83 | Rickey Young | 1980 | 27 | MIN | 130 | 351 | 3 | 2.7 | 3.97 | -165 |
84 | Matt Forte | 2009 | 24 | CHI | 258 | 929 | 4 | 3.6 | 4.24 | -165 |
85 | Jahvid Best | 2010 | 21 | DET | 171 | 555 | 4 | 3.25 | 4.21 | -165 |
86 | Peyton Manning | 2013 | 37 | DEN | 32 | -31 | 1 | -0.97 | 4.17 | -164 |
87 | MacArthur Lane | 1973 | 31 | GNB | 170 | 528 | 1 | 3.11 | 4.06 | -163 |
88 | Sid Watson | 1956 | 24 | PIT | 112 | 298 | 4 | 2.66 | 4.11 | -162 |
89 | Jerome Bettis | 1994 | 22 | RAM | 319 | 1025 | 3 | 3.21 | 3.72 | -162 |
90 | Billy Ray Barnes | 1960 | 25 | PHI | 117 | 315 | 4 | 2.69 | 4.08 | -162 |
91 | Robert Holcombe | 1998 | 23 | STL | 98 | 230 | 2 | 2.35 | 3.99 | -161 |
92 | Ron Dayne | 2000 | 22 | NYG | 228 | 770 | 5 | 3.38 | 4.08 | -161 |
93 | BenJarvus Green-Ellis | 2013 | 28 | CIN | 220 | 756 | 7 | 3.44 | 4.17 | -161 |
94 | Preston Pearson | 1970 | 25 | PIT | 173 | 503 | 2 | 2.91 | 3.83 | -160 |
95 | Natrone Means | 1999 | 27 | SDG | 112 | 277 | 4 | 2.47 | 3.9 | -160 |
96 | Billy Cannon | 1962 | 25 | HOU | 147 | 474 | 7 | 3.22 | 4.31 | -159 |
97 | Ron Johnson | 1974 | 27 | NYG | 97 | 218 | 4 | 2.25 | 3.88 | -158 |
98 | Ted Dean | 1960 | 22 | PHI | 113 | 304 | 0 | 2.69 | 4.08 | -157 |
99 | Le'Veon Bell | 2013 | 21 | PIT | 244 | 860 | 8 | 3.52 | 4.17 | -157 |
100 | Reuben Droughns | 2006 | 28 | CLE | 220 | 758 | 4 | 3.45 | 4.16 | -157 |
In the 2000 calendar year, Eddie George had 519 carries. In the 2001 season, he produced the single worst season (according to this formula) since 1950. The next two seasons was nearly as bad, as George produced bottom-5 seasons in three consecutive years.
As you might expect, most of the running backs at the top of the list were very good running backs (or the lead backs on terrible teams — or both). They made it on to the list by virtue of getting too many carries when they were washed up or simply having a ton of carries in a very down year. At 27 in 2014, Rice is still pretty young, so he could end up with a Ricky Williams-like bounce back. Or, at 27, Rice is now old for a running back, and he could have a Larry Brown-like dropoff: the former Washington star was the NFL MVP in 1972, made this list in 1973, and then rushed for just 838 yards on 280 carries over the rest of his career. To the extent you believe a heavy workload signals overuse which leads to the wheels falling off, note that Rice led the NFL with 1,299 carries from 2009 to 2012 (including the postseason).
Since I already crunched the data, let’s close with a look at the best performances since 1950 in this statistic:
Rk | Runner | Year | Age | Tm | Rsh | RshYd | RshTD | YPC | LgAvg | YdsOvAvg |
---|---|---|---|---|---|---|---|---|---|---|
1 | Barry Sanders | 1997 | 29 | DET | 335 | 2053 | 11 | 6.13 | 3.98 | 720 |
2 | Jim Brown | 1963 | 27 | CLE | 291 | 1863 | 12 | 6.4 | 4.05 | 684 |
3 | O.J. Simpson | 1973 | 26 | BUF | 332 | 2003 | 12 | 6.03 | 4.06 | 654 |
4 | Barry Sanders | 1994 | 26 | DET | 331 | 1883 | 7 | 5.69 | 3.72 | 651 |
5 | Adrian Peterson | 2012 | 27 | MIN | 348 | 2097 | 12 | 6.03 | 4.26 | 614 |
6 | Eric Dickerson | 1984 | 24 | RAM | 379 | 2105 | 14 | 5.55 | 4.02 | 582 |
7 | Walter Payton | 1977 | 24 | CHI | 339 | 1852 | 14 | 5.46 | 3.85 | 547 |
8 | Michael Vick | 2006 | 26 | ATL | 123 | 1039 | 2 | 8.45 | 4.16 | 528 |
9 | Jamaal Charles | 2010 | 24 | KAN | 230 | 1467 | 5 | 6.38 | 4.21 | 499 |
10 | O.J. Simpson | 1975 | 28 | BUF | 329 | 1817 | 16 | 5.52 | 4.01 | 497 |
11 | Chris Johnson | 2009 | 24 | TEN | 358 | 2006 | 14 | 5.6 | 4.24 | 488 |
12 | Randall Cunningham | 1990 | 27 | PHI | 118 | 942 | 5 | 7.98 | 4.1 | 458 |
13 | Jamal Lewis | 2003 | 24 | BAL | 387 | 2066 | 14 | 5.34 | 4.16 | 456 |
14 | Earl Campbell | 1980 | 25 | HOU | 373 | 1934 | 13 | 5.18 | 3.97 | 452 |
15 | Terrell Davis | 1998 | 26 | DEN | 392 | 2008 | 21 | 5.12 | 3.99 | 445 |
16 | Jim Brown | 1958 | 22 | CLE | 257 | 1527 | 17 | 5.94 | 4.23 | 439 |
17 | Tiki Barber | 2005 | 30 | NYG | 357 | 1860 | 9 | 5.21 | 4.01 | 430 |
18 | Jim Brown | 1965 | 29 | CLE | 289 | 1544 | 17 | 5.34 | 3.92 | 411 |
19 | Ahman Green | 2003 | 26 | GNB | 355 | 1883 | 15 | 5.3 | 4.16 | 407 |
20 | Michael Vick | 2004 | 24 | ATL | 120 | 902 | 3 | 7.52 | 4.14 | 405 |
21 | Larry Johnson | 2005 | 26 | KAN | 336 | 1750 | 20 | 5.21 | 4.01 | 404 |
22 | Frank Gore | 2006 | 23 | SFO | 312 | 1695 | 8 | 5.43 | 4.16 | 398 |
23 | Shaun Alexander | 2005 | 28 | SEA | 370 | 1880 | 27 | 5.08 | 4.01 | 398 |
24 | Marshall Faulk | 1999 | 26 | STL | 253 | 1381 | 7 | 5.46 | 3.9 | 395 |
25 | Otis Armstrong | 1974 | 24 | DEN | 263 | 1407 | 9 | 5.35 | 3.88 | 387 |
26 | Emmitt Smith | 1993 | 24 | DAL | 283 | 1486 | 9 | 5.25 | 3.89 | 386 |
27 | Clinton Portis | 2003 | 22 | DEN | 290 | 1591 | 14 | 5.49 | 4.16 | 385 |
28 | Bobby Douglass | 1972 | 25 | CHI | 141 | 968 | 8 | 6.87 | 4.14 | 384 |
29 | Jim Brown | 1960 | 24 | CLE | 215 | 1257 | 9 | 5.85 | 4.08 | 380 |
30 | Adrian Peterson | 2007 | 22 | MIN | 238 | 1341 | 12 | 5.63 | 4.06 | 375 |
31 | Barry Sanders | 1996 | 28 | DET | 307 | 1553 | 11 | 5.06 | 3.85 | 372 |
32 | LaDainian Tomlinson | 2006 | 27 | SDG | 348 | 1815 | 28 | 5.22 | 4.16 | 368 |
33 | DeAngelo Williams | 2008 | 25 | CAR | 273 | 1515 | 18 | 5.55 | 4.2 | 367 |
34 | Jim Taylor | 1962 | 27 | GNB | 272 | 1474 | 19 | 5.42 | 4.07 | 367 |
35 | James Brooks | 1989 | 31 | CIN | 221 | 1239 | 7 | 5.61 | 3.95 | 366 |
36 | Barry Sanders | 1989 | 21 | DET | 280 | 1470 | 14 | 5.25 | 3.95 | 363 |
37 | C.J. Spiller | 2012 | 25 | BUF | 207 | 1244 | 6 | 6.01 | 4.26 | 362 |
38 | Joe Perry | 1954 | 27 | SFO | 173 | 1049 | 8 | 6.06 | 3.98 | 361 |
39 | Clinton Portis | 2002 | 21 | DEN | 273 | 1508 | 15 | 5.52 | 4.22 | 357 |
40 | Mercury Morris | 1973 | 26 | MIA | 149 | 954 | 10 | 6.4 | 4.06 | 349 |
41 | Dan Towler | 1951 | 23 | RAM | 126 | 854 | 6 | 6.78 | 4.05 | 344 |
42 | LaDainian Tomlinson | 2003 | 24 | SDG | 313 | 1645 | 13 | 5.26 | 4.16 | 343 |
43 | Robert Smith | 1997 | 25 | MIN | 232 | 1266 | 6 | 5.46 | 3.98 | 343 |
44 | Gale Sayers | 1966 | 23 | CHI | 229 | 1231 | 8 | 5.38 | 3.9 | 337 |
45 | Garrison Hearst | 1998 | 27 | SFO | 310 | 1570 | 7 | 5.06 | 3.99 | 334 |
46 | Marshall Faulk | 2001 | 28 | STL | 260 | 1382 | 12 | 5.32 | 4.06 | 327 |
47 | Jim Brown | 1964 | 28 | CLE | 280 | 1446 | 7 | 5.16 | 4 | 327 |
48 | Marshall Faulk | 2000 | 27 | STL | 253 | 1359 | 18 | 5.37 | 4.08 | 326 |
49 | Leroy Kelly | 1966 | 24 | CLE | 209 | 1141 | 15 | 5.46 | 3.9 | 325 |
50 | John David Crow | 1960 | 25 | STL | 183 | 1071 | 6 | 5.85 | 4.08 | 325 |
51 | O.J. Simpson | 1976 | 29 | BUF | 290 | 1503 | 8 | 5.18 | 4.08 | 319 |
52 | Skeets Quinlan | 1953 | 25 | RAM | 97 | 705 | 4 | 7.27 | 4 | 317 |
53 | Robert Smith | 2000 | 28 | MIN | 295 | 1521 | 7 | 5.16 | 4.08 | 317 |
54 | Jamaal Charles | 2009 | 23 | KAN | 190 | 1120 | 7 | 5.89 | 4.24 | 314 |
55 | Hugh McElhenny | 1952 | 24 | SFO | 98 | 684 | 6 | 6.98 | 3.81 | 310 |
56 | Chris Warren | 1994 | 26 | SEA | 333 | 1545 | 9 | 4.64 | 3.72 | 306 |
57 | Robert Griffin | 2012 | 22 | WAS | 120 | 815 | 7 | 6.79 | 4.26 | 304 |
58 | Tiki Barber | 2006 | 31 | NYG | 327 | 1662 | 5 | 5.08 | 4.16 | 303 |
59 | Gale Sayers | 1968 | 25 | CHI | 138 | 856 | 2 | 6.2 | 4.02 | 301 |
60 | Michael Vick | 2002 | 22 | ATL | 113 | 777 | 8 | 6.88 | 4.22 | 301 |
61 | Dan Towler | 1952 | 24 | RAM | 156 | 894 | 10 | 5.73 | 3.81 | 299 |
62 | LeSean McCoy | 2013 | 25 | PHI | 314 | 1607 | 9 | 5.12 | 4.17 | 299 |
63 | Keith Lincoln | 1963 | 24 | SDG | 128 | 826 | 5 | 6.45 | 4.13 | 297 |
64 | Napoleon Kaufman | 1996 | 23 | OAK | 150 | 874 | 1 | 5.83 | 3.85 | 297 |
65 | Fred Taylor | 2007 | 31 | JAX | 223 | 1202 | 5 | 5.39 | 4.06 | 297 |
66 | Lenny Moore | 1956 | 23 | BAL | 86 | 649 | 8 | 7.55 | 4.11 | 296 |
67 | Priest Holmes | 2002 | 29 | KAN | 313 | 1615 | 21 | 5.16 | 4.22 | 295 |
68 | Warrick Dunn | 2005 | 30 | ATL | 280 | 1416 | 3 | 5.06 | 4.01 | 294 |
69 | Jamaal Charles | 2012 | 26 | KAN | 285 | 1509 | 5 | 5.29 | 4.26 | 294 |
70 | Paul Lowe | 1960 | 24 | LAC | 136 | 855 | 8 | 6.29 | 4.13 | 293 |
71 | Emmitt Smith | 1995 | 26 | DAL | 377 | 1773 | 25 | 4.7 | 3.93 | 291 |
72 | Charlie Garner | 1999 | 27 | SFO | 241 | 1229 | 4 | 5.1 | 3.9 | 289 |
73 | Jerome Bettis | 1993 | 21 | RAM | 294 | 1429 | 7 | 4.86 | 3.89 | 286 |
74 | Leroy Kelly | 1967 | 25 | CLE | 235 | 1205 | 11 | 5.13 | 3.92 | 284 |
75 | Terrell Davis | 1997 | 25 | DEN | 369 | 1750 | 15 | 4.74 | 3.98 | 282 |
76 | Jim Taylor | 1961 | 26 | GNB | 243 | 1307 | 15 | 5.38 | 4.22 | 282 |
77 | Don Woods | 1974 | 23 | SDG | 227 | 1162 | 7 | 5.12 | 3.88 | 281 |
78 | Ottis Anderson | 1979 | 22 | STL | 331 | 1605 | 8 | 4.85 | 4 | 281 |
79 | Randall Cunningham | 1986 | 23 | PHI | 66 | 540 | 5 | 8.18 | 3.94 | 280 |
80 | James Brooks | 1986 | 28 | CIN | 205 | 1087 | 5 | 5.3 | 3.94 | 280 |
81 | Paul Lowe | 1963 | 27 | SDG | 177 | 1010 | 8 | 5.71 | 4.13 | 279 |
82 | Donovan McNabb | 2000 | 24 | PHI | 86 | 629 | 6 | 7.31 | 4.08 | 278 |
83 | Paul Lowe | 1965 | 29 | SDG | 222 | 1121 | 6 | 5.05 | 3.8 | 277 |
84 | Franco Harris | 1972 | 22 | PIT | 188 | 1055 | 10 | 5.61 | 4.14 | 277 |
85 | Thurman Thomas | 1991 | 25 | BUF | 288 | 1407 | 7 | 4.89 | 3.93 | 276 |
86 | Mike Anderson | 2000 | 27 | DEN | 297 | 1487 | 15 | 5.01 | 4.08 | 275 |
87 | Stephen Davis | 1999 | 25 | WAS | 290 | 1405 | 17 | 4.84 | 3.9 | 274 |
88 | Wendell Tyler | 1984 | 29 | SFO | 246 | 1262 | 7 | 5.13 | 4.02 | 273 |
89 | Steve McNair | 1997 | 24 | TEN | 101 | 674 | 8 | 6.67 | 3.98 | 272 |
90 | Dan Towler | 1953 | 25 | RAM | 152 | 879 | 7 | 5.78 | 4 | 272 |
91 | Tony Dorsett | 1981 | 27 | DAL | 342 | 1646 | 4 | 4.81 | 4.02 | 272 |
92 | Hoyle Granger | 1967 | 23 | HOU | 236 | 1194 | 6 | 5.06 | 3.92 | 268 |
93 | Larry Csonka | 1971 | 25 | MIA | 195 | 1051 | 7 | 5.39 | 4.02 | 267 |
94 | Bo Jackson | 1989 | 27 | RAI | 173 | 950 | 4 | 5.49 | 3.95 | 266 |
95 | Barry Sanders | 1995 | 27 | DET | 314 | 1500 | 11 | 4.78 | 3.93 | 266 |
96 | Greg Pruitt | 1978 | 27 | CLE | 176 | 960 | 3 | 5.45 | 3.95 | 264 |
97 | Michael Vick | 2011 | 31 | PHI | 76 | 589 | 1 | 7.75 | 4.29 | 263 |
98 | Ray Rice | 2009 | 22 | BAL | 254 | 1339 | 7 | 5.27 | 4.24 | 262 |
99 | Hugh McElhenny | 1954 | 26 | SFO | 64 | 515 | 6 | 8.05 | 3.98 | 261 |
100 | Roger Craig | 1988 | 28 | SFO | 310 | 1502 | 9 | 4.85 | 4.01 | 260 |
Unsurprisingly, there’s a lot of overlap between this list and this list. But this time, Barry Sanders takes the top spot.