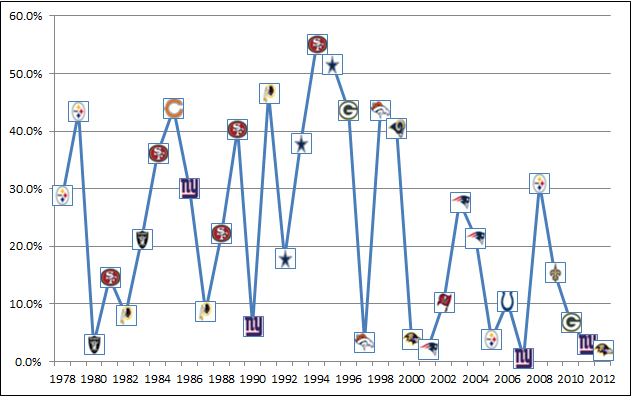
Earlier this week, I looked at how likely or unlikely the playoffs were in each of the last 25 seasons. Today, we look at each Super Bowl winner since 1978, and calculate their odds of winning each playoff game, and by extension, how likely (or unlikely) it was that that team wound up winning the Super Bowl.
As you might expect, no team was as unlikely to win the Super Bowl at the start of the playoffs as the 2007 New York Giants. If we know the points spread for a given game, we can derive the team’s probability of winning by using the following formula, assuming the spread (with a negative number for the favorite) is in cell C2 in Excel:
=(1-NORMDIST(0.5,-(C2),13.86,TRUE)) + 0.5*(NORMDIST(0.5,-(C2),13.86,TRUE)-NORMDIST(-0.5,-(C2),13.86,TRUE))
New York was a 3-point underdog in Tampa Bay in the Wildcard round (41.4%), a 7-point dog in Dallas (30.7%), and a 7.5-point underdog in Green Bay in the NFC Championship Game (29.4%). Then, in the Super Bowl against the 18-0 Patriots, the Giants were 12.5-point underdogs, implying an 18.4% chance of victory. The odds of New York winning all four of those games was less than one percent! I don’t think this was a case where the oddsmakers were off, either. Remember that in 2007, Eli Manning led the league in interceptions and the Giants were significantly worse in the regular season than Dallas, Green Bay, or New England. Even in retrospect, the Giants run was remarkable, but even unlikely events are likely to happen given a long enough time period. Of course, it sure seemed like unlikely events were becoming the norm in the playoffs, at least until 2013.
I used this same process to calculate the odds of each Super Bowl champion since 1978 to determine their probability of winning the title. Take a look:
If Peyton Manning and the Broncos win Super Bowl XLVIII — as 2-point favorites — Denver’s odds of winning would have been 26%, as a result of a 56% chance of success against Seattle, a 65% chance against New England, and a 72% chance against San Diego. That would make the Broncos the second most likely champion of the last ten years, after the ’08 Steelers.
The math only changes slightly if Russell Wilson and Seattle are victorious. The Seahawks were 7.5-point favorites against the Saints, 3.5-point favorites against San Francisco, and are currently 2-point dogs to Denver. If Seattle wins, they would have had a 19% chance of winning it all, which would be the second highest of the last nine years. No matter who wins, it won’t be a big surprise, which is what you’d expect with two number one seeds.
Here’s the data from the graph above broken down by pre-game win probability in each round:
Only two teams — the 1994 49ers and the 1995 Cowboys — were more likely than not to win the Super Bowl. That is incredible. Both teams were favored by at least a touchdown in each of their playoff games. I’m actually surprised that the 49ers — who, ya know, choked in ’92 and ’93 — were 7-point favorites against the Cowboys in the 1994 NFC Championship Game. Of course, after San Francisco validated its regular season success by beating Dallas, the sports world stopped using notions like San Francisco/Steve Young could never beat Dallas/Troy Aikman regardless of their numbers during the regular season.
On the other side of the coin, the ’12 Ravens and ’11 Giants were join the ’07 Giants as two of the five least likely Super Bowl champs since 1978. The fourth team in that group, of course, was the ’01 Patriots. The fifth team was the 1980 Raiders, the first Wild Card team to win the Super Bowl. That Oakland squad had only a 3% chance of winning it all at the start of the playoffs.
I went back and calculated the odds of one pre-1978 Super Bowl champion. The 1968 Jets were a 3-point favorite over Oakland in the AFL title game according to Jimmy the Greek, which would imply a 58.6% chance of success. Then, in Super Bowl III, New York was a 19-point underdog against the Colts, from which we can derive an only 8.5% chance of victory. That means Joe Namath and the Jets, with only two playoff games, had just a 5% chance of winning the Super Bowl at the start of the playoffs. I don’t think any team in the pre-1978 era can compare to that, but eight teams since then have had lower odds.

