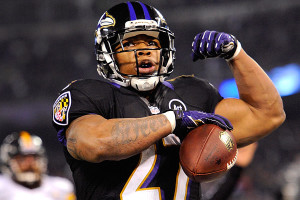
As you might expect, much of the blame falls on the Baltimore offensive line. In particular, tackles Michael Oher and Bryant McKinnie have been terrible, so much so that McKinnie was traded to Miami. Pro Football Focus also gives poor run-blocking grades to Ed Dickson, Dallas Clark (unsurprisingly), and Vonta Leach (very surprisingly). I haven’t watched enough of Baltimore to tell you why the Ravens have struggled so significantly to run the ball, but I can provide some perspective on how poorly Rice’s numbers are.
We don’t have play-by-play data going back to 1960, but we do have game-by-game data back that far. I went back and noted every running back who had a season-to-date yards per carry average below 2.80 following the game where he recorded his 97th carry. The table below shows the 43 players to do so from 1960 to 2012, sorted in reverse chronological order. The last player was former Raven Chester Taylor, and here is how his line reads: In 2010, playing for the Bears at age 31, Taylor had 105 carries for 252 yards, producing a 2.4 yards per carry average, following the game where he received his 97th carry of the year. The rest of the season, he had 7 rushes for 15 yards, a 2.14 YPC average.
Name | Year | Team | age | Rsh | Yd | YPC | ROY Rsh | ROY Yd | ROY YPC |
---|---|---|---|---|---|---|---|---|---|
Chester Taylor | 2010 | CHI | 31 | 105 | 252 | 2.4 | 7 | 15 | 2.14 |
Chris Perry | 2008 | CIN | 27 | 98 | 258 | 2.63 | 6 | 11 | 1.83 |
Rudi Johnson | 2007 | CIN | 28 | 101 | 267 | 2.64 | 69 | 230 | 3.33 |
Marcel Shipp | 2005 | ARI | 27 | 97 | 241 | 2.48 | 60 | 210 | 3.5 |
Curtis Martin | 2005 | NYJ | 32 | 105 | 285 | 2.71 | 115 | 450 | 3.91 |
Eddie George | 2003 | TEN | 30 | 109 | 304 | 2.79 | 203 | 727 | 3.58 |
Eddie George | 2001 | TEN | 28 | 106 | 290 | 2.74 | 209 | 649 | 3.11 |
Adrian Murrell | 1999 | ARI | 29 | 103 | 257 | 2.5 | 90 | 296 | 3.29 |
Natrone Means | 1999 | SDG | 27 | 103 | 269 | 2.61 | 9 | 8 | 0.89 |
Robert Holcombe | 1998 | STL | 23 | 97 | 227 | 2.34 | 1 | 3 | 3 |
Jamal Anderson | 1997 | ATL | 25 | 109 | 273 | 2.5 | 181 | 729 | 4.03 |
Larry Centers | 1997 | ARI | 29 | 98 | 256 | 2.61 | 3 | 20 | 6.67 |
Karim Abdul-Jabbar | 1997 | MIA | 23 | 98 | 273 | 2.79 | 185 | 619 | 3.35 |
Lawrence Phillips | 1996 | STL | 21 | 115 | 310 | 2.7 | 78 | 322 | 4.13 |
Marshall Faulk | 1996 | IND | 23 | 98 | 273 | 2.79 | 100 | 314 | 3.14 |
Harold Green | 1993 | CIN | 25 | 102 | 243 | 2.38 | 113 | 346 | 3.06 |
Rodney Culver | 1992 | IND | 23 | 99 | 201 | 2.03 | 22 | 120 | 5.45 |
Heath Sherman | 1991 | PHI | 24 | 99 | 266 | 2.69 | 7 | 13 | 1.86 |
Garry James | 1988 | DET | 25 | 108 | 292 | 2.7 | 74 | 260 | 3.51 |
Allen Rice | 1988 | MIN | 26 | 97 | 265 | 2.73 | 13 | 57 | 4.38 |
Keith Byars | 1988 | PHI | 25 | 103 | 287 | 2.79 | 49 | 230 | 4.69 |
Tony Collins | 1986 | NWE | 27 | 110 | 304 | 2.76 | 46 | 108 | 2.35 |
Keith Byars | 1986 | PHI | 23 | 97 | 271 | 2.79 | 80 | 306 | 3.83 |
Clarence Williams | 1980 | SDG | 25 | 97 | 258 | 2.66 | 0 | 0 | 0 |
Rickey Young | 1980 | MIN | 27 | 97 | 266 | 2.74 | 33 | 85 | 2.58 |
Benny Malone | 1979 | WAS | 27 | 104 | 254 | 2.44 | 72 | 218 | 3.03 |
Don Hardeman | 1979 | BAL | 27 | 100 | 275 | 2.75 | 9 | 17 | 1.89 |
Larry Schreiber | 1975 | SFO | 28 | 100 | 278 | 2.78 | 34 | 59 | 1.74 |
Ron A. Johnson | 1974 | NYG | 27 | 97 | 218 | 2.25 | 0 | 0 | 0 |
Larry Brown | 1974 | WAS | 27 | 102 | 261 | 2.56 | 61 | 169 | 2.77 |
Floyd Little | 1974 | DEN | 32 | 104 | 277 | 2.66 | 13 | 35 | 2.69 |
MacArthur Lane | 1973 | GNB | 31 | 105 | 254 | 2.42 | 65 | 274 | 4.22 |
Larry Brown | 1973 | WAS | 26 | 118 | 320 | 2.71 | 155 | 540 | 3.48 |
Lee Bouggess | 1971 | PHI | 23 | 97 | 262 | 2.7 | 0 | 0 | 0 |
Clint Jones | 1971 | MIN | 26 | 102 | 281 | 2.75 | 78 | 394 | 5.05 |
Lee Bouggess | 1970 | PHI | 22 | 110 | 290 | 2.64 | 49 | 111 | 2.27 |
Hoyle Granger | 1969 | HOU | 25 | 97 | 260 | 2.68 | 89 | 480 | 5.39 |
Floyd Little | 1967 | DEN | 25 | 104 | 287 | 2.76 | 26 | 94 | 3.62 |
Abner Haynes | 1966 | DEN | 29 | 97 | 235 | 2.42 | 32 | 69 | 2.16 |
Tom Moore | 1966 | RAM | 28 | 99 | 250 | 2.53 | 5 | 22 | 4.4 |
Joe Auer | 1966 | MIA | 25 | 100 | 256 | 2.56 | 21 | 160 | 7.62 |
Mike Lind | 1964 | SFO | 24 | 100 | 256 | 2.56 | 0 | 0 | 0 |
Bill Mathis | 1963 | NYJ | 25 | 105 | 270 | 2.57 | 2 | -2 | -1 |
One name on that list inspires some hope: Atlanta’s Jamal Anderson had a miserable start to the ’97 season, rushing 109 times for just 273 yards. Then he averaged four yards per carry the rest of the way, and in 1998, rushed for 1,846 yards and led the Falcons to the Super Bowl.
Of course, that’s just one example. Most of the players in recent memory to perform as poorly as Rice has played were essentially washed up. It’s too early to know if that’s the case with Rice, but it’s a fair question to ask in light of Rice’s slow start.
I ran one other query, looking at all running backs since 1970 who:
- played in at least 8 games in three straight years
- Averaged at least 70 rushing yards per game over the prior three years, taking an average of the season averages (Rice averaged 78 rushing yards per game from 2010 to 2012)
- Averaged at least 60 rushing yards in Year N-1 (Rice averaged 71 rushing yards per game in 2012)
How many of those backs averaged fewer than 50 rushing yards per game in Year N? Just twenty:
Running back | Year | Tm | Age | n-1 | n-2 | n-3 | avg | G | Rsh Yd/G | RshYd |
---|---|---|---|---|---|---|---|---|---|---|
Michael Turner | 2012 | ATL | 30 | 83.8 | 85.7 | 79.2 | 82.9 | 16 | 50 | 800 |
Willie Parker | 2009 | PIT | 29 | 71.9 | 87.7 | 93.4 | 84.3 | 14 | 27.8 | 389 |
Larry Johnson | 2009 | 2TM | 30 | 72.8 | 69.9 | 111.8 | 84.8 | 14 | 40.1 | 562 |
Edgerrin James | 2008 | ARI | 30 | 76.4 | 72.4 | 100.4 | 83.1 | 13 | 39.5 | 514 |
Fred Taylor | 2008 | JAX | 32 | 80.1 | 76.4 | 71.5 | 76 | 13 | 42.8 | 556 |
Julius Jones | 2007 | DAL | 26 | 67.8 | 76.4 | 102.4 | 82.2 | 16 | 36.8 | 588 |
Warrick Dunn | 2007 | ATL | 32 | 71.3 | 88.5 | 69.1 | 76.3 | 16 | 45 | 720 |
Corey Dillon | 2006 | NWE | 32 | 61.1 | 109 | 41.6 | 70.6 | 16 | 50.8 | 812 |
Anthony Thomas | 2004 | CHI | 27 | 78.8 | 60.1 | 84.5 | 74.5 | 12 | 33.7 | 404 |
Corey Dillon | 2003 | CIN | 29 | 81.9 | 82.2 | 89.7 | 84.6 | 13 | 41.6 | 541 |
Adrian Murrell | 1999 | ARI | 29 | 69.5 | 67.9 | 78.1 | 71.8 | 16 | 34.6 | 553 |
Thurman Thomas | 1997 | BUF | 31 | 68.9 | 71.8 | 72.9 | 71.2 | 16 | 40.2 | 643 |
Christian Okoye | 1992 | KAN | 31 | 73.6 | 57.5 | 98.7 | 76.6 | 15 | 29.9 | 448 |
Curt Warner | 1989 | SEA | 28 | 64.1 | 82.1 | 92.6 | 79.6 | 16 | 39.4 | 631 |
Walter Payton | 1987 | CHI | 33 | 83.3 | 96.9 | 105.3 | 95.2 | 12 | 44.4 | 533 |
Earl Campbell | 1984 | 2TM | 29 | 92.9 | 59.8 | 86 | 79.6 | 14 | 33.4 | 468 |
Delvin Williams | 1979 | MIA | 28 | 78.6 | 66.5 | 92.5 | 79.2 | 14 | 50.2 | 703 |
Mike Thomas | 1978 | WAS | 25 | 62 | 84.7 | 65.6 | 70.8 | 13 | 41 | 533 |
John Brockington | 1975 | GNB | 27 | 63.1 | 81.7 | 73.4 | 72.7 | 14 | 31 | 434 |
Floyd Little | 1974 | DEN | 32 | 69.9 | 61.4 | 80.9 | 70.7 | 14 | 22.3 | 312 |
If Rice does end 2013 with such a low rushing average, he’d be joining a long list of feature running backs who fell off a cliff…. and never recovered. I’m not ready to write off Rice just yet — he still has gained the most yards from scrimmage of any player since 2009, and the poor production from Pierce seems to be a strong mitigating factor. But when running backs fall off, the decline tends to be can be quite steep, and often out of nowhere.