
The 2018 Draft Class was hailed as one of the best of all time. Where do things stand after three years? At a high level, it looks like there are three winners and two losers — after all, three of those quarterbacks will be starting games this weekend in the division round of the playoffs, while the other two were huge busts for their drafting team. But let’s dig a little deeper:
- Baker Mayfield was the first overall pick and has had an up-and-down run with Cleveland. Overall, he’s done enough to show that he deserves to keep the starting job, but he has not had a top-10 quarterback season since entering the league. Probably a bit below the expectations that come with the number one overall pick, but Cleveland fans are not unhappy.
- Sam Darnold was the third overall draft pick, selected by the New York Jets. It has not gone well.
- Josh Allen was the 7th overall pick and is probably the toughest player to evaluate. He was awful as a rookie, bad as a second-year player, and then played like a top-5 quarterback in 2020. He looks like a big win for Buffalo, and he adds a lot of value as a runner; that said, as a passer, he’s actually been below average over the course of his three seasons.
- Josh Rosen has been the clear worst quarterback of the group, and his team moved on from him after just one year. Rosen has been worse than Darnold on a per play basis, but given that Arizona replaced him with Kyler Murray, you could argue that the Cardinals were hurt less by the Rosen pick than the Jets were with Darnold. Rosen has been a fast burn, like a Johnny Manziel, while Darnold more fits the Joey Harrington or Rick Mirer slow burn mold.
- Lamar Jackson is the quarterback least capable of being evaluated solely as a passer, because he’s been the most dynamic runner in the NFL since he entered the league. Still, he’s been a very good passer through three seasons, and has clearly been the most productive quarterback through three years.
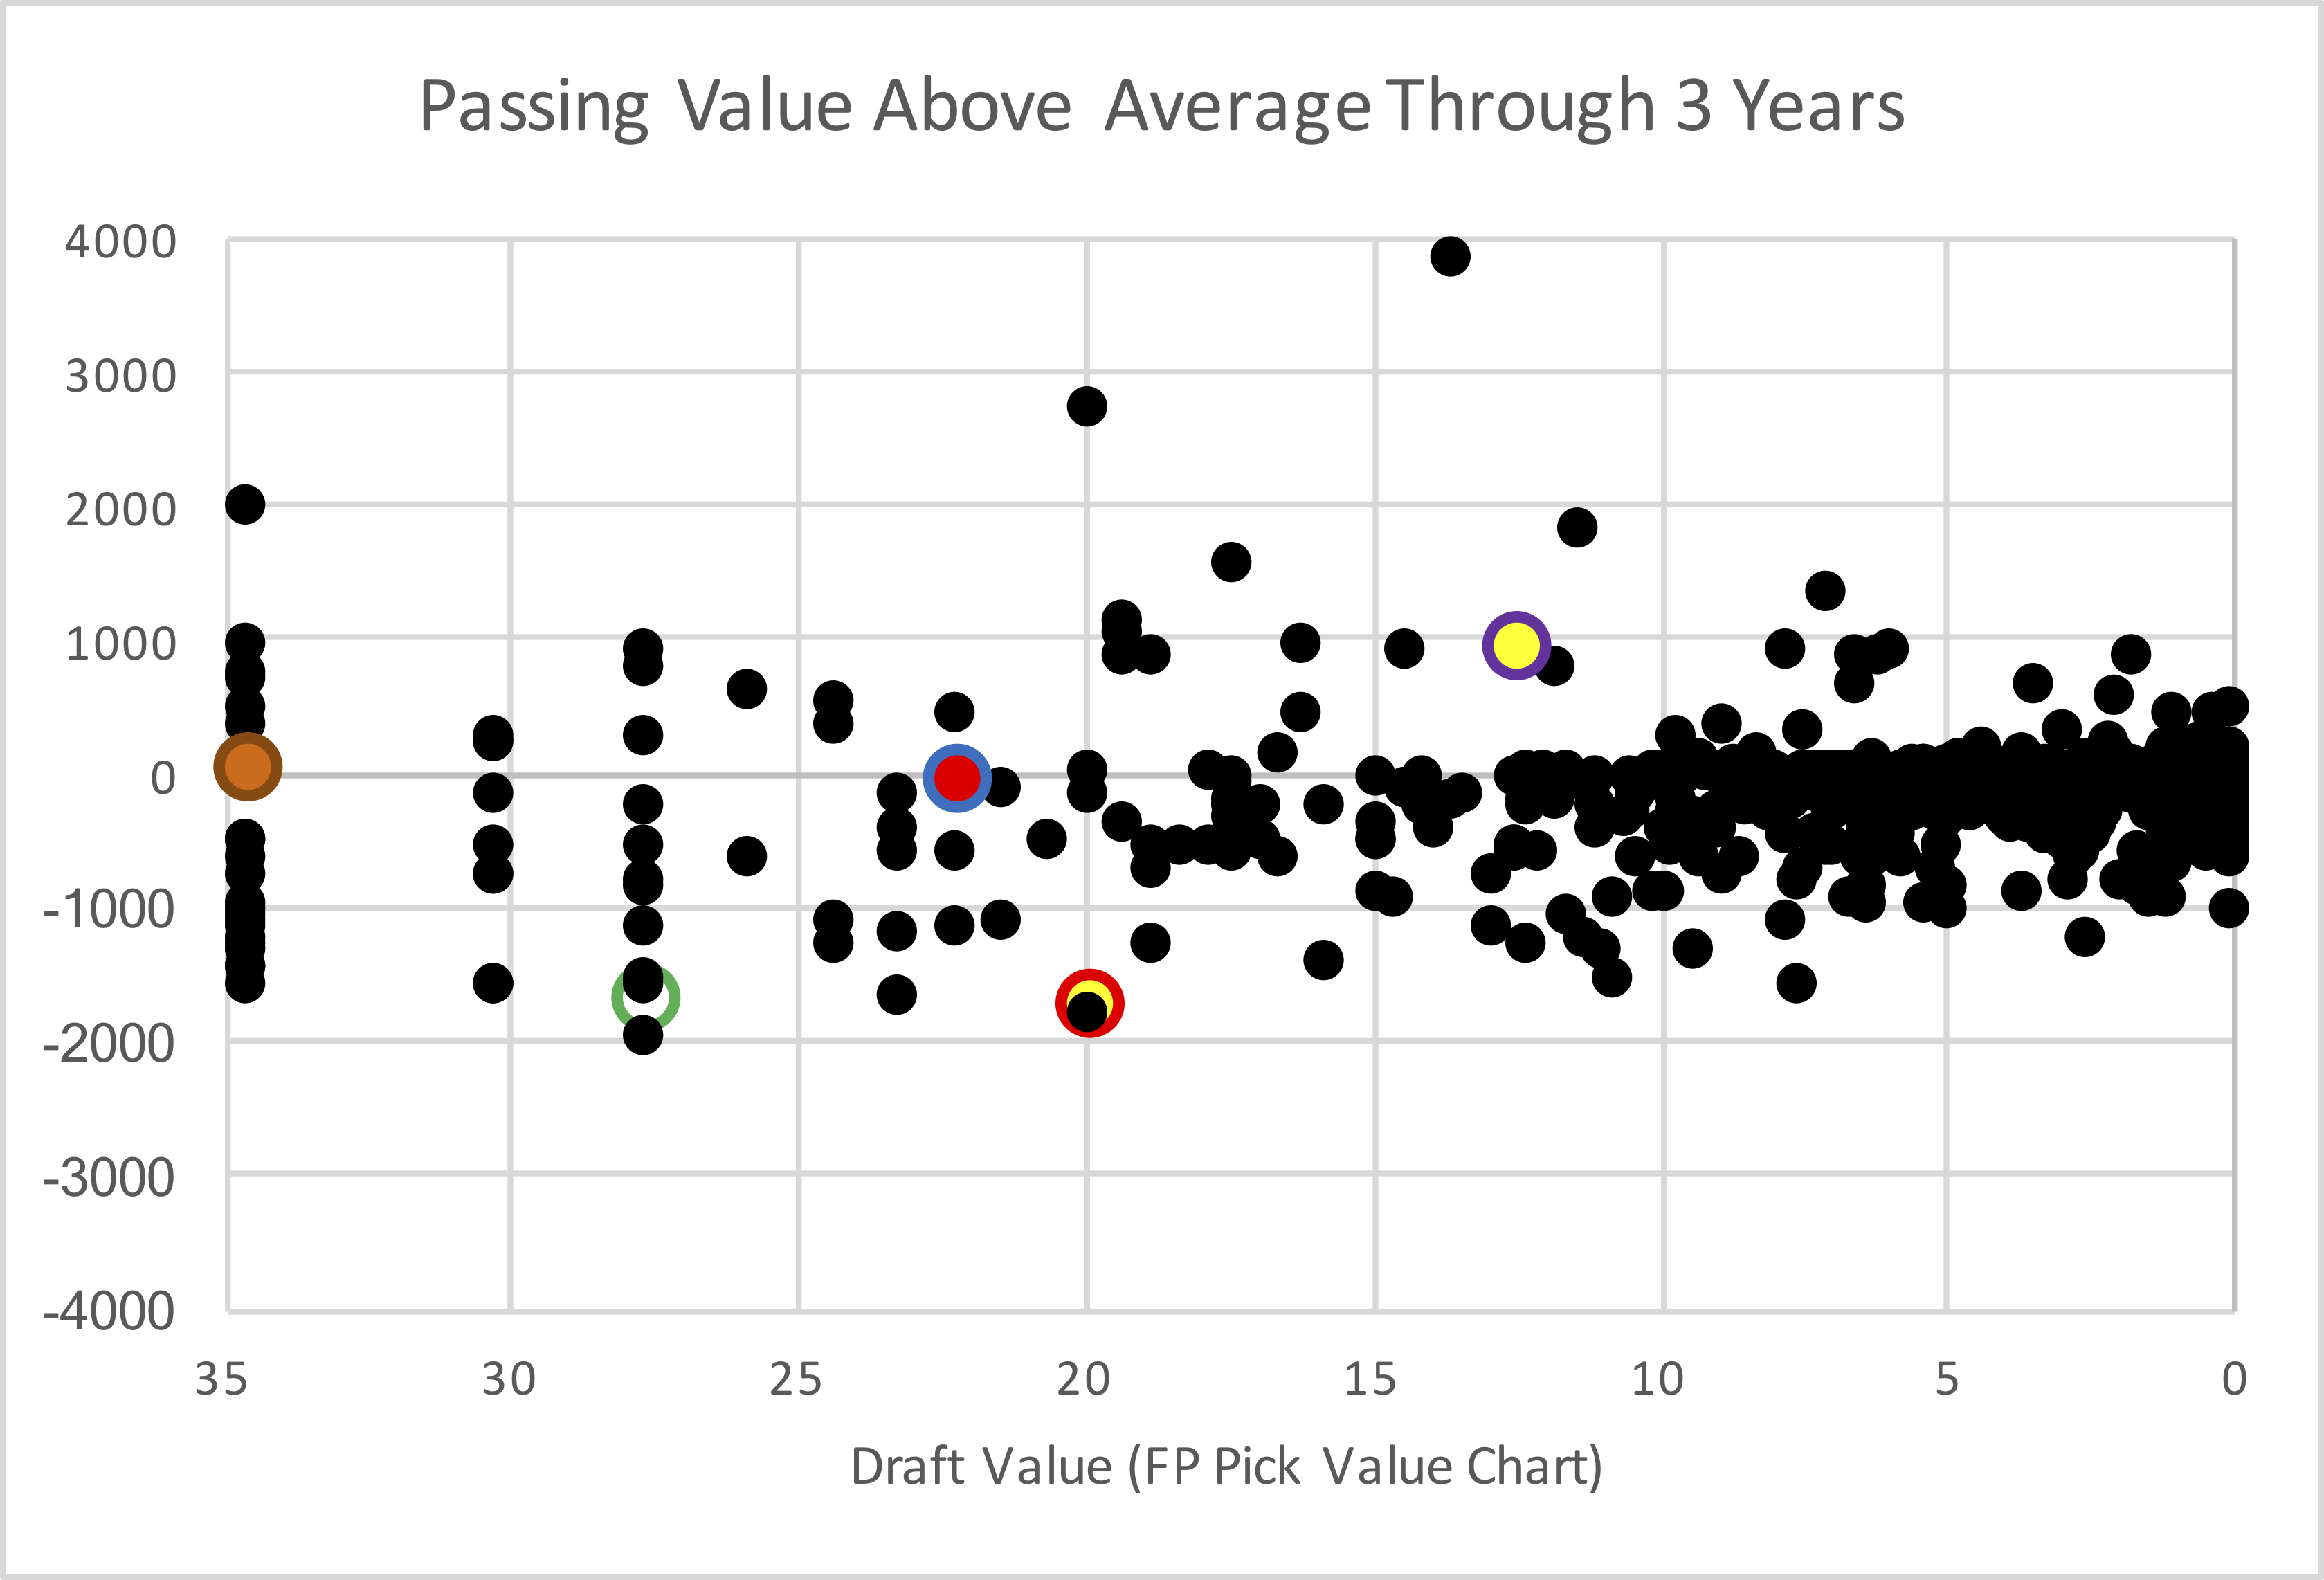
The graph below shows all quarterbacks drafted over a 50-year period, from 1969 to 2018. The Y-Axis shows how much passing value over average they produced — calculated by taking each quarterback’s Adjusted Net Yards per Attempt average relative to league average in each season, and multiplying that by the number of dropbacks. The X-Axis shows each player’s draft value, which is based on their draft selection. The more highly drafted players are on the left side of the chart, while the later picks are on the right side of the chart. For the 2018 1st round quarterbacks, I made their bubbles larger and color-coded them by team.
And here is the full dataset; the table is sortable and searchable.
Darnold and Rosen grade out as two of the five worst passers through three seasons in the entire study, although a pair of Jaguars have them both beat.