The first step in trying to measure the aging patterns of quarterbacks is to figure out a sample to analyze. I decided to look at all quarterbacks who entered the league since 1970 and have since retired. I further limited my sample to quarterbacks who had at least three seasons of above-average play based on this system. That brought us to a group of 77 quarterbacks, from quarterbacks like Jon Kitna, Jay Fiedler, and Dan Pastorini to Hall of Famers like Joe Montana, Brett Favre, and Dan Marino.
While before I graded quarterbacks based on how much value over average they provided, that baseline is too high for this type of post. Instead, I gave quarterbacks credit for their value over replacement, defined as 75% of the league average. I then calculated the best three seasons of value over replacement (VOR) for each quarterback’s career to get a sense of their peak level of play. The last step was to divided their VOR in each season of their career by their peak value. Do this for each of the 77 quarterbacks, and we can get a sense of quarterback aging patterns.
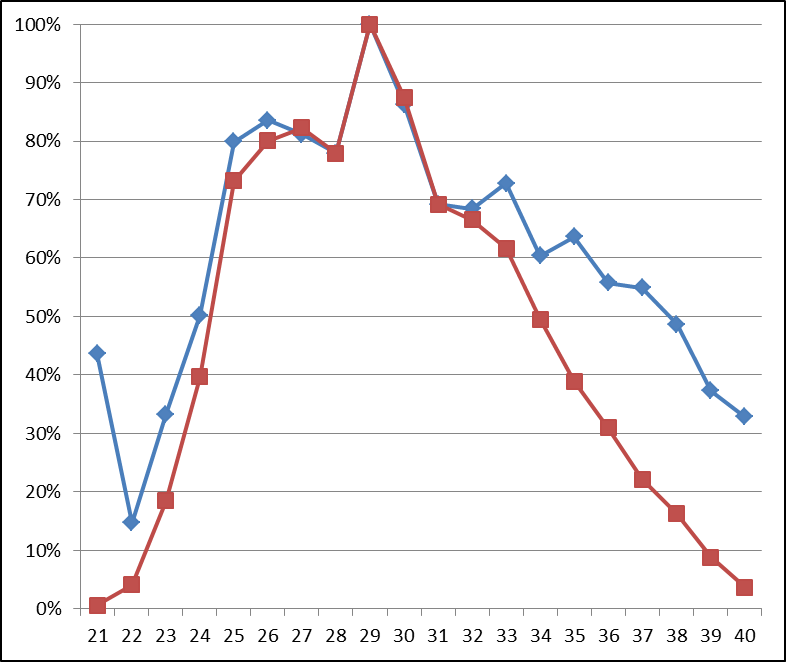
There is another thing to consider when coming up with an age curve: The intuitive way is to sum up each quarterback’s value (relative to his peak) in each season and divide that total by the number of quarterbacks active at that age. Another way is to divide that total by 77, the number of quarterbacks in the study. The former method will make really young and really old ages look closer to average than they really are, but I have decided to include both methods in the picture below. The blue line represents the average performance based on the number of quarterbacks actually playing in the NFL that season; the red line shows the aging patterns when you divide by the total number of passers in the group.

Quarterbacks peak at age 29, although the five-year period from 26 to 30 is probably better classified as the prime of a quarterback’s career. For elite quarterbacks, like Peyton Manning and Tom Brady, the curve is obviously much flatter; for the worst quarterbacks, the curve is just as surely steeper.
So how a quarterback plays at age 24 might represent just 40% of the value they’ll provide once they hit their peak. That’s how old Matt Stafford and Josh Freeman were last year, although both players were born early 1988 and were therefore nearly 25-year-old quarterbacks last year. But the point is that they are still far on the left side of the aging curve.
Alex Smith? He was just 28 last year, and thus enters the magical age 29 season in 2013. Even if you ignore his Harbaugh years, he averaged 6.1 NY/A and 5.6 ANY/A in 2010 at the age of 26. Both of those numbers were just a hair below league-average. Smith wasn’t that much different statistically in 2011 than he was in 2010; it just so happened that San Francisco allowed 22.4 points per game in his 10 starts in 2010 and just 14.3 in 2011. And in fact, outside of an incredible (and presumably unsustainable) interception rate, he was better in 2010 than 2011.
A passer who is average at 26 should be expected to be a bit above-average at age 29. One-seventh of the quarterbacks in the study – Ron Jaworski, Pastorini, Mark Rypien, Neil O’Donnell, Marc Bulger, Gary Danielson, Kordell Stewart, Archie Manning, Ken Stabler, Jake Delhomme, and Troy Aikman — were at their best that season.
But that shouldn’t make Chiefs fans too excited, because the other side of the coin makes the Smith trade look questionable. Smith should only be expected to be at his peak in 2013 and 2014, and the decline period can be pretty steep. Elvis Grbac, another 49er-turned-Chief, had his best season at age 30 with the Chiefs, struggled at age 31 with the Ravens, was released by Baltimore, and ultimately chose to retire.
The above is just one way to measure quarterback aging; here is another. The table below shows where the group of 77 ranked on the quarterback index lists at PFR in both NY/A and ANY/A at each age. Only quarterbacks with the minimum number of pass attempts to qualify for the passing title were included, so the sample is obviously a little bit smaller here. As a result, there is no “divide by 77” column here, and the average is simply the average of the number of quarterbacks active during that season with enough attempts to qualify:
In the passing tables, 100 equals league average, 85 is one standard deviation below average, and 115 is one standard deviation above average. Most of the quarterbacks in this study simply weren’t playing at ages 21, 22, or 23, but the ones that did performed fairly well. Still, you can see that a good bit of improvement — roughly 0.6 standard deviations — can be expected from age 24 until a quarterback hits his prime.
On the other hand, this doesn’t account for the Brett Favres of the world, who played well at age 40. If anything, the number of quarterbacks with enough attempts to qualify at each age might be the most revealing piece of information in the above table. The peak is again at age 29, with ages 27 to 31 looking like the prime.

