≡ Menu

Quarterback Wins: Outlier Seasons

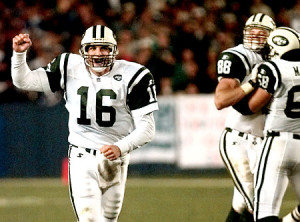
Testaverde led the Jets to the AFCCG in 1998

Testaverde led the Jets to the AFCCG in 1998.

The 1998 season was one of my favorite years in NFL history. It was also a pretty weird one. We had Terrell Davis rushing for 2,000 yards, rookies Randy Moss and Fred Taylor making defenses look silly, and a quartet of old quarterbacks stun the football world. Doug Flutie came out of nowhere Canada to lead the Bills to a 7-3 record after being out of the NFL for nine years. Randall Cunningham, who had retired after the ’96 season, came off the bench in ’98 to produce one of the best backup seasons in NFL history. The other two quarterbacks are the stars of this post.

Vinny Testaverde had a very up-and-down career, although he was almost certainly a much better quarterback than you remember. Okay, Testaverde has lost more games than any other quarterback, but he played on some really bad teams throughout his career. Testaverde retired with a career winning percentage of 0.423. In 1998, he started 13 games for the Jets; based on that career winning percentage, we would have expected him to win 5.5 games in 1998. Instead, Testaverde went 12-1 in the regular season, giving him 6.5 more wins than we would expect. If that sounds remarkable to you, it should: that’s the 2nd largest discrepancy of any quarterback in NFL history in a single season (minimum 40 career wins).

The largest? That honor belongs to Chris Chandler, who went 13-1 in that same season. For his career, Chandler had a 0.441 winning percentage, so we would have expected him to win 6.2 out of 14 games. Instead, Chandler finished with 6.8 more wins than expected. [1]Some might argue that when calculating this “wins over expectation” metric, we should exclude the quarterback’s record from that season. I didn’t want to do that, though, … Continue reading

The table below lists the 75 largest outliers. Cunningham’s ’98 season comes in 19th place.

RkQuarterbackAgeYearTmSea RecCar Win%Sea Win%Exp WinsDiff
1Chris Chandler331998ATL13-10.4410.9296.26.8
2Vinny Testaverde351998NYJ12-10.4230.9235.56.5
3Marc Bulger262003STL12-30.4320.86.55.5
4Mark Brunell291999JAX13-20.5170.8677.75.3
5Kerry Collins362008TEN12-30.450.86.85.3
6Billy Wade331963CHI11-1-20.4820.8576.85.2
7Trent Green332003KAN13-30.4960.8137.95.1
8Tobin Rote351963SDG11-30.4350.7866.14.9
9Steve DeBerg361990KAN11-50.3820.6886.14.9
10Jake Plummer312005DEN13-30.5070.8138.14.9
11Kurt Warner302001STL14-20.5740.8759.24.8
12Kerry Collins282000NYG12-40.450.757.24.8
13John Hadl331973RAM12-20.5180.8577.34.7
14Boomer Esiason271988CIN12-40.4620.757.44.6
15Matt Hasselbeck302005SEA13-30.5260.8138.44.6
16Steve Bartkowski281980ATL12-40.4650.757.44.6
17Fran Tarkenton331973MIN12-20.5310.8577.44.6
18Fran Tarkenton351975MIN12-20.5310.8577.44.6
19Randall Cunningham351998MIN13-10.6110.9298.64.4
20Phil Simms311986NYG14-20.5970.8759.64.4
21Daunte Culpepper232000MIN11-50.410.6886.64.4
22Mark Rypien291991WAS14-20.6030.8759.64.4
23Bart Starr281962GNB13-10.6180.9298.64.4
24Jim Everett261989RAM11-50.4180.6886.74.3
25Ben Roethlisberger222004PIT13-00.66918.74.3
26Jeff George321999MIN8-20.3710.83.74.3
27Steve DeBerg371991KAN10-50.3820.6675.74.3
28Earl Morrall341968BAL13-10.6260.9298.84.2
29Alex Smith272011SFO13-30.550.8138.84.2
30Dan Marino231984MIA14-20.6130.8759.84.2
31Bert Jones251976BAL11-30.490.7866.94.1
32Philip Rivers252006SDG14-20.6170.8759.94.1
33Drew Brees302009NOR13-20.5950.8678.94.1
34Craig Morton341977DEN12-20.5660.8577.94.1
35Bernie Kosar231986CLE12-40.4950.757.94.1
36Joe Theismann341983WAS14-20.6210.8759.94.1
37Joe Namath251968NYJ11-30.4960.7866.94.1
38Jim Hart311975STL11-30.4970.78674
39Roman Gabriel271967RAM11-1-20.570.85784
40Jeff Garcia312001SFO12-40.50.7584
41Aaron Rodgers282011GNB14-10.6670.933104
42Bob Griese281973MIA12-10.6190.92384
43Dan Fouts281979SDG12-40.5060.758.13.9
44Troy Aikman261992DAL13-30.570.8139.13.9
45Donovan McNabb282004PHI13-20.6120.8679.23.8
46Matt Schaub312012HOU12-40.5110.758.23.8
47George Blanda351962HOU11-30.5140.7867.23.8
48Ron Jaworski291980PHI12-40.5140.758.23.8
49Tony Romo272007DAL13-30.5830.8139.33.7
50Ken O'Brien251985NYJ11-50.4590.6887.33.7
51Y.A. Tittle361962NYG12-20.5960.8578.33.7
52Kordell Stewart292001PIT13-30.5850.8139.43.6
53John Brodie351970SFO10-3-10.4910.756.93.6
54Joe Ferguson301980BUF11-50.4620.6887.43.6
55Tom Brady302007NWE16-00.775112.43.6
56Kerry Collins241996CAR9-30.450.755.43.6
57Fran Tarkenton361976MIN10-2-10.5310.8086.93.6
58Ken Anderson321981CIN12-40.5290.758.53.5
59Jim Kelly311991BUF13-20.6310.8679.53.5
60Carson Palmer262005CIN11-50.4670.6887.53.5
61Vinny Testaverde311994CLE9-40.4230.6925.53.5
62Jim Plunkett361983RAI10-30.50.7696.53.5
63Jim Plunkett331980OAK9-20.50.8185.53.5
64Jim Plunkett351982RAI8-10.50.8894.53.5
65Drew Brees322011NOR13-30.5950.8139.53.5
66Steve McNair332006BAL13-30.5950.8139.53.5
67Steve Young311992SFO14-20.6570.87510.53.5
68Jim Harbaugh281991CHI11-50.4710.6887.53.5
69Norm Snead331972NYG8-50.3510.6154.63.4
70Jake Plummer292003DEN9-20.5070.8185.63.4
71Jim McMahon261985CHI11-00.69117.63.4
72Jim Harbaugh271990CHI10-40.4710.7146.63.4
73Kurt Warner281999STL12-30.5740.88.63.4
74Earl Morrall381972MIA9-00.62615.63.4
75John Elway361996DEN13-20.6430.8679.63.4

There’s a lot of fascinating results in the table — back-to-back Steve DeBerg seasons in Kansas City, Jim Plunkett finishing with 3.5 more wins than expected three times in a four-year period, a 22-year-old Ben Roethlisberger on one end of the age spectrum, and a 38-year-old Earl Morrall on the other — but I’ll leave the commentary to you guys today. [2]Okay, one more from me. Norm Snead makes the list in a year when he went 8-5? How is that possible? Because he had only one other season in his career with a winning record, a 2-0 mark in the prior … Continue reading

I also looked at the 75 biggest outliers in the negative direction. And while there were some great rookies in the ’98 class, the best of them turned out to be Peyton Manning. Of course, it just didn’t turn out that way in 1998. That year, Manning went 3-13 as the Colts starter, the most out-of-character-bad quarterback record season of all time.

We also see a rookie Troy Aikman occupy the third slot on the list, with 2013 Matt Ryan being the fourth biggest negative outlier (no other player from 2013 appears on either list).

RkQuarterbackAgeYearTmSea RecCar Win%Sea Win%Exp WinsDiff
1Peyton Manning221998IND3-130.6960.18811.1-8.1
2Steve Young251986TAM2-120.6570.1439.2-7.2
3Troy Aikman231989DAL0-110.5706.3-6.3
4Matt Ryan282013ATL4-120.6380.2510.2-6.2
5Jim Kelly261986BUF4-120.6310.2510.1-6.1
6Brett Favre362005GNB4-120.6240.2510-6
7Bert Jones301981BAL2-130.490.1337.3-5.3
8John Elway301990DEN5-110.6430.31310.3-5.3
9Peyton Manning252001IND6-100.6960.37511.1-5.1
10Warren Moon281984HOU3-130.5020.1888-5
11Norm Van Brocklin321958PHI2-9-10.6240.2087.5-5
12Dave Krieg371995ARI4-120.560.259-5
13Fran Tarkenton221962MIN2-11-10.5310.1797.4-4.9
14Jeff George241991IND1-150.3710.0635.9-4.9
15Craig Morton331976NYG2-100.5660.1676.8-4.8
16Dan Pastorini241973HOU0-100.47904.8-4.8
17Phil Simms251980NYG3-100.5970.2317.8-4.8
18Dan Pastorini231972HOU1-110.4790.0835.7-4.7
19Bill Nelsen241965PIT2-100.5610.1676.7-4.7
20Aaron Rodgers252008GNB6-100.6670.37510.7-4.7
21Y.A. Tittle381964NYG1-8-20.5960.1826.6-4.6
22Drew Brees242003SDG2-90.5950.1826.5-4.5
23Marc Bulger312008STL2-130.4320.1336.5-4.5
24Y.A. Tittle241950BAL1-80.5960.1115.4-4.4
25Steve McNair322005TEN4-100.5950.2868.3-4.3
26Bobby Hebert361996ATL3-100.560.2317.3-4.3
27John Hadl221962SDG1-90.5180.15.2-4.2
28Charlie Conerly321953NYG3-80.650.2737.2-4.2
29Jake Plummer262000ARI3-110.5070.2147.1-4.1
30Joe Ferguson341984BUF1-100.4620.0915.1-4.1
31Neil O'Donnell321998CIN2-90.550.1826.1-4.1
32Jim Plunkett251972NWE3-110.50.2147-4
33Jack Kemp321967BUF3-80.6330.2737-4
34Ken Anderson301979CIN4-110.5290.2677.9-3.9
35Billy Kilmer311970NOR2-90.5390.1825.9-3.9
36Bart Starr241958GNB0-6-10.6180.0714.3-3.8
37Jim Zorn231976SEA2-120.4150.1435.8-3.8
38Terry Bradshaw231971PIT5-80.6770.3858.8-3.8
39Dan Marino271988MIA6-100.6130.3759.8-3.8
40Bart Starr231957GNB3-80.6180.2736.8-3.8
41Kurt Warner342005ARI2-80.5740.25.7-3.7
42Steve DeBerg251979SFO2-130.3820.1335.7-3.7
43Jim Everett281991RAM3-130.4180.1886.7-3.7
44Don Meredith251963DAL4-90.5880.3087.6-3.6
45Jim McMahon301989SDG4-70.6910.3647.6-3.6
46Greg Landry331979BAL2-100.4640.1675.6-3.6
47Boomer Esiason341995NYJ2-100.4620.1675.5-3.5
48Carson Palmer312010CIN4-120.4670.257.5-3.5
49Boomer Esiason301991CIN3-110.4620.2146.5-3.5
50Joe Ferguson271977BUF3-110.4620.2146.5-3.5
51Jim Hart351979STL3-100.4970.2316.5-3.5
52Jon Kitna342006DET3-130.4030.1886.5-3.5
53Joe Namath321975NYJ3-100.4960.2316.4-3.4
54Kurt Warner312002STL0-60.57403.4-3.4
55Bernie Kosar271990CLE3-100.4950.2316.4-3.4
56Joe Montana261982SFO3-60.7130.3336.4-3.4
57Norm Snead221961WAS1-12-10.3510.1074.9-3.4
58Tom Brady252002NWE9-70.7750.56312.4-3.4
59Chad Pennington312007NYJ1-70.5430.1254.3-3.3
60Joe Theismann311980WAS6-90.6210.49.3-3.3
61Fran Tarkenton211961MIN2-80.5310.25.3-3.3
62Neil O'Donnell301996NYJ0-60.5503.3-3.3
63Jim Everett331996NOR3-120.4180.26.3-3.3
64Ron Jaworski321983PHI5-110.5140.3138.2-3.2
65Steve DeBerg311985TAM1-100.3820.0914.2-3.2
66Steve DeBerg241978SFO1-100.3820.0914.2-3.2
67Bob Griese221967MIA3-70.6190.36.2-3.2
68Jim Harbaugh341997IND2-90.4710.1825.2-3.2
69Richard Todd271980NYJ4-120.4490.257.2-3.2
70Marc Bulger302007STL2-100.4320.1675.2-3.2
71George Blanda381965HOU3-90.5140.256.2-3.2
72Rodney Peete261992DET2-80.5170.25.2-3.2
73Y.A. Tittle291955SFO4-80.5960.3337.2-3.2
74Brian Sipe321981CLE5-110.5090.3138.1-3.1
75Roman Gabriel351975PHI2-70.570.2225.1-3.1

A few quarterbacks appear in back-to-back seasons on the list, including young versions of Bart Starr, Fran Tarkenton, Dan Pastorini, and DeBerg. Leave your thoughts in the comments. As always, both tables are fully searchable and sortable.

References

References
1 Some might argue that when calculating this “wins over expectation” metric, we should exclude the quarterback’s record from that season. I didn’t want to do that, though, because that would lead to more extreme differences in winning percentages, which would tilt the list towards players with smaller sample sizes. Which I didn’t think fit the intent of this post.
2 Okay, one more from me. Norm Snead makes the list in a year when he went 8-5? How is that possible? Because he had only one other season in his career with a winning record, a 2-0 mark in the prior year. Snead was at times a very good quarterback and at times a not so good one, but his record was an unthinkably bad 52-99-7.
{ 18 comments }