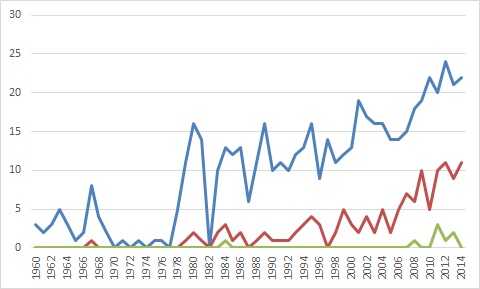
The first 3,000 yard passer came in 1960, when Johnny Unitas reached such feat in the NFL and Jack Kemp and Frank Tripucka did so in the AFL. Joe Namath became the first 4,000-yard passer seven years later, and Dan Marino in 1984 was the first to reach 5,000 yards.
The graph below shows the number of 3,000 yard passers in blue, 4,000-yard passers in red, and 5,000-yard passers in green in each season since 1960. As you can see — and no doubt already knew — passing productivity is on the rise:
But I’d like to drill down a bit as to why the numbers have spiked so much in that graph. It’s not just as simple as saying “passing is easier now,” although that’s a big part of it. But it’s really a combination of a few things:
- The NFL had a 12-game schedule until 1961, when it moved to 14 games (which the AFL had from its existence). The NFL didn’t move to a 16-game schedule until 1978, and of course played a 9-game schedule in ’82 and a 15-game schedule (with up to three games featuring replacement players) in ’87.
- Prior to 1960, there were just 12 teams; in 1970, there were 26, and by ’76, there were 28 teams, which stuck until Carolina and Jacksonville were added in 1995. Now, with 32 teams, it makes sense that there are more 3K and 4K yard passers.
- “Passing is easier now” is only a part of it, and perhaps only a small part of it. League-wide yards per attempt is up, but only slightly, and not noticeably relative to certain other periods in NFL history.
There are two other things going on. One is the number of pass attempts per team game is obviously on the rise. The graph below shows that information for each year since 1950, with the AFL in red:

Just think: teams passed 46% more frequently in 2013 than they did in 1973. That represents an enormous increase, and is obviously a big reason why 3,000 and 4,000 passing yards aren’t really milestones anymore. Ryan Tannehill hit the 4,000-yard mark in 2014… and he averaged just 6.86 yards per attempt! That ranked just 28th among the 33 qualifying quarterbacks.
But there’s one other thing going on here: quarterbacks are staying healthy, and one quarterback is much more likely to take the bulk of his team’s pass attempts than ever before.
In the graph below, I showed the percentage of teams where one quarterback was responsible for at least 75% (in red), 85% (in green), or 95% (in purple). I also included a best-fit linear line.

If one player takes 85% or 95% of his team’s pass attempts, it makes it significantly easier to get to 4,000 yards. From 1970 to 1986, just 21% of teams had a player take 95% of their pass attempts; that number was 40% from 2001 to 2014. Last year, half of all teams saw one quarterback throw 94% of his team’s pass attempts, and 21 teams had one passer with at least 85% of his team’s attempts.
More teams and more games obviously will lead to quarterbacks reaching gross milestones. And yes, we all know passing is getting easier and much more common. But more than ever before, teams are devoting all their passes to one player. But it’s also important to keep in mind that there’s a clear trend towards one player gobbling up all the team pass attempts. That matters, too.

