Twenty quarterbacks started all sixteen games last season:
-
Eli Manning
Tony Romo
Andrew Luck
Russell Wilson
Peyton Manning
Matthew Stafford
Sam Bradford
Aaron Rodgers
Matt Schaub
Ryan Tannehill
Matt Ryan
Christian Ponder
Drew Brees
Ryan Fitzpatrick
Tom Brady
Josh Freeman
Cam Newton
Philip Rivers
Joe Flacco
Andy Dalton
Mark Sanchez started 15 games for the Jets, but was benched for the week 16 game against the Chargers. Carson Palmer (ribs/chest) and Brandon Weeden (shoulder) were each injured in week 16, causing them to sit out week 17 (although Weeden probably could have played if the game meant anything.) In addition, Jay Cutler (concussion) and Robert Griffin III (knee) each missed one — but only one — game due to injury. [1]Griffin was on the injury report twice for head injuries but did not miss a start due to concussions. As for the other seven teams:
- Ben Roethlisberger started 13 games for the Steelers, but missed three games with injuries to his right shoulder and ribs.
- Jake Locker missed five games with a shoulder injury.
- Michael Vick missed six games due to a concussion.
- Blaine Gabbert (right forearm, torn labrum in left shoulder) started the first 10 games of the season for Jacksonville before being placed on injured reserve.
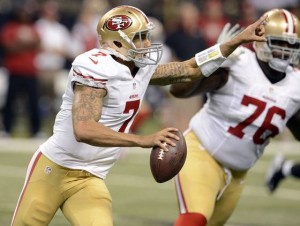
- Alex Smith started the first 9 games for the 49ers before a concussion cleared the way for Colin Kaepernick.
- Matt Cassel started the first five games for Kansas City before a concussion sidelined him; he later replaced Brady Quinn for three games, after Quinn suffered a concussion.
- John Skelton somehow became the opening-day starter in Arizona last year, a relevant fact for nearly four quarters until an ankle sprain sidelined Skelton for a month.
Last year marked the first time in NFL history that 20 different quarterbacks started every game for their team. In fact, week 1 starting quarterbacks were responsible for 89.6% of all quarterback starts over the rest of the year, another NFL record. The table shows the number of teams to start one quarterback in every game, that number expressed as a percentage of the number of teams in the league, and the percentage of games started over the Rest Of the Year by the week 1 starters.
As an aside, many of the missed starts are due to concussions. While that’s not going to make anyone on Park Avenue very happy, it’s fair to wonder how many of those quarterbacks might have still suited up if this was 2002, and not 2012.
References
| ↑1 | Griffin was on the injury report twice for head injuries but did not miss a start due to concussions. |
|---|

