One of my law school professors was very quirky, even by law school professor standards. His preferred examination method was multiple choice, but with a twist. After grading each exam, he would then divide the students into quarters based on their test score. He would then re-examine each question, and measure how the top quarter of students performed on each question relative to the bottom quarter. Any question that more bottom-quarter students answered correctly than top-quarter students would be thrown out, and the exam would be re-graded. As he delicately put out, ‘if the wrong students are getting the question right, and the right students are getting the question wrong, it’s a bad question.’
NFL passing records are falling for a variety of reasons these days, including rules changes and league policies that make the passing game more effective. But there’s another reason: for the first time in awhile, the right people are throwing the most passes in the league. And there’s no better example of that than Drew Brees. Since coming to the Saints in 2006, he’s ranked 1st or 2nd in pass attempts four times, and ranked in the top three in net yards per attempt four times. But even since ’06, we’ve seen the passing game evolve, as the best quarterbacks are now the most likely ones to finish near the top of the leaderboard in pass attempts. In 2010, Peyton Manning had his first 600-attempt season… when he threw 679 passes for the Colts. Tom Brady threw 611 passes last year for the 13-3 Patriots, making New England one of just three teams to threw 600 pass attempts and win 13 or more games in a season. The other two teams? The ’09 Colts and the ’11 Saints.
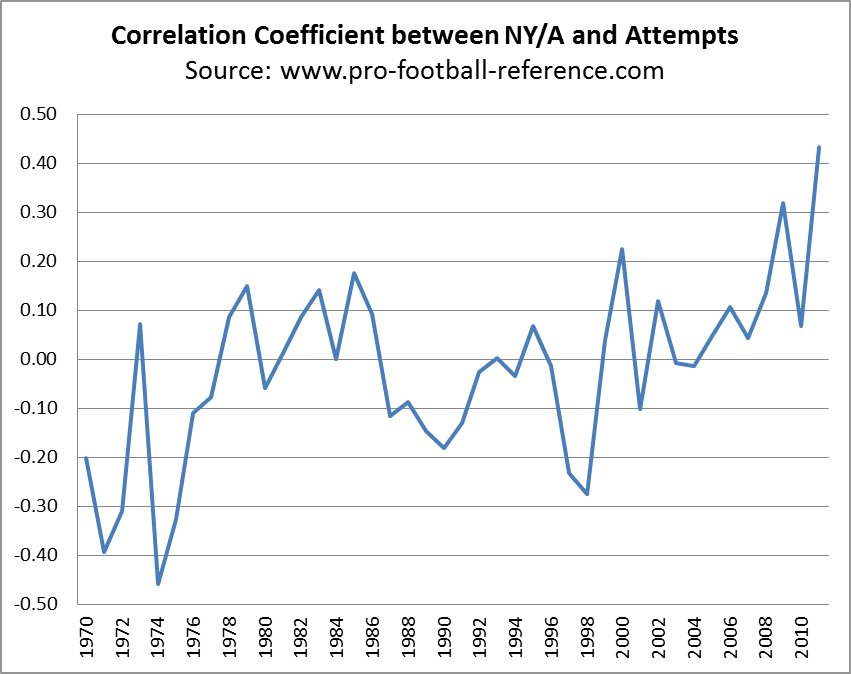
At various points in the history of the NFL, passing was viewed as an alternative to running, and the high-attempt game was the province of the trailing team. But times are changing in the NFL. I calculated each team’s net yards per attempt (NY/A) and total pass attempts (attempts plus sacks) for every year since 1970. Then, I measured the correlation coefficient between NY/A and pass attempts for the league for each of the last 42 seasons. The chart below shows the correlation coefficient between those two variables (NY/A and pass attempts) for the league as a whole for each year since the merger:

The teams with the most attempts in the league last year were the Lions, Patriots and Saints, who went 36-12. While those teams won 76% of their games, the top three teams in pass attempts from 1970 to 2010, on average, won just 44% of their games. The Lions scored 474 points last year, the most by any team since the merger among teams that led the league in pass attempts. In 1995, Troy Aikman and the Cowboys led the league in NY/A, but Dallas ranked second to last in pass attempts. With the elite passers in the game today, I think the game is fundamentally different than it was even fifteen years ago. There are lots of real reasons why league-wide passing rates and averages are increasing. But one Simpson’s Paradox reason is that the best quarterbacks are more likely to be getting a significant number of attempts. As my law professor would say, the right students are getting the questions right.
Previous “Random Perspective On” Articles:
AFC East: Buffalo Bills, Miami Dolphins, New England Patriots, New York Jets
AFC North: Baltimore Ravens, Cincinnati Bengals, Cleveland Browns, Pittsburgh Steelers
AFC South: Houston Texans, Indianapolis Colts, Jacksonville Jaguars, Tennessee Titans
AFC West: Denver Broncos, Kansas City Chiefs, Oakland Raiders, San Diego Chargers
NFC East: Dallas Cowboys, New York Giants, Philadelphia Eagles, Washington Redskins
NFC North: Chicago Bears, Detroit Lions, Minnesota Vikings, Atlanta Falcons
NFC South: Atlanta Falcons, Carolina Panthers, New Orleans Saints, Tampa Bay Buccaneers
NFC West: Arizona Cardinals, San Francisco 49ers, Seattle Seahawks, St. Louis Rams

