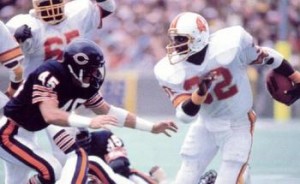
In 1984, James Wilder had 407 carries for Tampa Bay at a time when the league was only beginning to shift away from running back by committee. In fact, by the end of the ’84 season, three of the highest single-season carry totals in NFL history had taken place that year, with Walter Payton and Eric Dickerson joining Wilder as true workhorses. The ’84 Bucs had the most concentrated rushing attack of any team in an era of increasingly concentrated rushing attacks.
Take a look: in ’84, Wilder had 1,544 rushing yards, which represented 86.94% of all Bucs rushing yards. The square of that is 75.58%; sum the squares of all players who gained rushing yards for Tampa Bay last year, and you get a concentration index of 75.87%.
Player | Rush | Yds | Perc | Sqrd |
---|---|---|---|---|
James Wilder | 407 | 1544 | 86.94% | 75.58% |
Steve DeBerg | 28 | 59 | 3.32% | 0.11% |
Mel Carver | 11 | 44 | 2.48% | 0.06% |
Jack Thompson | 5 | 35 | 1.97% | 0.04% |
Adger Armstrong | 10 | 34 | 1.91% | 0.04% |
Michael Morton | 16 | 27 | 1.52% | 0.02% |
Gerald Carter | 1 | 16 | 0.9% | 0.01% |
Scott Dierking | 3 | 14 | 0.79% | 0.01% |
George Peoples | 1 | 2 | 0.11% | 0.00% |
James Owens | 1 | 1 | 0.06% | 0.00% |
Total | 483 | 1776 | 100% | 75.87% |
The average team had a rushing concentration index of 35.5%, and the standard deviation among the teams in 1984 was 13.7%. As a result, Tampa Bay’s rushing concentration index was 2.96 standard deviations above average, known as the Z-Score. That was the 2nd most concentrated score from 1946 to 1984, snugly fit in between the 1966 Patriots (2.93) and 1967 Patriots (2.97).
In 1966, the Patriots led the AFL in rushing attempts and featured a two-back offense with Jim Nance (299 carries) and Larry Garron (101 carries). But since Nance averaged 4.9 yards per carry and Garron just 3.2, Nance wound up rushing for about 74% of the Patriots rushing yards that season. In ’67, New England ran less often, but Nance took a larger share of the load. He had 269 carries to Garron’s 46, and had 76% of all Patriots rushing yards in a very RBBC-centric era. From ’66 to ’67, Nance wasn’t just the top RB in the AFL but in all of pro football. Thanks to his heavy workload, he easily outrushed two HOF RBs in the primes of their career during those seasons.
The table below shows each team that had a Z-Score of at least 1.25 in rushing concentration. Here’s how to read it. In 1991, the Cowboys behind Emmitt Smith had 1,726 rushing yards. [1]This excludes any player who finished the season with negative rushing yards. The squared result of each player’s percentage — i.e., the concentration index — was 82.3%. The standard deviation among all teams that year was 13.9%, and the league average was just 33.9%, giving the ’91 Cowboys a Z-Score of 3.48. In other words, the ’91 Cowboys’ rushing attack was so concentrated for that season that it was 3.48 standard deviations above average. That’s why it ranks 1st in this metric.
Rk | Year | Tm | Top RB | Rush Yds | Sqrd | StDev | Lg Avg | Z-Score |
---|---|---|---|---|---|---|---|---|
1 | 1991 | DAL | Emmitt Smith | 1726 | 82.3% | 13.9% | 33.9% | 3.48 |
2 | 1994 | DET | Barry Sanders | 2080 | 82.2% | 13.3% | 40.2% | 3.15 |
3 | 2007 | ARI | Edgerrin James | 1441 | 72.4% | 10.3% | 40.2% | 3.12 |
4 | 1999 | IND | Edgerrin James | 1660 | 87.7% | 15.6% | 40.1% | 3.06 |
5 | 1967 | BOS | Jim Nance | 1609 | 58.7% | 10% | 29.2% | 2.97 |
6 | 1984 | TAM | James Wilder | 1776 | 75.9% | 13.7% | 35.5% | 2.96 |
7 | 1966 | BOS | Jim Nance | 1968 | 57.8% | 9.7% | 29.3% | 2.93 |
8 | 1961 | CLE | Jim Brown | 2190 | 48.5% | 7.3% | 27.4% | 2.89 |
9 | 2002 | BUF | Travis Henry | 1615 | 79.6% | 12.5% | 44% | 2.84 |
10 | 1983 | RAM | Eric Dickerson | 2274 | 65.9% | 11.1% | 34.5% | 2.84 |
11 | 1980 | HOU | Earl Campbell | 2657 | 55.8% | 9.6% | 28.7% | 2.83 |
12 | 1974 | DEN | Otis Armstrong | 2165 | 47.3% | 7.3% | 26.8% | 2.81 |
13 | 1960 | CLE | Jim Brown | 1982 | 47.5% | 7.5% | 26.5% | 2.81 |
14 | 1988 | DAL | Herschel Walker | 1999 | 60.1% | 10.3% | 31.5% | 2.78 |
15 | 1968 | PHI | Tom Woodeshick | 1411 | 48.6% | 7.7% | 27.4% | 2.77 |
16 | 2000 | IND | Edgerrin James | 1861 | 84.7% | 14.9% | 44% | 2.72 |
17 | 2011 | JAX | Maurice Jones-Drew | 1970 | 67.3% | 11.2% | 37% | 2.70 |
18 | 2014 | DAL | DeMarco Murray | 2355 | 63.7% | 10.9% | 34.9% | 2.64 |
19 | 1977 | CHI | Walter Payton | 2811 | 47.1% | 7.5% | 27.4% | 2.63 |
20 | 1981 | HOU | Earl Campbell | 1737 | 64% | 11.7% | 33.5% | 2.61 |
21 | 1951 | NYG | Eddie Price | 1713 | 37.8% | 6% | 22.2% | 2.60 |
22 | 1975 | BUF | O.J. Simpson | 2974 | 45.2% | 7.1% | 27% | 2.57 |
23 | 1965 | CLE | Jim Brown | 2342 | 47.5% | 7.2% | 29.2% | 2.54 |
24 | 1963 | CLE | Jim Brown | 2671 | 53.3% | 9% | 30.4% | 2.53 |
25 | 1986 | RAM | Eric Dickerson | 2478 | 57.8% | 10.3% | 31.9% | 2.52 |
26 | 1978 | CHI | Walter Payton | 2526 | 46% | 7.2% | 28% | 2.50 |
27 | 1993 | ATL | Erric Pegram | 1597 | 57.2% | 9.1% | 34.6% | 2.48 |
28 | 2014 | PIT | Le'Veon Bell | 1773 | 61.3% | 10.9% | 34.9% | 2.42 |
29 | 2012 | MIN | Adrian Peterson | 2635 | 64.8% | 11.4% | 37.2% | 2.41 |
30 | 1996 | DET | Barry Sanders | 1810 | 74.1% | 14.2% | 40.1% | 2.39 |
31 | 2005 | IND | Edgerrin James | 1703 | 78.8% | 14.9% | 43.3% | 2.39 |
32 | 1985 | TAM | James Wilder | 1644 | 64.7% | 11.5% | 37.3% | 2.38 |
33 | 1988 | IND | Eric Dickerson | 2257 | 55.7% | 10.3% | 31.5% | 2.35 |
34 | 1969 | BOS | Jim Nance | 1506 | 45.9% | 7.4% | 28.5% | 2.35 |
35 | 2012 | TAM | Doug Martin | 1837 | 64% | 11.4% | 37.2% | 2.34 |
36 | 2009 | STL | Steven Jackson | 1786 | 63.9% | 11% | 38.2% | 2.34 |
37 | 2015 | OAK | Latavius Murray | 1463 | 54.9% | 8.9% | 34.2% | 2.33 |
38 | 2013 | DAL | DeMarco Murray | 1504 | 57.8% | 9.5% | 35.8% | 2.31 |
39 | 1946 | PIT | Bill Dudley | 1317 | 27.5% | 4.4% | 17.2% | 2.31 |
40 | 1998 | IND | Marshall Faulk | 1488 | 79% | 15.8% | 42.8% | 2.29 |
41 | 1947 | NYY | Spec Sanders | 2935 | 31.8% | 5.8% | 18.7% | 2.28 |
42 | 1989 | DET | Barry Sanders | 2055 | 53% | 9.2% | 32.3% | 2.25 |
43 | 1991 | DET | Barry Sanders | 1930 | 65.1% | 13.9% | 33.9% | 2.24 |
44 | 1997 | DET | Barry Sanders | 2468 | 70% | 13% | 41.3% | 2.21 |
45 | 2004 | IND | Edgerrin James | 1861 | 71.1% | 13.2% | 41.9% | 2.21 |
46 | 1992 | DET | Barry Sanders | 1644 | 68.5% | 14.2% | 37.3% | 2.20 |
47 | 1989 | IND | Eric Dickerson | 1867 | 52.3% | 9.2% | 32.3% | 2.18 |
48 | 1979 | HOU | Earl Campbell | 2571 | 47.2% | 8.3% | 29.2% | 2.17 |
49 | 1971 | CLE | Leroy Kelly | 1578 | 44.9% | 8.1% | 27.5% | 2.16 |
50 | 1985 | RAI | Marcus Allen | 2262 | 62.2% | 11.5% | 37.3% | 2.16 |
51 | 2006 | ARI | Edgerrin James | 1341 | 75.1% | 13.8% | 45.3% | 2.15 |
52 | 2009 | TEN | Chris Johnson | 2592 | 61.8% | 11% | 38.2% | 2.15 |
53 | 1963 | OAK | Clem Daniels | 1618 | 49.8% | 9% | 30.4% | 2.15 |
54 | 1964 | CLE | Jim Brown | 2171 | 50.5% | 9.5% | 30.1% | 2.15 |
55 | 1995 | DET | Barry Sanders | 1760 | 73.3% | 14.6% | 42.3% | 2.13 |
56 | 1999 | SEA | Ricky Watters | 1424 | 73.1% | 15.6% | 40.1% | 2.12 |
57 | 2001 | GNB | Ahman Green | 1700 | 67.7% | 12.8% | 40.6% | 2.12 |
58 | 1998 | ATL | Jamal Anderson | 2119 | 76.3% | 15.8% | 42.8% | 2.12 |
59 | 2013 | CHI | Matt Forte | 1828 | 55.7% | 9.5% | 35.8% | 2.09 |
60 | 1950 | PIT | Joe Geri | 1659 | 27.4% | 3.4% | 20.2% | 2.09 |
61 | 2010 | TEN | Chris Johnson | 1735 | 64.2% | 12.2% | 39.2% | 2.06 |
62 | 1949 | CHH | Bob Hoernschemeyer | 1080 | 31.8% | 5.8% | 20% | 2.05 |
63 | 1976 | CHI | Walter Payton | 2387 | 41.7% | 7.1% | 27.1% | 2.05 |
64 | 2016 | CHI | Jordan Howard | 1737 | 59.1% | 11.2% | 36.2% | 2.04 |
65 | 1973 | BUF | O.J. Simpson | 3102 | 46.2% | 8.3% | 29.5% | 2.02 |
66 | 1993 | RAM | Jerome Bettis | 2014 | 52.9% | 9.1% | 34.6% | 2.01 |
67 | 1959 | CLE | Jim Brown | 2149 | 50.2% | 10.2% | 29.6% | 2.01 |
68 | 1997 | OAK | Napoleon Kaufman | 1588 | 67.3% | 13% | 41.3% | 2.00 |
69 | 2010 | HOU | Arian Foster | 2069 | 63.5% | 12.2% | 39.2% | 2.00 |
70 | 2006 | STL | Steven Jackson | 1805 | 72.7% | 13.8% | 45.3% | 1.98 |
71 | 1977 | MIN | Chuck Foreman | 1829 | 42.2% | 7.5% | 27.4% | 1.97 |
72 | 1992 | DAL | Emmitt Smith | 2137 | 65.3% | 14.2% | 37.3% | 1.97 |
73 | 1986 | WAS | George Rogers | 1732 | 51.9% | 10.3% | 31.9% | 1.94 |
74 | 1947 | PHI | Steve Van Buren | 1988 | 29.9% | 5.8% | 18.7% | 1.94 |
75 | 1956 | SFO | Hugh McElhenny | 1836 | 35.7% | 5.8% | 24.5% | 1.93 |
76 | 1979 | CHI | Walter Payton | 2492 | 45.2% | 8.3% | 29.2% | 1.93 |
77 | 1973 | WAS | Larry Brown | 1449 | 45.4% | 8.3% | 29.5% | 1.92 |
78 | 1990 | DET | Barry Sanders | 1927 | 50.1% | 9.1% | 32.7% | 1.92 |
79 | 1954 | SFO | Joe Perry | 2509 | 29.3% | 3.8% | 22.2% | 1.90 |
80 | 2005 | NYG | Tiki Barber | 2212 | 71.4% | 14.9% | 43.3% | 1.89 |
81 | 1969 | WAS | Larry Brown | 1532 | 42.5% | 7.4% | 28.5% | 1.89 |
82 | 1965 | NYJ | Matt Snell | 1492 | 42.8% | 7.2% | 29.2% | 1.88 |
83 | 1958 | CLE | Jim Brown | 2526 | 42.2% | 8.4% | 26.5% | 1.88 |
84 | 2004 | SEA | Shaun Alexander | 2095 | 66.5% | 13.2% | 41.9% | 1.86 |
85 | 2010 | STL | Steven Jackson | 1592 | 61.8% | 12.2% | 39.2% | 1.86 |
86 | 1971 | WAS | Larry Brown | 1759 | 42.4% | 8.1% | 27.5% | 1.84 |
87 | 2008 | MIN | Adrian Peterson | 2345 | 59.6% | 11% | 39.5% | 1.84 |
88 | 1964 | NYJ | Matt Snell | 1457 | 47.5% | 9.5% | 30.1% | 1.83 |
89 | 1981 | NOR | George Rogers | 2297 | 54.9% | 11.7% | 33.5% | 1.83 |
90 | 2006 | KAN | Larry Johnson | 2146 | 70.5% | 13.8% | 45.3% | 1.82 |
91 | 2000 | ATL | Jamal Anderson | 1219 | 71.2% | 14.9% | 44% | 1.82 |
92 | 1985 | DAL | Tony Dorsett | 1750 | 58.1% | 11.5% | 37.3% | 1.81 |
93 | 1970 | WAS | Larry Brown | 2021 | 39.6% | 7.1% | 26.7% | 1.80 |
94 | 1972 | WAS | Larry Brown | 2090 | 42% | 6.9% | 29.5% | 1.80 |
95 | 1992 | PIT | Barry Foster | 2156 | 62.8% | 14.2% | 37.3% | 1.79 |
96 | 1968 | CLE | Leroy Kelly | 2031 | 41.1% | 7.7% | 27.4% | 1.79 |
97 | 1979 | PHI | Wilbert Montgomery | 2427 | 43.9% | 8.3% | 29.2% | 1.78 |
98 | 1948 | DET | Camp Wilson | 1360 | 28.8% | 5.7% | 18.7% | 1.78 |
99 | 2012 | TEN | Chris Johnson | 1687 | 57.4% | 11.4% | 37.2% | 1.77 |
100 | 1955 | BAL | Alan Ameche | 1833 | 33.9% | 5.8% | 23.8% | 1.76 |
101 | 1962 | HOU | Charley Tolar | 1742 | 43.2% | 7.7% | 29.7% | 1.75 |
102 | 1970 | NYG | Ron Johnson | 1799 | 39.1% | 7.1% | 26.7% | 1.73 |
103 | 1949 | GNB | Tony Canadeo | 2061 | 29.9% | 5.8% | 20% | 1.73 |
104 | 1975 | ATL | Dave Hampton | 1794 | 39.2% | 7.1% | 27% | 1.72 |
105 | 2015 | ATL | Devonta Freeman | 1610 | 49.5% | 8.9% | 34.2% | 1.72 |
106 | 1983 | ATL | William Andrews | 2229 | 53.5% | 11.1% | 34.5% | 1.72 |
107 | 1954 | CHI | Chick Jagade | 1151 | 28.6% | 3.8% | 22.2% | 1.71 |
108 | 2014 | CHI | Matt Forte | 1461 | 53.5% | 10.9% | 34.9% | 1.70 |
109 | 1957 | CLE | Jim Brown | 1963 | 29.9% | 3.7% | 23.7% | 1.69 |
110 | 2003 | NOR | Deuce McAllister | 2000 | 68.3% | 14.8% | 43.5% | 1.68 |
111 | 1993 | BUF | Thurman Thomas | 1951 | 49.9% | 9.1% | 34.6% | 1.68 |
112 | 1976 | BUF | O.J. Simpson | 2566 | 39% | 7.1% | 27.1% | 1.67 |
113 | 2015 | TAM | Doug Martin | 2162 | 49% | 8.9% | 34.2% | 1.67 |
114 | 2004 | NYG | Tiki Barber | 1916 | 64% | 13.2% | 41.9% | 1.67 |
115 | 1948 | BDA | Mickey Colmer | 1818 | 28.1% | 5.7% | 18.7% | 1.66 |
116 | 1964 | HOU | Sid Blanks | 1353 | 45.8% | 9.5% | 30.1% | 1.66 |
117 | 1952 | RAM | Dan Towler | 1845 | 29.4% | 5.7% | 19.9% | 1.66 |
118 | 2016 | PIT | Le'Veon Bell | 1779 | 54.8% | 11.2% | 36.2% | 1.65 |
119 | 1976 | MIN | Chuck Foreman | 2013 | 38.9% | 7.1% | 27.1% | 1.65 |
120 | 1982 | HOU | Earl Campbell | 799 | 47.6% | 8% | 34.4% | 1.65 |
121 | 2005 | CLE | Reuben Droughns | 1503 | 67.8% | 14.9% | 43.3% | 1.65 |
122 | 1984 | ATL | Gerald Riggs | 1994 | 57.8% | 13.7% | 35.5% | 1.63 |
123 | 1995 | DAL | Emmitt Smith | 2202 | 66% | 14.6% | 42.3% | 1.63 |
124 | 2004 | CIN | Rudi Johnson | 1840 | 63.5% | 13.2% | 41.9% | 1.63 |
125 | 2011 | ATL | Michael Turner | 1840 | 55.3% | 11.2% | 37% | 1.63 |
126 | 1996 | NYJ | Adrian Murrell | 1587 | 63.3% | 14.2% | 40.1% | 1.63 |
127 | 1979 | STL | Ottis Anderson | 2582 | 42.7% | 8.3% | 29.2% | 1.63 |
128 | 1993 | DAL | Emmitt Smith | 2169 | 49.3% | 9.1% | 34.6% | 1.62 |
129 | 2011 | TEN | Chris Johnson | 1438 | 55.1% | 11.2% | 37% | 1.62 |
130 | 1980 | ATL | William Andrews | 2407 | 44.1% | 9.6% | 28.7% | 1.61 |
131 | 1969 | BAL | Tom Matte | 1493 | 40.4% | 7.4% | 28.5% | 1.61 |
132 | 1968 | SFO | Ken Willard | 1800 | 39.8% | 7.7% | 27.4% | 1.61 |
133 | 2001 | CIN | Corey Dillon | 1712 | 61.1% | 12.8% | 40.6% | 1.60 |
134 | 1978 | HOU | Earl Campbell | 2487 | 39.5% | 7.2% | 28% | 1.60 |
135 | 1952 | NYG | Eddie Price | 1636 | 29.1% | 5.7% | 19.9% | 1.60 |
136 | 1982 | RAI | Marcus Allen | 1089 | 47.2% | 8% | 34.4% | 1.60 |
137 | 1997 | NWE | Curtis Martin | 1485 | 62.1% | 13% | 41.3% | 1.60 |
138 | 2002 | NOR | Deuce McAllister | 1766 | 64% | 12.5% | 44% | 1.59 |
139 | 2001 | KAN | Priest Holmes | 2018 | 61% | 12.8% | 40.6% | 1.59 |
140 | 1995 | NWE | Curtis Martin | 1866 | 65.4% | 14.6% | 42.3% | 1.59 |
141 | 2008 | DET | Kevin Smith | 1333 | 56.9% | 11% | 39.5% | 1.59 |
142 | 1961 | GNB | Jim Taylor | 2355 | 39% | 7.3% | 27.4% | 1.59 |
143 | 1980 | STL | Ottis Anderson | 2186 | 43.9% | 9.6% | 28.7% | 1.59 |
144 | 1996 | NWE | Curtis Martin | 1471 | 62.7% | 14.2% | 40.1% | 1.59 |
145 | 1953 | RAM | Dan Towler | 2154 | 30.4% | 5.6% | 21.5% | 1.58 |
146 | 1966 | CHI | Gale Sayers | 1939 | 44.7% | 9.7% | 29.3% | 1.58 |
147 | 1981 | MIN | Ted Brown | 1513 | 52% | 11.7% | 33.5% | 1.58 |
148 | 1995 | ARI | Garrison Hearst | 1363 | 65.1% | 14.6% | 42.3% | 1.57 |
149 | 2003 | BUF | Travis Henry | 1670 | 66.7% | 14.8% | 43.5% | 1.57 |
150 | 2000 | NYJ | Curtis Martin | 1474 | 67.4% | 14.9% | 44% | 1.56 |
151 | 1986 | NYG | Joe Morris | 2245 | 47.9% | 10.3% | 31.9% | 1.56 |
152 | 1989 | KAN | Christian Okoye | 2235 | 46.6% | 9.2% | 32.3% | 1.55 |
153 | 1990 | IND | Eric Dickerson | 1282 | 46.8% | 9.1% | 32.7% | 1.55 |
154 | 1986 | NOR | Rueben Mayes | 2074 | 47.8% | 10.3% | 31.9% | 1.55 |
155 | 2007 | SFO | Frank Gore | 1493 | 56.2% | 10.3% | 40.2% | 1.54 |
156 | 2009 | MIN | Adrian Peterson | 1928 | 55.1% | 11% | 38.2% | 1.54 |
157 | 1957 | CHI | Rick Casares | 1700 | 29.4% | 3.7% | 23.7% | 1.53 |
158 | 1982 | PHI | Wilbert Montgomery | 830 | 46.6% | 8% | 34.4% | 1.53 |
159 | 2002 | SDG | LaDainian Tomlinson | 2137 | 63.1% | 12.5% | 44% | 1.52 |
160 | 1984 | RAM | Eric Dickerson | 2869 | 56.2% | 13.7% | 35.5% | 1.52 |
161 | 1982 | CIN | Pete Johnson | 971 | 46.5% | 8% | 34.4% | 1.52 |
162 | 1998 | DEN | Terrell Davis | 2472 | 66.8% | 15.8% | 42.8% | 1.52 |
163 | 1981 | ATL | William Andrews | 1973 | 51.2% | 11.7% | 33.5% | 1.51 |
164 | 2015 | IND | Frank Gore | 1439 | 47.6% | 8.9% | 34.2% | 1.51 |
165 | 2008 | CHI | Matt Forte | 1673 | 56% | 11% | 39.5% | 1.50 |
166 | 1952 | SFO | Joe Perry | 1916 | 28.5% | 5.7% | 19.9% | 1.50 |
167 | 1978 | GNB | Terdell Middleton | 2023 | 38.8% | 7.2% | 28% | 1.49 |
168 | 1972 | BUF | O.J. Simpson | 2132 | 39.9% | 6.9% | 29.5% | 1.49 |
169 | 2003 | NYJ | Curtis Martin | 1635 | 65.6% | 14.8% | 43.5% | 1.49 |
170 | 1974 | GNB | John Brockington | 1574 | 37.7% | 7.3% | 26.8% | 1.49 |
171 | 1986 | SEA | Curt Warner | 2311 | 47.2% | 10.3% | 31.9% | 1.49 |
172 | 2010 | CIN | Cedric Benson | 1524 | 57.3% | 12.2% | 39.2% | 1.48 |
173 | 2015 | MIN | Adrian Peterson | 2222 | 47.3% | 8.9% | 34.2% | 1.48 |
174 | 1962 | RAM | Dick Bass | 1689 | 41.1% | 7.7% | 29.7% | 1.48 |
175 | 2016 | ARI | David Johnson | 1735 | 52.7% | 11.2% | 36.2% | 1.47 |
176 | 2016 | LAR | Todd Gurley | 1253 | 52.4% | 11.2% | 36.2% | 1.44 |
177 | 1960 | GNB | Jim Taylor | 2153 | 37.2% | 7.5% | 26.5% | 1.44 |
178 | 2007 | SDG | LaDainian Tomlinson | 2046 | 55% | 10.3% | 40.2% | 1.43 |
179 | 1966 | RAM | Dick Bass | 1742 | 43.2% | 9.7% | 29.3% | 1.43 |
180 | 1953 | SFO | Joe Perry | 2240 | 29.4% | 5.6% | 21.5% | 1.41 |
181 | 2004 | NWE | Corey Dillon | 2135 | 60.6% | 13.2% | 41.9% | 1.41 |
182 | 1992 | HOU | Lorenzo White | 1641 | 57.3% | 14.2% | 37.3% | 1.41 |
183 | 1994 | DAL | Emmitt Smith | 1958 | 59% | 13.3% | 40.2% | 1.41 |
184 | 1958 | PHI | Billy Ray Barnes | 1101 | 38.2% | 8.4% | 26.5% | 1.41 |
185 | 1973 | GNB | John Brockington | 1977 | 41.1% | 8.3% | 29.5% | 1.40 |
186 | 2006 | CIN | Rudi Johnson | 1641 | 64.7% | 13.8% | 45.3% | 1.40 |
187 | 1995 | ATL | Craig Heyward | 1394 | 62.6% | 14.6% | 42.3% | 1.40 |
188 | 1975 | CLE | Greg Pruitt | 1856 | 36.9% | 7.1% | 27% | 1.39 |
189 | 1980 | CLE | Mike Pruitt | 1681 | 41.9% | 9.6% | 28.7% | 1.38 |
190 | 1996 | PHI | Ricky Watters | 1886 | 59.5% | 14.2% | 40.1% | 1.36 |
191 | 1974 | BUF | O.J. Simpson | 2094 | 36.7% | 7.3% | 26.8% | 1.36 |
192 | 1983 | SEA | Curt Warner | 2119 | 49.5% | 11.1% | 34.5% | 1.35 |
193 | 2010 | ATL | Michael Turner | 1900 | 55.5% | 12.2% | 39.2% | 1.34 |
194 | 2011 | BAL | Ray Rice | 1996 | 51.9% | 11.2% | 37% | 1.33 |
195 | 1973 | NYG | Ron Johnson | 1488 | 40.5% | 8.3% | 29.5% | 1.33 |
196 | 2004 | WAS | Clinton Portis | 1774 | 59.5% | 13.2% | 41.9% | 1.33 |
197 | 2001 | NOR | Ricky Williams | 1714 | 57.4% | 12.8% | 40.6% | 1.31 |
198 | 1967 | CLE | Leroy Kelly | 2160 | 42.3% | 10% | 29.2% | 1.31 |
199 | 2016 | MIA | Jay Ajayi | 1825 | 50.9% | 11.2% | 36.2% | 1.30 |
200 | 1971 | BUF | O.J. Simpson | 1337 | 38% | 8.1% | 27.5% | 1.30 |
201 | 2006 | NYG | Tiki Barber | 2156 | 63.3% | 13.8% | 45.3% | 1.30 |
202 | 1977 | CLE | Greg Pruitt | 2205 | 37.2% | 7.5% | 27.4% | 1.30 |
203 | 1976 | WAS | Mike Thomas | 2127 | 36.3% | 7.1% | 27.1% | 1.29 |
204 | 1962 | GNB | Jim Taylor | 2464 | 39.6% | 7.7% | 29.7% | 1.29 |
205 | 1971 | GNB | John Brockington | 2235 | 37.9% | 8.1% | 27.5% | 1.29 |
206 | 1997 | GNB | Dorsey Levens | 1916 | 58% | 13% | 41.3% | 1.29 |
207 | 1972 | GNB | John Brockington | 2138 | 38.4% | 6.9% | 29.5% | 1.28 |
208 | 1959 | SFO | J.D. Smith | 1839 | 42.8% | 10.2% | 29.6% | 1.28 |
209 | 1972 | NYG | Ron Johnson | 2022 | 38.3% | 6.9% | 29.5% | 1.28 |
210 | 2011 | STL | Steven Jackson | 1681 | 51.2% | 11.2% | 37% | 1.27 |
211 | 1955 | PIT | Fran Rogel | 1285 | 31.1% | 5.8% | 23.8% | 1.27 |
212 | 2001 | WAS | Stephen Davis | 1955 | 56.8% | 12.8% | 40.6% | 1.27 |
213 | 1990 | KAN | Barry Word | 1954 | 44.1% | 9.1% | 32.7% | 1.26 |
214 | 1990 | DEN | Bobby Humphrey | 1872 | 44.1% | 9.1% | 32.7% | 1.25 |
215 | 2003 | NYG | Tiki Barber | 1568 | 61.9% | 14.8% | 43.5% | 1.25 |
It’s impossible to write about rushing concentration and not discuss Edgerrin James. He has six seasons in the top 61, but perhaps more impressively, his teams have 5 of the top 15 most highly concentrated rushing offenses in league history. That’s remarkable. Ditto goes for Jim Brown, whose teams basically finished 1st in 8 of his 9 seasons playing pro football.
References
↑1 | This excludes any player who finished the season with negative rushing yards. |
---|