
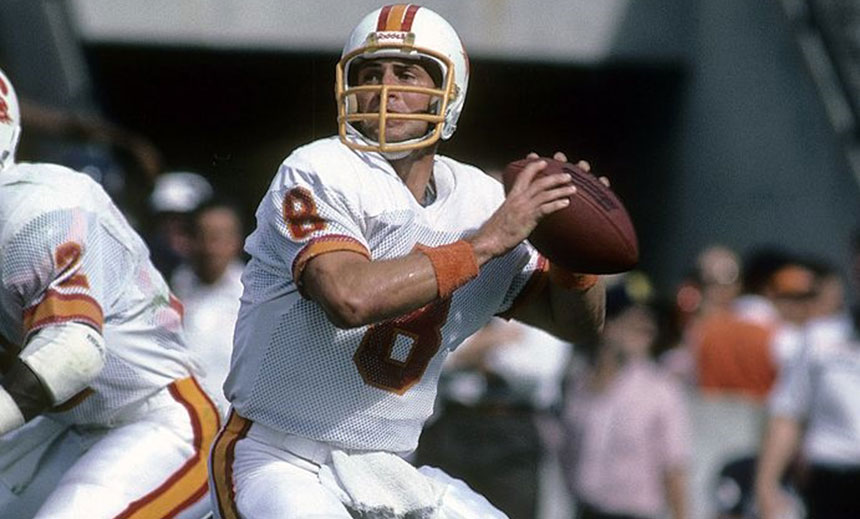
Young as a Yuck
One way to “deal” with this is to add X number of games of .500 play to both sides. I’ve used 40 games before, which is probably within the range of reasonable. This helps smooth out small sample sizes: Young would therefore be 111-53 with the 49ers (0.677) and 23-36 (.390) outside of San Francisco. As you can see, his 49ers adjusted winning percentage only changes by about 6% by adding 40 games of .500 play, but his Tampa Bay adjusted winning percentage rises by 23% because of the small sample size. That’s the point. Now, Young has a 29% better adjusted winning percentage in San Francisco than outside of San Francisco.
Plummer? His Denver record would become 59-35 (.628), while his non-Broncos record would be 50-72 (.410), giving him a 22% better adjusted winning in Denver.
I did this for every quarterback in NFL history (prior to 2017) and checked to see which passers had the biggest differentials in terms of adjusted winning percentage as quarterback of one team (minimum 10 starts) versus the rest of their career. Young was in fact the leader by this metric, with Plummer coming in at #4. Steve DeBerg was 2nd: he was 21 games under .500 in Tampa Bay and 21 games under .500 in San Francisco, and he also went 7-9 in his starts in Denver, Miami, and Atlanta. On the other hand, he was 31-20-1 as the starter with Kansas City. As a result, his adjusted winning percentage was 23% higher with the Chiefs than it was outside of Kansas City.
Billy Kilmer went an impressive 50-23-1 later in his career as a Redskins starter, but just 11-28 with the Saints (and 0-1 with the 49ers) at the beginning of his career. In other words, he was a 1970s Plummer. Here’s how to read the table below, using Jim Plunkett — who was 19 games above .500 with the Raiders, and 19 games under .500 when not with the Raiders as an example. Plunkett went 38-19 with the Raiders for a 0.667 winning percentage and a 0.598 adjusted winning percentage (after adding 40 games of .500 play). When not with the Raiders, Plunkett was 34-53 for a 0.391 winning percentage that jumps to 0.425 after adding 40 games of .500 play. Plunkett’s actual difference in winning percentage was 0.276, but just difference in adjusted winning percentage was 0.173, the 10th largest on the list.
What stands out to you?
Also, we can look at this from the other direction as well — seeing which quarterbacks had the worst records with one team (minimum 10 games) versus the rest of their career. While this is in many ways just the opposite of the early chart — Tampa Bay Young, New Orleans Kilmer, and Arizona Plummer rank in the top four — it does bring in a few other names. Perhaps most notable? Craig Morton, who had a remarkable three-team split: he was 18 games over .500 as the Cowboys starting quarterback in the late ’60s and early ’70s, 17 games under .500 with the Giants in the mid-’70s, and then 18 games above .500 with the Broncos at the back end of his career. That’s just…. weird.
As always, please leave your thoughts in the comments.