Regular readers know I’m not prone to exaggeration. I’m more of a splits happen kind of guy. But Super Bowl XLVIII will, in my opinion, be the greatest passing showdown ever. This year’s Super Bowl checks in as the greatest offensive/defensive showdown in Super Bowl history (and the greatest of any game, regular or postseason, since 1950). That’s because the passing showdown between Denver and Seattle is arguably the greatest of any game in all of pro football history.
How can we quantify such a statement? I’m glad you asked. If you recall, I labeled the 2013 Seahawks as one of the five greatest pass defenses since 1950. For new readers, Adjusted Net Yards per Attempt is calculated as follows:
(Gross Pass Yards + 20 * PTDs – 45 * INTs – Sack Yds)/(Attempts + Sacks)[/math]
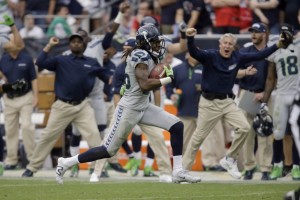
In 2013, the Seahawks allowed 3.19 Adjusted Net Yards per Attempt (Seattle allowed 3,050 gross passing yards and 16 TDs, while forcing 28 interceptions and recording 298 yards lost on sacks, all over 524 pass attempts and 44 sacks.). The other 31 pass defenses allowed an average of 5.98 ANY/A, which means Seattle’s pass defense was 2.79 ANY/A above average. Over the course of the 568 opponent dropbacks, this means the Seahawks provided 1,582 adjusted net yards of value over average. In other words, the Seattle pass defense provided 99 adjusted net yards over average on a per game basis. Let’s be clear: the Legion of Boom is not just a hype machine, and Richard Sherman, Earl Thomas, Kam Chancellor, and company form the best secondary in the league.
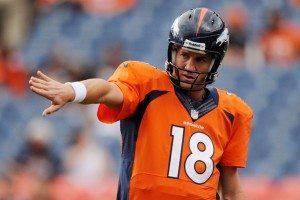
Denver’s offense was even more dominant, although that’s to be expected: in general, the spread in offensive ratings is a bit wider than it is on the defensive side of the ball. Denver threw for 5,572 gross passing yards and 55 touchdowns, while throwing just 10 interceptions and losing only 128 yards to sacks. The Broncos had 675 pass attempts and were sacked just 20 times, giving them an 8.77 ANY/A average. The other 31 offenses averaged only 5.79 ANY/A, meaning the Broncos were 2.98 ANY/A better than average. Over the 695 dropbacks the team had, that means Denver provided 2,072 adjusted net yards of value average average. On a per-game basis, that’s 130 yards of value each game!So, how do we judge the greatest passing showdowns in football history? Denver’s passing offense gets a rating of +130, while Seattle’s pass defense gets a rating of +99. Those two numbers have a Harmonic Mean of 112. That’s easily the most in Super Bowl history. In fact, it’s the third most in any playoff game ever, and those other two games each have asterisks.
In the 1961 AFL, the Houston Oilers behind George Blanda, Bill Groman, and Charley Hennigan possessed an incredible passing offense (rating of +167), while the San Diego Chargers had a dominant pass defense (+129). But in the early days of the AFL, the talent pool was diluted; this would be akin to comparing two teams in non-BCS conferences with out-of-this-world statistics to a matchup between champions in two power conferences. For what it’s worth, Houston won the game — played in San Diego — but with a catch. The Oilers offense was shut down, as Blanda went 18/40 for 160 yards with 1 touchdown and 5 interceptions…. but Houston won 10-3, as Jack Kemp threw four picks for the Chargers.
In 1982, the Chargers had a pass offense rating of +128, and Dan Fouts and Wes Chandler had record-setting years (and Charlie Joiner and Kellen Winslow were pretty darn good, too). In the playoffs, San Diego faced a familiar foe: the Miami Dolphins (+103 in pass defense), the team the Chargers beat in one of the greatest playoff games ever just a year earlier. This time around, Fouts was intercepted five times, and Miami won, 34-13. But this game gets an asterisk because the ratings of Miami and San Diego are inflated due to the strike-shortened season: over 9 games, it’s much easier to produce absurdly dominant numbers. Given that Denver and Seattle produced nearly identical numbers over 16 games, the accomplishments of the Broncos and Seahawks are undoubtedly more impressive.
In fact, if you include the regular season, just one other set of teams in all NFL history produced a higher harmonic mean using these metrics. And that was in 1943, when Sid Luckman’s Bears (+172) faced the Packers (+84) twice during the regular season, with Chicago winning 21-7 at home and tying twenty-one all in Green Bay. But with team rosters diluted due to World War II, we can comfortably vault this year’s Super Bowl above those games.And that’s it. Excluding the early years of the AFL, the rate-friendly 1982 season, and the WWII-affected 1943 season, no game in football history — regular or postseason — has produced a passing showdown quite like the 2013 Broncos against the 2013 Seahawks. Since the merger, just three passing attacks — the 1984 Dolphins (+147 per game), 2004 Colts (+138), and 2011 Packers (+136) — have added more value to their teams than this year’s Broncos. [1]The rest of the top 10: the 2007 Patriots (+128), ’82 Chargers (+182), ’89 49ers (+113), ’00 Rams (+108), ’11 Saints (+105), ’99 Rams (+103). And on defense, only the ’02 Bucs (+108), ’70 Vikings (+108), and ’82 Dolphins (+103) have added more value per game than the 2013 Seahawks. The fact that two top five attacks were in the same season was a stroke of luck; the odds of them facing each other would be quite low. To see them square off in the Super Bowl is mind-bogglingly good fortune for the viewer.
Remember, Denver and Seattle have a harmonic mean of 112; the highest games last year were in the regular season and clocked in at 61, in the games between Green Bay (+56 pass offense) and Chicago (+67 pass defense). Two years ago it was 70, between New Orleans (+105) and Houston (+53). The last playoff game that comes close to this one was in 2008, when the Chargers (+76) went into Pittsburgh (+97), producing a Harmonic mean of 97.
As for the best passing showdowns in the Super Bowl?
- Super Bowl III (Harmonic mean of 88): New York Jets (+83 pass offense) vs. Baltimore Colts (+94 pass defense). In the midst of the guarantee, it’s easy to forget a couple of things: Joe Namath and the Jets had a fantastic pass offense, and the ’68 Colts had one of the greatest defenses ever. Baltimore was outstanding in all phases, but probably best against the pass. The Colts forced 29 interceptions and allowed only 9 passing touchdowns. We can chalk this up to a win for the high-powered offense, although running back Matt Snell and the Jets defense were arguably more important than the contributions of Namath.
- Super Bowl XXXVII (83): Oakland (+67) vs. Tampa Bay (+108). We all know what happened in the Jon Gruden Bowl, and the Bucs pass defense dominated the game. Rich Gannon was forced into five interceptions, and three were returned for touchdowns.
- Super Bowl I (79; 78): Green Bay (+94) vs. Kansas City (+68) and Kansas City (+76) vs. Green Bay (81). Yes, this game shows up as the #3 and #4 passing showdowns. Bart Starr and the Packers had the best pass offense and best pass defense in the NFL (measured by ANY/A), while Len Dawson and the Chiefs had the best pass offense and best pass defense in the AFL. The Packers won 35-10, although I suppose that doesn’t tell us very much, does it? Both quarterbacks played fairly well: Starr was 16/23 for 250 yards and 2 TDs (with one pick), while Dawson was 16/27 for 211 yards with a touchdown and an interception.
- Super Bowl II (75): Oakland (+68) vs. Green By (+83). Daryle Lamonica and the ’68 Raiders had an unbelievable offense, averaging over 33 points per game in the AFL. By 1968, the Packers were no longer a great team, but Green Bay still possessed a great pass defense. Lamonica and the Raiders were largely contained, however, and trailed 26-7 before throwing a pick six to Herb Adderley in the fourth quarter.
- Super Bowl XLI (74): Indianapolis (94) vs. Chicago (62). I don’t think anyone is surprised to see this game on the list. In one sense, the Colts/Bears Super Bowl is even more of a passing showdown than Broncos/Seahawks in one sense. That’s because Chicago was strictly a defensive team and the Colts were there on the back of Peyton Manning‘s offense, while at least these two teams appear more balanced (particularly the NFC representative). If we exclude Super Bowl I, this evens up the record of great passing offenses to 2-2.
- Super Bowl XLIII (56): Arizona (56) vs. Pittsburgh (97). In the modern era, this game — along with Colts/Bears and Raiders/Bucs — stands out as the best examples of great passing attack vs. great pass defense on the biggest stage. In this game, Arizona lost, but Kurt Warner was not to blame. In fact, Warner threw for 377 yards and 3 touchdowns on 43 pass attempts, before Ben Roethlisberger hit Santonio Holmes for the game-winning touchdown. Could you see Russell Wilson doing the same to Golden Tate after a great game by Manning in this year’s Super Bowl? Perhaps. Of course, Warner does get a demerit for a pick six thrown to James Harrison at the end of the first half.
As great as Super Bowl XLIII was, this game could be even better. Studies like this help to remind me how historic of a showdown this game really will be. Let me close with the 110 playoff matches since 1960 that had a harmonic mean of at least 50. As always, the table is fully sortable and searchable. If you type in “Manning” you will discover that this is the seventh time Manning has led an elite offense into battle against an elite defense. So far, he’s 4-3, and 4-1 since 2006.
References
| ↑1 | The rest of the top 10: the 2007 Patriots (+128), ’82 Chargers (+182), ’89 49ers (+113), ’00 Rams (+108), ’11 Saints (+105), ’99 Rams (+103). |
|---|


